Abstract
To initiate V(D)J recombination for generating the adaptive immune response of vertebrates, RAG1/2 recombinase cleaves DNA at a pair of recombination signal sequences, the 12- and 23-RSS. We have determined crystal and cryo-EM structures of RAG1/2 with DNA in the pre-reaction and hairpin-forming complexes up to 2.75 Å resolution. Both protein and DNA exhibit structural plasticity and undergo dramatic conformational changes. Coding-flank DNAs extensively rotate, shift, and deform for nicking and hairpin formation. Two intertwined RAG1 subunits crisscross four times between the asymmetric pair of severely bent 12/23-RSS DNAs. Location-sensitive bending of 60° and 150° in 12- and 23-RSS spacers, respectively, must occur for RAG1/2 to capture the nonamers and pair the heptamers for symmetric double-strand breakage. DNA pairing is thus sequence-context dependent and structure specific, which partly explains the "beyond 12/23" restriction. Finally, catalysis in crystallo reveals the process of DNA hairpin formation and its stabilization by interleaved base stacking.
🔬 Techniques
💻 Software
✨ Fluorophores
🔬 Cell Lines
🏭 Microscope Brands
🧪 Reagent Suppliers
📷 Detectors
💻 Software Details
💾 Data Repositories
🏛️ Research Organizations (ROR)
Affiliated research institutions:
📋 Methods
Contact for Reagent and Resource Sharing
Email contact for further information, reagent and resource sharing: weiy@niddk.nih.gov .
Data and Software Availability
The accession codes for the crystal structures of the HFC and PRC reported in this paper are PDB: 5ZDZ, 5ZE0-2, and 6CIK-M ( Table S1 ). The cryoEM density maps and the atomic models derived from these maps are deposited in the EMDB: 7470 and 7480 and PDB: 6CG0 and 6CIJ, respectively ( Table S2 ).
Protein and DNA preparation
The mouse core RAG1/2 (wildtype or E962Q mutant RAG1 aa 384-1008 and RAG2 aa 1-359, tRAG1/2 (RAG1 aa 459-1008) and extended RAG1/2 (RAG1 aa 265-1040 and RAG2 aa 1-520 with a T490A mutation) proteins were expressed as N-terminal His 6 -MBP fusions in HEK293T cells and purified as previously described ( Kim et al., 2015 ), except that one extra step of Mono Q anion exchange chromatography was added after amylose affinity purification to improve protein purity and eliminate a trace amount of random DNA. The salt concentration in the protein eluted from amylose column was lowered before purification on a Mono Q 10/100 GL anion exchange column (GE Healthcare). Mono Q was pre-equilibrated with 50 mM HEPES (pH 7.3), 100 mM KCl, 5% glycerol, 2 mM DTT, 0.1 mM EDTA. RAG1/2 protein was eluted by a linear gradient of 100–500 mM KCl. The purified RAG1/2 protein was buffer exchanged into a storage buffer containing 25 mM HEPES (pH 7.3), 500 mM KCl, 20% glycerol, 0.1 mM EDTA, 2 mM DTT, concentrated to 4–6 mg/ml, and stored at −80°C. Human HMGB1 (1-163 amino acids) was prepared as reported previously ( Grundy et al., 2009 ). The coding sequences of Human HMGB1-A box (aa 1-78) and HMGB1-B box (aa 88-163 amino acids) were PCR amplified and subcloned into the pET15 vector with an N-terminal MBP-tag. Proteins were expressed in BL21(DE3) cells by IPTG induction. After harvesting, cells were lysed by sonication in lysis buffer (20 mM TRIS (pH 8.0), 0.5 M KCl, 1 mM TCEP (pH7.0), 1 mM EDTA and protease inhibitor cocktail (Roche)). All purification steps were carried out at 4°C. The lysate was cleared by centrifugation at 35,000 rpm for 1 h and loaded onto amylose resin (NEB). After washing with 100X column volumes of lysis buffer, protein was eluted with lysis buffer supplemented with 40 mM maltose. Eluted protein was treated with PreScission protease to cleave off the His 6 -MBP-tag at 4°C overnight. Further purification included HiTrap Heparin, HiTrap SP, and a HiLoad 16/60 Superdex 75 column (GE Healthcare) in the final buffer containing 20 mM Tris (pH 8.0), 0.1 M KCl, and 1 mM TCEP. After adding glycerol to 20% final concentration, the protein was stored at −80°C before use. 12- and 23-RSS DNAs used for structural analyses and binding and cleavage assays ( Table S3 ) were synthesized as ssDNA (Integrated DNA Technologies). Long oligonucleotides (>36 nucleotides) were purified by 8–15% TBE-Urea PAGE in a small gel cassette (Life Technologies). Gel purified oligonucleotides were then loaded onto a Glen Gel-Pak column (Glen Research) and eluted in TE buffer. dsDNA was annealed in a Thermocycler in annealing buffer containing 20 mM Tris-HCl, pH 8.0, 0.5 mM EDTA, 50 mM NaCl. To generate 3´-dideoxy oligos, 14 or 15 nucleotides of coding DNA were annealed with a complementary oligo with a 5´ overhang of 10 nucleotides (to create length difference) and incubated with ddATP, Klenow polymerase (NEB) in Klenow reaction buffer at 37°C for 2 hours. The reaction was stopped by addition of 2X volume of stop solution (90% v/v formamide, 0.025% SDS, and 50 mM EDTA). After heat denaturation, the 3´-dideoxy oligo was purified by TBE-urea PAGE. The procedure for assembly and purification of the PRC and HFC was similar to that of the SEC complex described previously ( Kim et al., 2015 ). Pure wildtype or E962Q-RAG1/2 tetramer, intact or pre-nicked 12RSS, intact or pre-nicked 23RSS, and HMGB1 (aa 1-163) were mixed at 1:1.2:1.2:2 molar ratio in buffer containing 25 mM HEPES (pH 7.3), 100 mM KCl, 5 µM ZnCl 2 , 1 mM TCEP and 5 mM divalent cation (Ca 2+ for WT enzyme-substrate complex or Mg 2+ for 3´-dideoxy pre-nicked 12/23-RSS DNAs or E962Q mutant RAG1/2) and incubated at 37°C for 20 min. To remove the His 6 -MBP fusion tags from the PRC and HFC complexes, PreScission protease was added at a 1:100 mass ratio (protease to RAG1/2) and incubated overnight at 4°C. The non-tagged RAG1/2:12RSS:23RSS:HMGB1 complex (1:1:1:1 ratio) was separated from free-MBP, PreScission protease, excess DNA and HMGB1 by size exclusion chromatography on a HiLoad 16/600 Superdex 200 pg column (GE Healthcare) in buffer containing 25 mM HEPES (pH 7.3), 100 mM KCl, 5% glycerol, 0.1 mM EDTA, 1 mM TCEP, 5 mM divalent cation.
Show full methods section
Contact for Reagent and Resource Sharing
Email contact for further information, reagent and resource sharing: weiy@niddk.nih.gov .
Data and Software Availability
The accession codes for the crystal structures of the HFC and PRC reported in this paper are PDB: 5ZDZ, 5ZE0-2, and 6CIK-M ( Table S1 ). The cryoEM density maps and the atomic models derived from these maps are deposited in the EMDB: 7470 and 7480 and PDB: 6CG0 and 6CIJ, respectively ( Table S2 ).
Protein and DNA preparation
The mouse core RAG1/2 (wildtype or E962Q mutant RAG1 aa 384-1008 and RAG2 aa 1-359, tRAG1/2 (RAG1 aa 459-1008) and extended RAG1/2 (RAG1 aa 265-1040 and RAG2 aa 1-520 with a T490A mutation) proteins were expressed as N-terminal His 6 -MBP fusions in HEK293T cells and purified as previously described ( Kim et al., 2015 ), except that one extra step of Mono Q anion exchange chromatography was added after amylose affinity purification to improve protein purity and eliminate a trace amount of random DNA. The salt concentration in the protein eluted from amylose column was lowered before purification on a Mono Q 10/100 GL anion exchange column (GE Healthcare). Mono Q was pre-equilibrated with 50 mM HEPES (pH 7.3), 100 mM KCl, 5% glycerol, 2 mM DTT, 0.1 mM EDTA. RAG1/2 protein was eluted by a linear gradient of 100–500 mM KCl. The purified RAG1/2 protein was buffer exchanged into a storage buffer containing 25 mM HEPES (pH 7.3), 500 mM KCl, 20% glycerol, 0.1 mM EDTA, 2 mM DTT, concentrated to 4–6 mg/ml, and stored at −80°C. Human HMGB1 (1-163 amino acids) was prepared as reported previously ( Grundy et al., 2009 ). The coding sequences of Human HMGB1-A box (aa 1-78) and HMGB1-B box (aa 88-163 amino acids) were PCR amplified and subcloned into the pET15 vector with an N-terminal MBP-tag. Proteins were expressed in BL21(DE3) cells by IPTG induction. After harvesting, cells were lysed by sonication in lysis buffer (20 mM TRIS (pH 8.0), 0.5 M KCl, 1 mM TCEP (pH7.0), 1 mM EDTA and protease inhibitor cocktail (Roche)). All purification steps were carried out at 4°C. The lysate was cleared by centrifugation at 35,000 rpm for 1 h and loaded onto amylose resin (NEB). After washing with 100X column volumes of lysis buffer, protein was eluted with lysis buffer supplemented with 40 mM maltose. Eluted protein was treated with PreScission protease to cleave off the His 6 -MBP-tag at 4°C overnight. Further purification included HiTrap Heparin, HiTrap SP, and a HiLoad 16/60 Superdex 75 column (GE Healthcare) in the final buffer containing 20 mM Tris (pH 8.0), 0.1 M KCl, and 1 mM TCEP. After adding glycerol to 20% final concentration, the protein was stored at −80°C before use. 12- and 23-RSS DNAs used for structural analyses and binding and cleavage assays ( Table S3 ) were synthesized as ssDNA (Integrated DNA Technologies). Long oligonucleotides (>36 nucleotides) were purified by 8–15% TBE-Urea PAGE in a small gel cassette (Life Technologies). Gel purified oligonucleotides were then loaded onto a Glen Gel-Pak column (Glen Research) and eluted in TE buffer. dsDNA was annealed in a Thermocycler in annealing buffer containing 20 mM Tris-HCl, pH 8.0, 0.5 mM EDTA, 50 mM NaCl. To generate 3´-dideoxy oligos, 14 or 15 nucleotides of coding DNA were annealed with a complementary oligo with a 5´ overhang of 10 nucleotides (to create length difference) and incubated with ddATP, Klenow polymerase (NEB) in Klenow reaction buffer at 37°C for 2 hours. The reaction was stopped by addition of 2X volume of stop solution (90% v/v formamide, 0.025% SDS, and 50 mM EDTA). After heat denaturation, the 3´-dideoxy oligo was purified by TBE-urea PAGE. The procedure for assembly and purification of the PRC and HFC was similar to that of the SEC complex described previously ( Kim et al., 2015 ). Pure wildtype or E962Q-RAG1/2 tetramer, intact or pre-nicked 12RSS, intact or pre-nicked 23RSS, and HMGB1 (aa 1-163) were mixed at 1:1.2:1.2:2 molar ratio in buffer containing 25 mM HEPES (pH 7.3), 100 mM KCl, 5 µM ZnCl 2 , 1 mM TCEP and 5 mM divalent cation (Ca 2+ for WT enzyme-substrate complex or Mg 2+ for 3´-dideoxy pre-nicked 12/23-RSS DNAs or E962Q mutant RAG1/2) and incubated at 37°C for 20 min. To remove the His 6 -MBP fusion tags from the PRC and HFC complexes, PreScission protease was added at a 1:100 mass ratio (protease to RAG1/2) and incubated overnight at 4°C. The non-tagged RAG1/2:12RSS:23RSS:HMGB1 complex (1:1:1:1 ratio) was separated from free-MBP, PreScission protease, excess DNA and HMGB1 by size exclusion chromatography on a HiLoad 16/600 Superdex 200 pg column (GE Healthcare) in buffer containing 25 mM HEPES (pH 7.3), 100 mM KCl, 5% glycerol, 0.1 mM EDTA, 1 mM TCEP, 5 mM divalent cation.
Crystallization and diffraction data collection
Crystals were grown by hanging drop vapor diffusion at 4°C. The HFC crystals were produced by mixing equal volumes of the complex (at ∼5 mg/ml protein) and reservoir solution containing 100 mM MES (pH 6.8), 10–15 % PEG 3350 and 200 mM potassium formate in each droplet. Crystals appeared in 3 days and reached a maximum size in 3 to 6 weeks. Crystals were cryo-protected in reservoir solution supplemented with 25 % ethylene glycol and flash cooled in liquid nitrogen. HFC crystallized in the P2 1 space group with one RAG1/2 heterotetramer, one 12RSS, one 23RSS, and one HMGB1 in each asymmetric unit. Intact/intact, intact/nicked, and nicked/intact PRC complexes were grown in similar crystallization conditions containing 12–18% PEG3350, 200 mM NaNO 3 or KNO 3 , or NaCl, and 50–100 mM HEPES (pH 6.9) or MES (pH 7.0). Crystals of intact/intact, intact/nicked, and nicked/intact PRC complexes, which initially diffracted X-rays to 7Å resolution, were dehydrated at 4°C in the crystallization droplets against well solutions of crystallization buffer with 4% stepwise increments of PEG3350 up to 35% ( v/v ), for 30 min at each step. Mn 2+ (5mM) was included at a final step of dehydration of the inactivated mutant (E962Q) RAG1/2 and incubated overnight. The harvested crystals were cryo-protected in the final dehydration solution supplemented with 5%, 10% and 15% (v/v) glycerol stepwise and then flash cooled in liquid nitrogen. All X-ray diffraction data were collected at 100K on beamline 22ID (SER-CAT) of the Advanced Photon Source at Argonne National Laboratory. All data were processed and scaled by XDS ( Kabsch, 2010 ) or HKL2000 ( Otwinowski and Minor, 1997 ). Crystal structure determination and refinement Both HFC and PRC structures were determined by molecular replacement using Phaser-MR in PHENIX ( Adams et al., 2010 ) with the apo RAG1/2 structure (PDB: 4WWX) as a search model. The initial model derived from Phaser-MR consisted of one RAG1/2 heterotetramer per asymmetric unit (chains A-D).
Electron density for the 12- and 23-RSS
DNAs was obvious in the HFC, but in the PRC the end of the coding flank of 23RSS and some base pairs at and beyond the nonamer ends on both RSSs were not as well defined. The DNAs, HMGB1, and flexible regions in RAG1/2 were manually built iteratively in COOT ( Emsley et al., 2010 ), and all structures were refined using PHENIX. Highly flexible regions of protein and DNA with ambiguous density were not included in the model. The intact/nicked structure was used as a template to determine structures of intact/intact and nicked/intact complexes. Secondary structure restraints and non-crystallographic two-fold symmetry averaging restraints were used throughout the refinement. The final HFC model contains amino acids 385-1008 of RAG1 and amino acids 1-351 of RAG2, and one Zn 2+ ion in each RAG1 subunit. The N-terminal residues 384-390 are disordered in one RAG1 subunit. Due to poor electron densities, residues 82-87 and 336-340 of RAG2 were not included in the final model. The final refinement statistics are shown in Table S1 . Restraints on base pairs and base stacking of DNA were also applied. The Ramachandran plot and model quality were calculated with MolProbity. All structural figures were prepared with PyMOL ( www.pymol.org ).
CryoEM sample preparation and data collection
To obtain cryoEM images of the HFC, an extended form of RAG1/2 with RING finger and PHD domains included was used rather than core RAG1/2. With core RAG1/2, a severe problem of preferential orientation was always encountered, regardless of what kind of RSS DNAs were used, and only a biased map could be obtained. By using extended RAG1/2, we overcame the preferential orientation problem. HFC containing extended RAG1/2 (0.2 mg/ml) was loaded on C-flat CF-1.2/1.3-;4C holey carbon grids (3µl each), blotted for 4 s, and flash-frozen in liquid ethane in a Vitrobot at 100% humidity. The frozen grids were stored in liquid nitrogen and loaded into a Titan Krios electron microscope operated at 300 kV for automated image acquisition with Leginon ( Suloway et al., 2005 ). Movies were recorded on a Gatan K2 Summit direct electron detector, using the super-resolution mode at 130K nominal magnification (calibrated pixel size of 1.07Å on the sample level, corresponding to 0.535Å in super-resolution mode) and defocus values ranging from −1.4 to −3.0 µm. The dose rate at the detector was set to about 5.5 electrons per physical pixel per second. The total exposure time for each movie was 12s, which was fractionated into 60 frames of sub-images, with 0.2s per frame. The first and last two frames were removed during motion correction, and the remaining frames were aligned and summed to generate a dose-weighted micrograph using Motioncorr2 ( Zheng et al., 2017 ). Micrographs without dose weighting were also generated and used for defocus determination and particle picking. The micrographs with dose weighting were phase-flipped using Bsoft ( Heymann, 2001 ). Out of 2300 dose-weighted micrographs obtained in a continuous session, 1688 micrographs were selected by manual screening, and 693,167 particles were initially picked from these selected micrographs using Gautomatch (developed by Dr. K. Zhang; http://www.mrc-lmb.cam.ac.uk/kzhang/Gautomatch/ ) and extracted in RELION-2.1 ( Fernandez-Leiro and Scheres, 2017 ). Using the extracted particles, an initial map at ∼3.5Å resolution was obtained with cryoSPARC ( Punjani et al., 2017 ) and served as the reference for 3D structure classification with RELION ( Scheres, 2012 ). A low-pass (15 Å) filtered map generated from the coordinates of our crystal structure of HFC using EMAN2 ( Ludtke, 2016 ) worked equally well as the reference for 3D classification with RELION. Two cycles of 3D classification were performed to classify the extracted particles. In the first cycle, 3 classes were assigned, and one of them showed good structural features and was thus selected for the second cycle of classification. In the second cycle, 4 classes were assigned, 3 of which showed a clear NBD domain and the fourth contained partial structural features. One of the 3 good classes showed the partial linker between A- and B-boxes of HMGB1 bound to the 23RSS. 139,781 particles belonging to the 3 classes and 49,624 in the class with the partial linker were then selected to refine the models and generate the 3.17 Å and 3.90 Å maps in C1 symmetry using 3D auto-refine in RELION, and the maps were sharpened using post-processing also in RELION. All reported resolutions are based on the “gold standard” refinement procedures and the 0.143 Fourier Shell Correlation (FSC) criterion ( Swint-Kruse and Brown, 2005 ). Local resolution was estimated using Resmap ( Kucukelbir et al., 2014 ). For model building, we first fit our 2.75Å HFC crystal structure into the cryoEM map using Chimera, and then manually adjusted and re-built the model according to the cryoEM density in COOT ( Emsley et al., 2010 ). Phenix real-space refinement was used to refine the model. MolProbity and EMRinger ( Barad et al., 2015 ) were used to validate the final model. The refinement statistics are shown in Table S2 . HMGB1 requirement in the hairpin formation reaction For hairpin formation, 55 nM pre-nicked 12- and 23- RSS DNAs, of which 12RSS was 5´- labeled with 6-FAM on the 16-bp coding flank ( Table S3 ) were incubated with 100 nM RAG1/2 in the reaction buffer (20 mM HEPES (pH 7.3), 80 mM KCl, 1 mM CaCl 2 , 1 µM ZnCl 2 , and 0.1 mg/ml BSA) in the presence of 50 nM to 100 nM HMGB1, or a single A- or B-box, at 22 °C for 5 min. Reaction was initiated by addition of 5 mM MgCl 2 and terminated at the indicated time points by mixing with 2X volume of stop solution (90% v/v formamide, 0.025% SDS, and 50 mM EDTA). After heat denaturation, reaction products were resolve on 15% polyacrylamide TBE-urea gels, visualized on a Typhoon PhosphorImager, and quantified using ImageQuant software. Fluorescence-based substrate, intermediate and product DNA binding assays The fluorescence-based DNA binding assays were performed in a binding buffer containing 20 mM HEPES (pH 7.5), 100 mM KCl, 2 mM DTT, 0.1 mg/ml BSA, 1 mM MgCl 2 , 0.1 mM EDTA, and 1% glycerol. For binding of intact or nicked RSS DNA substrates with 16 bp coding ends, 20 nM 5´-Cy5-labeled 12- or 23-RSS and an equal amount of unlabeled 23- or 12-RSS were incubated with 40 nM HMGB1 and mouse cRAG1/2 E962Q tetrameric protein at concentrations from 2 to 1024 nM at 25°C for 5 min. For binding of 16 bp hairpin products, 40 nM cleaved 12RSS and 40 nM 23RSS without coding flank, and 80 nM 5´-Cy5-labeled hairpin coding-flank products were incubated with HMGB1 and cRAG1/2 as described above. Fluorescence polarization values were measured on a CLARIOstar instrument, and the binding curves and K d values were plotted and calculated with Graphpad Prism software (version 7.0). Plots of biochemical data are shown with the mean ± SD from three independent experiments. Comparison of DNA binding and cleavage by tRAG1/2 and cRAG1/2 DNA binding assays were carried out in a binding buffer containing 25 mM HEPES (pH 7.5), 60 mM KCl, 1 mM DTT, 0.1 mg/ml BSA, 1 mM CaCl 2 and 0.1 mM EDTA, with either wildtype cRAG1/2 or tRAG1/2. Either pre-nicked 12- or 23-RSS DNA (each 20 nM) was FAM-labeled on the 5´-coding flank and incubated with WT tRAG1/2 at concentrations from 2 to 400 nM at 25°C for 5 min. DNA binding by WT cRAG1/2 to pre-nicked 12/23-RSS DNA with the FAM-labeled 12RSS was also measured in the presence of 20 nM HMGB1 as a reference. The K d values were generated in the same way as described above. Cleavage assays were performed in the reaction buffer containing 25 mM HEPES (pH 7.5), 60 mM KCl, 1 mM DTT, 0.1 mg/ml BSA, and 5 mM MgCl 2 or 5 mM MgCl 2 plus 2 mM MnCl 2 . Pre-nicked 12- and 23-RSS DNA each with a 16 bp coding flank and both FAM-labeled at 60 nM were incubated with 50 nM (based on the heterotetrameric MW) WT cRAG1/2 or tRAG1/2 and 120 nM HMGB1 at 37°C for 0–80 min. Reactions were stopped by adding an equal volume of the formamide buffer (95% (v/v) formamide and 12 mM EDTA and 0.3% bromophenol blue) and heating at 95°C for 10 min. Cleavage products were separated by 15% TBE-urea PAGE, visualized and quantified using a Typhoon PhosphorImager (GE Healthcare).
Supplementary Material Supp figures and tables Figure S1. Related to Figure 1. CryoEM structure of HFC. Figure S2. Related to Figure 1. Requirement of HMGB1 in RSS-binding and cleavage by RAG1/2. Figure S3. Related to Figure 1. Comparison of the crystal structure of mouse HFC and the cryoEM structure of zebrafish HFC. Figure S4. Related to Figure 2. Superimposable crystal structures of PRC complexes with intact/intact, intact/nicked and nicked/intact 12/23-RSS DNAs. Figure S5. Related to Figure 3. NBD domain and nonamer binding are necessary for DNA cleavage by RAG1/2. Figure S6. Related to Figure 4. Similar protein interactions made by 12- and 23-RSS DNAs. Figure S7. Related to Figure 6. Formation of the catalytically competent active sites requires both DNA substrate and correct divalent cations. Table S1. Related to Figure 1 & 2.
X-ray diffraction data and structure refinement
Statistics of HFC and PRC. Table S2. Related to Figure 1. Statistics of cryoEM data collection and structure refinement of HFC. Table S3. Related to Figure 1, 4 & 5. Oligos used in structural and biochemical studies. movie1 Movie 1 . Related to Figure 1. Morphing of structural transition from apo to PRC complex. A front view of RAG1/2 dimer with RAG1 subunits shown as blue and green and RAG2 in magenta. The NBD domains tilt more severely in the DNA bound form than in the apo protein. On the Y-arms, each RAG2 moves slightly, and ZnH2 of RAG1 significantly. movie2 Movie 2 . Related to Figure 1. Morphing of structural transition from apo to PRC complex. A top view of RAG1/2 dimer reveals the slight movement of RAG2 towards RAG1 on the same Y-arm as ZnH2 opens out significantly for DNA binding. movie3 Movie 3 . Related to Figure 2. Morphing of structural transition from PRC to HFC. A front view of RAG1/2 dimer with RAG1 subunits shown as blue and green and RAG2 in magenta. The 12RSS DNA is shown in yellow and 23RSS in orange. The NBD domains move a little, probably because of different crystal lattice contacts. The A-box bound to the 23RSS nonamer-spacer junction slides more than 4Å along the minor groove because of crystal lattice contacts in the PRC structure. The Y-arms together with the nicked DNAs extend outwards to make space for hairpin formation. movie4 Movie 4 . Related to Figure 2. Morphing of structural transition from PRC to HFC. A top view of RAG1/2 dimer reveal the ‘hugging” movement of RAG2 and ZnH2 brings the two coding flank DNAs tilted toward RAG2 and closer to each other. Maneuvering the coding flank DNA is important for positioning the scissile phosphate and 3´-OH nucleophile for hairpin formation.
📊 Figures
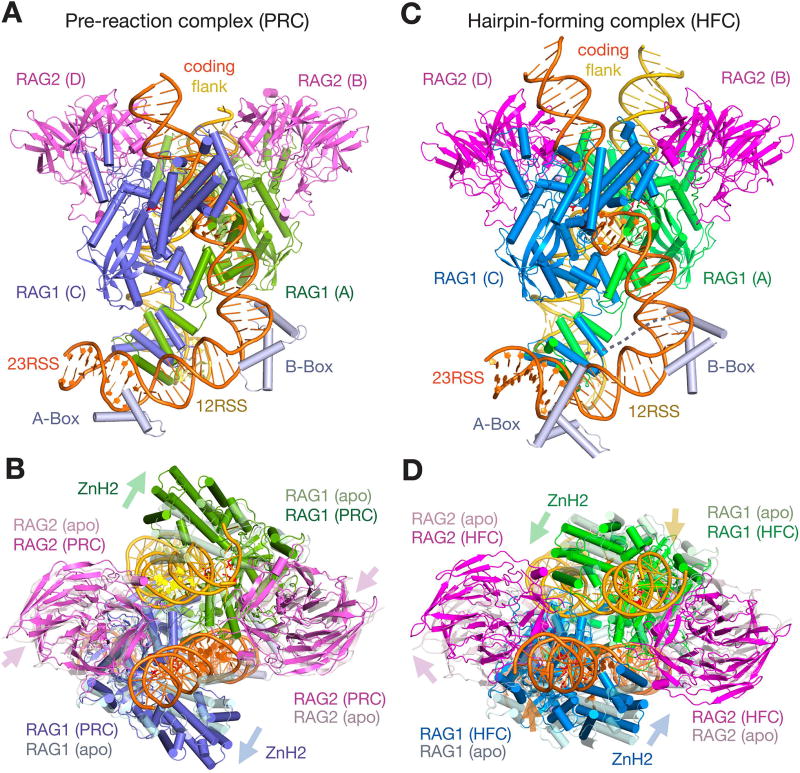
Figure 1
Structures of RAG1/2 PRC and HFC complexes with 12/23-RSS DNAs. A, B . The front (A) and top (B) views of pre-reaction complex (PRC). C, D . The front (C) and top (D) views of hairpin-forming complex ...
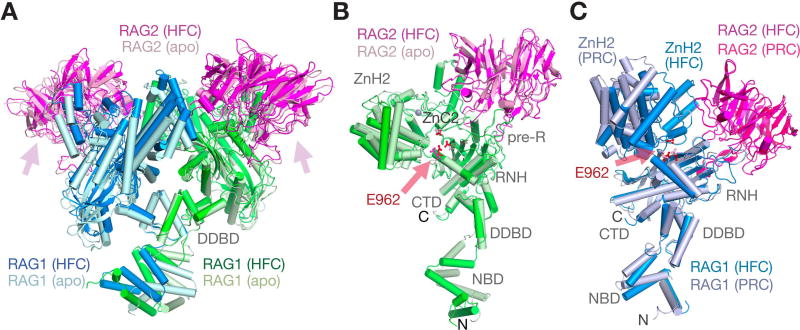
Figure 2
Structural rearrangement of RAG1/2. A . Superposition of the Y-shaped RAG1/2 dimer in apo (light colors) and HFC (darker colors) by their DDBD domains shows the large rotational movement of NBD domain...
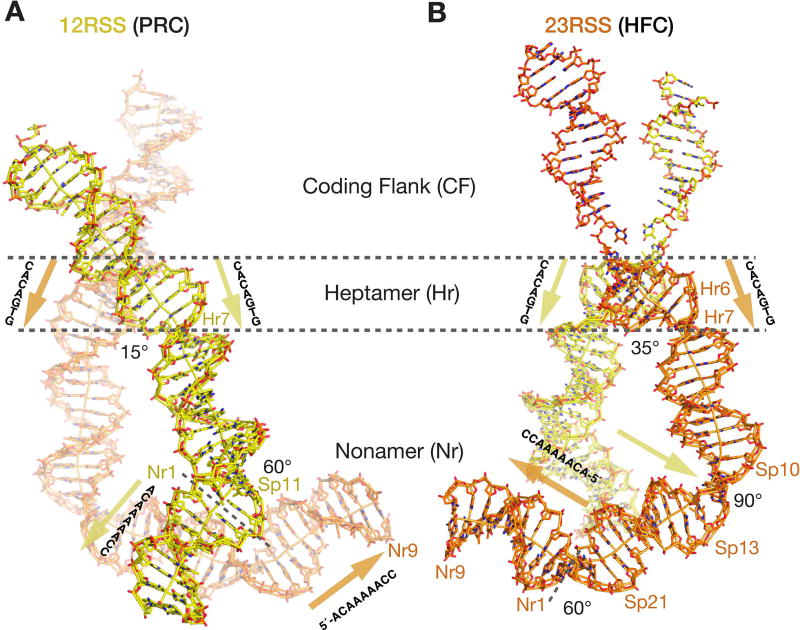
Figure 3
The overall curvature of 12/23-RSS DNAs. A, B . Stick representation of the RSS DNAs in the PRC with 12RSS (yellow) in the front (A) and the HFC with 23RSS (orange) in the front (B). The borders separ...
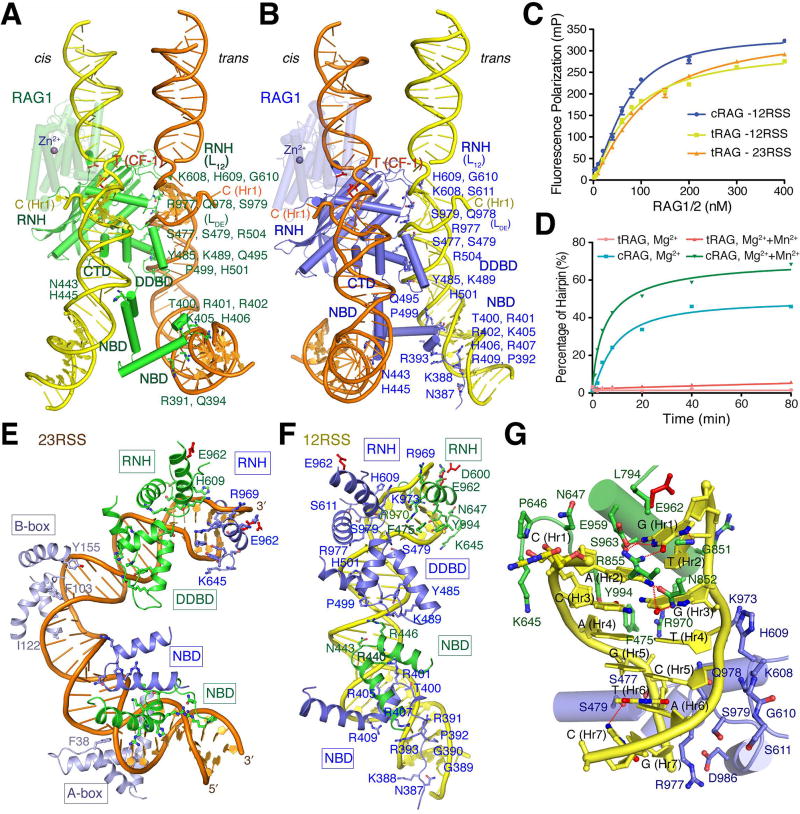
Figure 4
RSS DNA recognition. (A and B) 23RSS is dominantly bound by NBD, DDBD and RNH of RAG1-A (green) (shown in A), but cleaved by RAG1-C (blue), while 12RSS is dominantly bound by RAG1-C (blue) (shown in B...
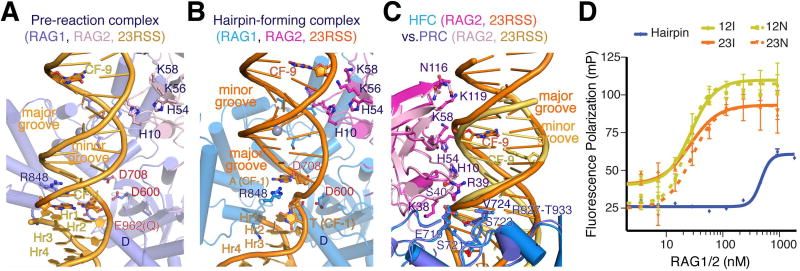
Figure 5
Coding flank recognition. A, B . Coding flanks in the PRC (A) and HFC (B) are bound by RAG1-C (blue) and RAG2 (pink) in the same Y-arm. The coding flank in the HFC is rotated by u223c180u00b0 and tran...
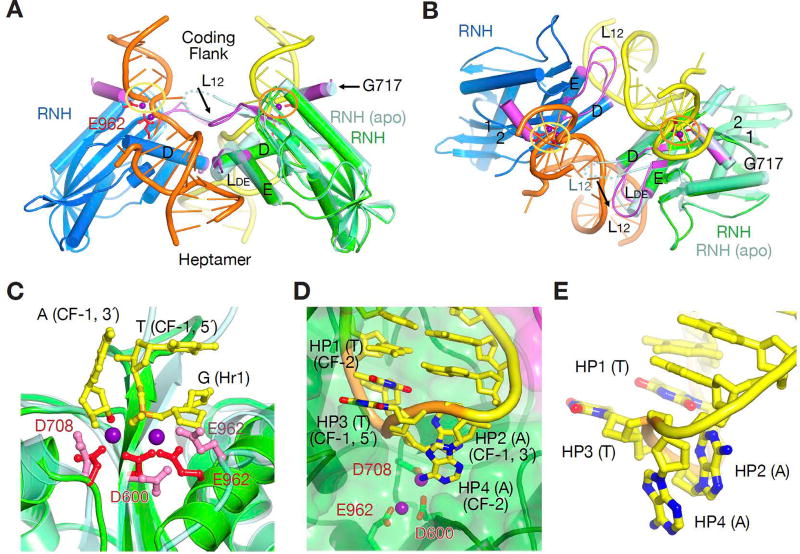
Figure 6
The active site and hairpin formation. (A and B) Formation of the active catalytic centers in the HFC (darker green and blue RNH domains) depends on coupling of two RAG1 subunits, the correct DNA conf...
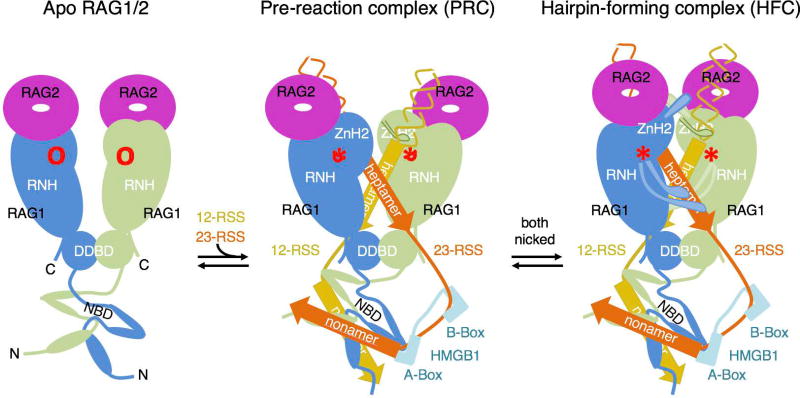
Figure 7
Cartoon diagrams of the reaction process of RAG1/2 from the apo form, to PRC and HFC.
Figure images are served from the NIH/NLM PubMed Central Open Access Subset or Europe PMC; copyright remains with the publishers and authors.
💬 Discussion
0 commentsNo comments yet. Be the first to start a discussion!
Leave a Comment