Abstract
Abstract The bacterial Type VI secretion system (T6SS) assembles from three major parts: a membrane complex that spans inner and outer membranes, a baseplate, and a sheath–tube polymer. The baseplate assembles around a tip complex with associated effectors and connects to the membrane complex by TssK. The baseplate assembly initiates sheath–tube polymerization, which in some organisms requires TssA. Here, we analyzed both ends of isolated non‐contractile Vibrio cholerae sheaths by cryo‐electron microscopy. Our analysis suggests that the baseplate, solved to an average 8.0 Å resolution, is composed of six subunits of TssE/F 2 /G and the baseplate periphery is decorated by six TssK trimers. The VgrG/PAAR tip complex in the center of the baseplate is surrounded by a cavity, which may accommodate up to ~450 kDa of effector proteins. The distal end of the sheath, resolved to an average 7.5 Å resolution, shows sixfold symmetry; however, its protein composition is unclear. Our structures provide an important step toward an atomic model of the complete T6SS assembly.
🔬 Techniques
🧬 Organisms
✨ Fluorophores
🧪 Sample Preparation
🏭 Microscope Brands
📷 Detectors
🔎 Objectives
💻 Software Details
💾 Data Repositories
🏛️ Research Organizations (ROR)
Affiliated research institutions:
📋 Methods
VipA/VipB sheath preparation Sheath preparation was done as described previously (Brackmann et al , 2017 ). Briefly, overnight cultures were diluted and regrown in fresh LB to a final optical density at 600 nm of 1. Cells were collected, resuspended, and lysed. After removal of cell debris, the supernatant was subjected to ultraspeed centrifugation in order to collect VipA/VipB sheath. The sample containing sheath was washed and then used for SDS–PAGE. Preparation of sheath from Hcp‐limited cells was done with following modifications: After reaching an optical density at 600 nm of 1, arabinose was added to the cells in a final concentration of 0.02% to induce Hcp expression. Cells were centrifuged immediately for 6 min at 5,000 × g and room temperature, resuspended, and lysed. Ultraspeed centrifugation and washing steps were performed as described previously (Brackmann et al , 2017 ).
Fluorescence microscopy
Fluorescence microscopy and image processing were carried out as described previously (Brackmann et al , 2017 ). Briefly, for hcp complementation experiments, overnight cultures were washed once in LB, diluted 1:100 into fresh medium supplemented with appropriated antibiotics, and cultivated to an optical density (OD) at 600 nm of 1. Cells were concentrated to OD 10, subsequently spotted on a LB 1% agarose pad containing 0.02% L‐arabinose, and covered with a glass coverslip. Bacteria were directly imaged for 30–40 min at 25°C. To carry out fluorescence microscopy experiments, we used a Nikon Ti‐E‐inverted motorized microscope with Perfect Focus System and Plan Apo 100× Oil Ph3 DM (NA 1.4) objective lens. SPECTRA X light engine (Lumencor) and ET‐GFP (Chroma #49002) filter set was used to excite and filter fluorescence. The setup further contained a sCMOS camera pco.edge 4.2 (PCO, Germany) (pixel size 65 nm) and VisiView software (Visitron Systems, Germany) to record images. Temperature was set to 30°C, and humidity was regulated to 95% by an Okolab T‐unit (Okolab). Fiji (Schindelin et al , 2012 ) was used for additional image processing as described previously (Basler et al , 2013 ).
Show full methods section
VipA/VipB sheath preparation Sheath preparation was done as described previously (Brackmann et al , 2017 ). Briefly, overnight cultures were diluted and regrown in fresh LB to a final optical density at 600 nm of 1. Cells were collected, resuspended, and lysed. After removal of cell debris, the supernatant was subjected to ultraspeed centrifugation in order to collect VipA/VipB sheath. The sample containing sheath was washed and then used for SDS–PAGE. Preparation of sheath from Hcp‐limited cells was done with following modifications: After reaching an optical density at 600 nm of 1, arabinose was added to the cells in a final concentration of 0.02% to induce Hcp expression. Cells were centrifuged immediately for 6 min at 5,000 × g and room temperature, resuspended, and lysed. Ultraspeed centrifugation and washing steps were performed as described previously (Brackmann et al , 2017 ).
Fluorescence microscopy
Fluorescence microscopy and image processing were carried out as described previously (Brackmann et al , 2017 ). Briefly, for hcp complementation experiments, overnight cultures were washed once in LB, diluted 1:100 into fresh medium supplemented with appropriated antibiotics, and cultivated to an optical density (OD) at 600 nm of 1. Cells were concentrated to OD 10, subsequently spotted on a LB 1% agarose pad containing 0.02% L‐arabinose, and covered with a glass coverslip. Bacteria were directly imaged for 30–40 min at 25°C. To carry out fluorescence microscopy experiments, we used a Nikon Ti‐E‐inverted motorized microscope with Perfect Focus System and Plan Apo 100× Oil Ph3 DM (NA 1.4) objective lens. SPECTRA X light engine (Lumencor) and ET‐GFP (Chroma #49002) filter set was used to excite and filter fluorescence. The setup further contained a sCMOS camera pco.edge 4.2 (PCO, Germany) (pixel size 65 nm) and VisiView software (Visitron Systems, Germany) to record images. Temperature was set to 30°C, and humidity was regulated to 95% by an Okolab T‐unit (Okolab). Fiji (Schindelin et al , 2012 ) was used for additional image processing as described previously (Basler et al , 2013 ).
Mass spectrometry
Mass spectrometry was carried out as described previously (Brackmann et al , 2017 ). Briefly, samples were dissolved in TN‐buffer, reduced, and alkylated. Proteins were digested overnight and supplemented with TFA to a final concentration of 1%. Peptides were cleaned up using PreOmics Cartridges (PreOmics, Martinsried, Germany) following the manufacturer's instructions. After drying the samples under vacuum, the peptides were resuspended in 0.1% aqueous formic acid solution at a concentration of 0.5 mg/ml. 0.5 μg of peptides of each sample was subjected to LC‐MS analysis as described previously (Brackmann et al , 2017 ). MS1 and MS2 scans were acquired at a target setting of 1E6 ions and 10,000 ions, respectively. The collision energy was set to 35%, and one microscan was acquired for each spectrum. All raw files acquired by DDA were converted to mgf format using msconvert (version 3.0, ProteoWizard, http://proteowizard.sourceforge.net/ ). The files were searched against a decoy (consisting of forward and reverse protein sequences) database of predicted protein sequence of V. cholerae (Uniprot, Organism ID: 243277, download date 11/07/2016, containing known contaminants, resulting in a total of 3,784 proteins) using Mascot (Matrix Science, version 2.4). The search parameters were set as follows: full tryptic specificity was required (cleavage after lysine and arginine residues unless followed by proline); up to three missed cleavages were allowed; carbamidomethyl (C) was set as a fixed modification; oxidation (M) and acetyl (Protein N‐term) were set as variable modifications; 10 ppm precursor mass tolerance; and 0.6‐Da fragment mass tolerance for CID tandem mass spectra. After importing the result files to Scaffold ( http://www.proteomesoftware.com , version 4), the FDR rate was set to < 1% for protein identifications by the local Scaffold FDR algorithm based on the number of decoy hits. Negative‐stained sample preparation, data acquisition, and image processing An aliquot of 3 μl of sheath sample was applied onto freshly glow‐discharged carbon‐coated 300‐mesh copper grid, blotted, washed with 10 μl of TN‐buffer, blotted again, and stained with 2% uranyl acetate for 10 s. 200 images were acquired using CM200FEG microscope (Philips) on TVIPS F416 CMOS camera, operated at 200 kV at a nominal magnification of 38,000×, corresponding to pixel size of 2.81 Å. Contrast transfer function for each micrograph was estimated using CTFFIND4 (Rohou & Grigorieff, 2015 ). 2,248 particles corresponding to the ends of extended T6SS assemblies were picked using XMIPP manual picking utility within SCIPION framework (de la Rosa‐Trevín et al , 2016 ). Extracted particles were phase‐flipped and subjected for reference‐free 2D classification without CTF correction in RELION1.4 (Scheres, 2012 ).
Cryo‐EM sample preparation and data acquisition
An aliquot of 3 μl of sheath sample was applied onto freshly glow‐discharged Quantifoil R2/1 holey carbon grids (Quantifoil Micro Tools GmbH, Germany), blotted for 3 s, and vitrified using a Vitrobot MK4 (FEI Corp., The Netherlands). The chamber was maintained at 4°C and 100% humidity during the blotting process.
Data of the isolated
T6SS assemblies were acquired using Titan Krios microscope (FEI Corp.) equipped with an energy filter (slit width 20 eV) on a K2 Summit direct electron detector (Gatan Inc., USA) in counting mode, operated at 300 kV and at a nominal magnification of 130,000×, corresponding to a calibrated pixel size of 1.06 Å, and a defocus ranging from 1.5 to 3 μm. 9,202 movie series were collected automatically using the SerialEM software (Mastronarde, 2005 ). For each movie, 40‐frame exposures were taken at 0.4 s per frame (16 s total exposure time), using a dose rate of 5e‐/pixel/s.
Image processing
Movie frames were aligned using MotionCorr2 (Zheng et al , 2017 ) to correct for specimen motion. The averages of the aligned frames were used for data processing within SCIPION 1.0.1 (de la Rosa‐Trevín et al , 2016 ). The contrast transfer function of each micrograph was estimated using the Gctf 1.06 program (Zhang, 2016 ). Baseplates and distal ends were manually selected from the micrographs using XMIPP manual picking utility in SCIPION 1.0.1 and extracted with a box size of 512 pixels. Particles were binned to have the box size of 256 pixels, corresponding to the pixel size of 2.12 Å. 21,446 baseplate and distal‐end particles were classified into 20 classes using reference‐free 2D classification with RELION1.4. After 2D classification, a total of 2,660 baseplates and 3,710 distal ends were used for 3D refinement and classification. Best baseplate and distal‐end class averages were used for initial volume estimation using XMIPP RANSAC protocol in SCIPION (Vargas et al , 2014 ). Resulted volumes were low‐pass‐filtered to 60 Å and used as a reference model for 3D auto‐refinement. C6 symmetry was imposed during 3D refinement. Better‐resolved rigid sheath densities from baseplate and distal‐end reconstructions were used for the soft mask creation for subsequent focused 3D refinement with small local angular sampling. Finally, refined particles and model were imported into RELION2.1 (Kimanius et al , 2016 ) for the auto‐refinement using solvent‐flattened FSCs. This procedure is suggested for elongated particles, when the protein complex represents a relatively small fraction of the reconstructed volume. This procedure resulted in 8.7 Å resolution baseplate and 7.5 Å resolution distal‐end reconstructions. Tight mask around baseplate wedge and first sheath ring was created and focused 3D classification, and further refinement of the best class with 1,265 baseplate particles was performed with RELION2.1, which resulted in resolution improvement from 8.5 to 8 Å. Straightforward baseplate reconstruction with C3 symmetry resulted in a map with strong artifacts. These artifacts most likely appeared due to the six‐start sheath helix, occupying majority of the volume inside the particle. Instead, symmetry relaxation from C6 to C3 was performed with relion_particle_symmetry_expand utility from RELION2.1, followed by masked 3D classification without alignment. Smooth soft mask lacking sixfold‐related features was created around the baseplate region. The resulting 11 Å resolution model showed the same features as a sixfold symmetrized model and trimeric features of the VgrG spike. Local resolution variations of the baseplate and distal‐end maps were estimated with Resmap (Kucukelbir et al , 2014 ). To perform focused refinement of the connector protein region, we low‐pass filtered the refined baseplate map to 80 Å and generated a small mask around TssK region with Segger (Pintilie et al , 2010 ) in UCSF Chimera (Pettersen et al , 2004 ; Goddard et al , 2007 ). Mask was prepared for RELION2.1 with relion_mask_create with extended width and soft edge of five pixels. The subsequent masked 3D classification without alignment and focused 3D refinement of the best 3D class (Scheres, 2016 ) resulted in the connector protein density of 10 Å resolution. Models segmentation and interpretation Baseplate and distal‐end reconstructions were rendered, segmented, and interpreted using UCSF Chimera (Pettersen et al , 2004 ; Pintilie et al , 2010 ). Volume‐to‐mass scale coefficient was calculated for the proteins with available X‐ray crystallographic structure (Leiman et al , 2010 ). Accession numbers The EM map was deposited to EMDB ( http://www.emdatabank.org ) with accession number for the single‐particle reconstruction of a distal‐end EMD‐3878, single‐particle reconstruction of a baseplate EMD‐3879.
Supporting information Appendix Click here for additional data file. Expanded View Figures PDF Click here for additional data file. Table EV1 Click here for additional data file. Table EV2 Click here for additional data file. Table EV3 Click here for additional data file. Dataset EV4 Click here for additional data file. Dataset EV5 Click here for additional data file. Dataset EV6 Click here for additional data file. Dataset EV7 Click here for additional data file. Review Process File Click here for additional data file.
📊 Figures
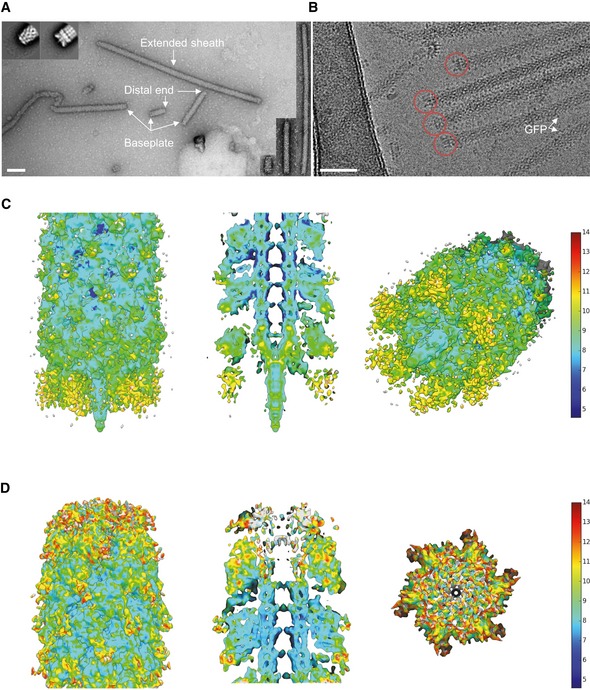
Figure 1
Raw images and cryou2010 EM structures of T6 SS baseplate and distalu2010end complexes
A raw negativeu2010stained image of VipAu2010N3 mutant sheath (scale bar: 100u00a0nm). Extended sheath, baseplate, and distal end are highlighted with white arrows. Right insets: examples of T6SS asse...
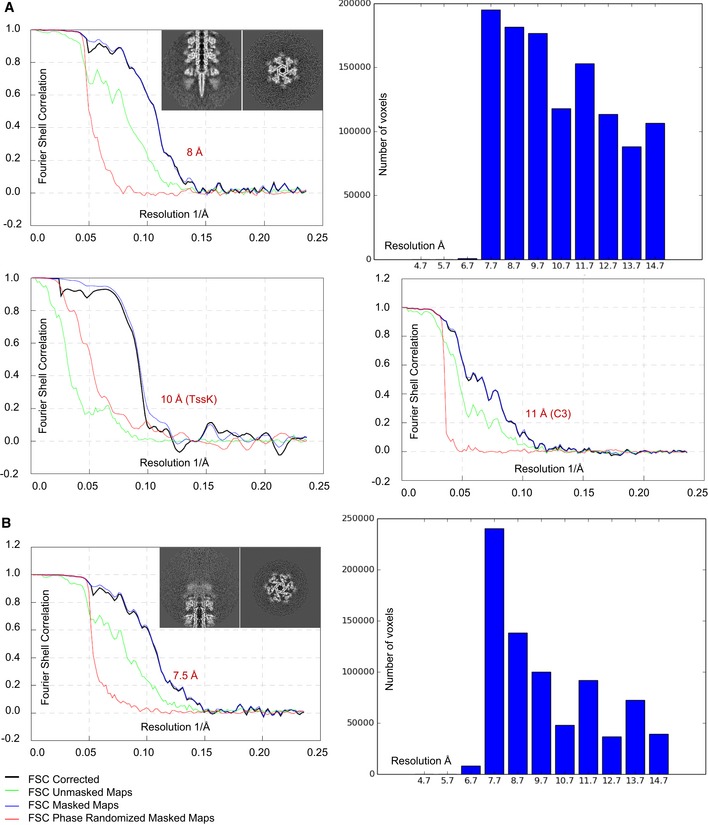
Figure EV1
Analysis of raw data, estimation of resolution
Representative slices through the raw sheathu2013baseplate reconstruction. Goldu2010standard FSC curves calculated for the sixfoldu2010averaged (top left) and threefoldu2010averaged (bottom right) bas...
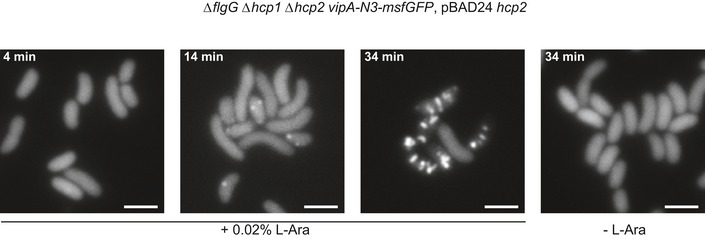
Figure EV2
Sheath formation in Hcpu2010limited cells
Fluorescence timelapse images of Vibrio cholerae vipAu2010N3u2010msfGFP in hcp1/2 mutant background, complemented with hcp expressed from Lu2010arabinoseu2010inducible vector pBAD24. Scale bars are 2u...
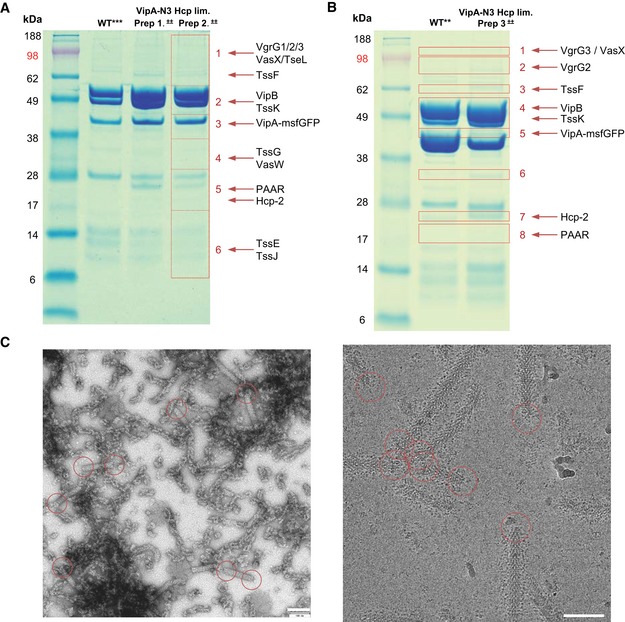
Figure EV3
Mass spectrometry and EM analysis of preparations from Hcpu2010limited cells
SDSu2013PAGE of purified sheaths: wildu2010type Hcpu2010limited prep, and (Hcpu2010limitedu00a0+u00a0VipAu2010N3) Prep1 and Prep2. Areas 1u20136 cut from gel and sent for mass spectrometry. Detected s...
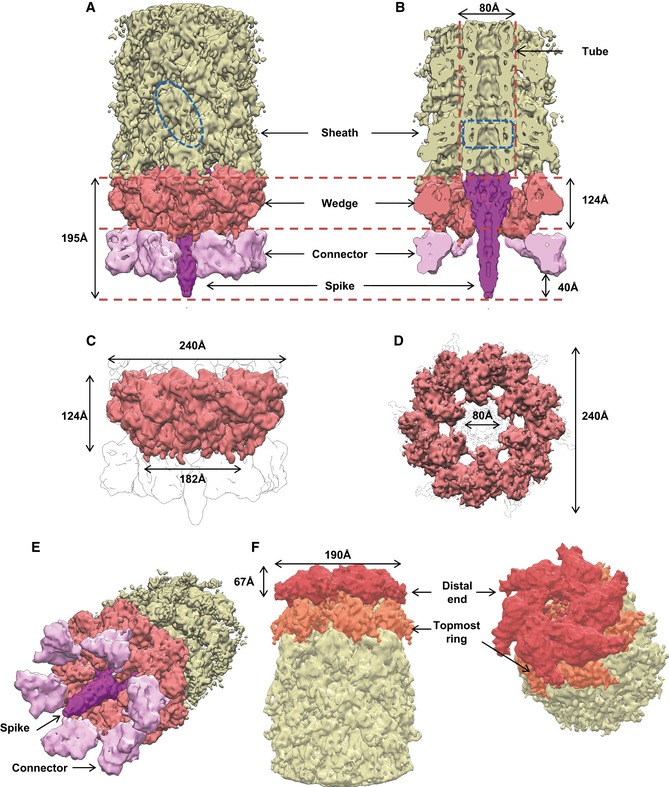
Figure 2
Overall dimensions, segmentation, and morphology of the baseplate and the distal end
A, B Side and cutaway views of the sheathu2013baseplate cryou2010EM reconstruction. The partially disordered connector density was replaced by the locally refined reconstruction calculated separately....
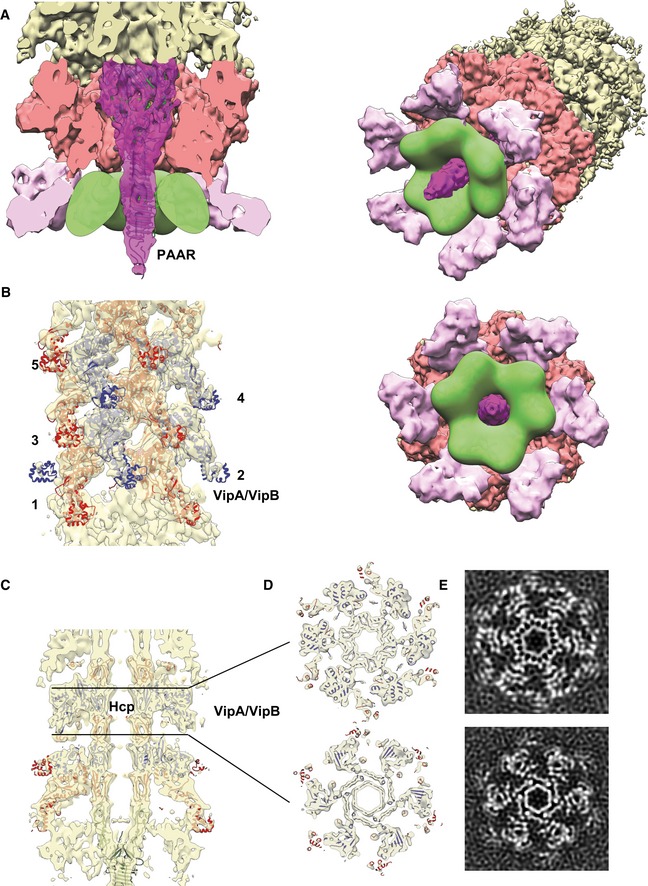
Figure 3
Central spike, tube, and sheath densities with a cavity for effector proteins
Cutaway view of the density corresponding to the baseplate and spike with fitted Xu2010ray crystallographic structures of VgrGu20101 trimer (PDB 4MTK) and PAAR monomer (PDB 4JIV). Putative cavity for ...
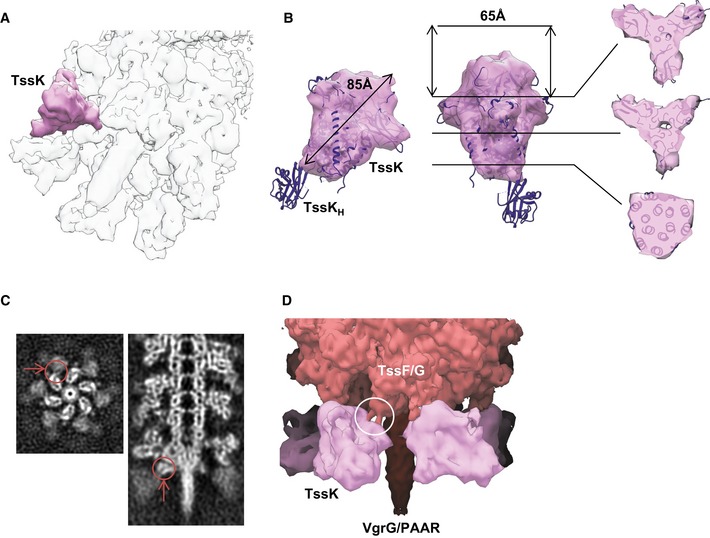
Figure 4
Trimeric connector protein and its interaction with the wedge
Tilted view of the composite baseplate cryou2010EM reconstruction. One connector protein is superimposed with the locally refined reconstruction shown in pink. Orthogonal side views and slices perpend...
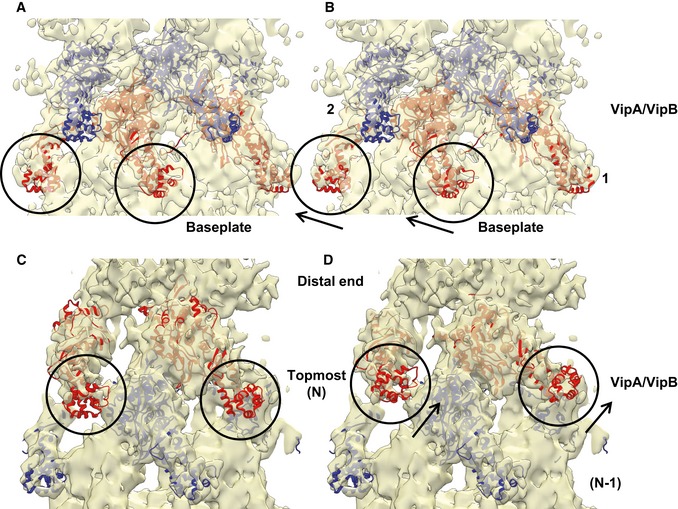
Figure 5
Rearrangements of the sheath rings next to the baseplate and the distal end
Side view of the density corresponding to the sheath next to the baseplate fitted with the atomic model of the VipAu2010N3 sheathu2013tube (PDB 5MXN). Same as (A), but with refitted sheath domain of t...
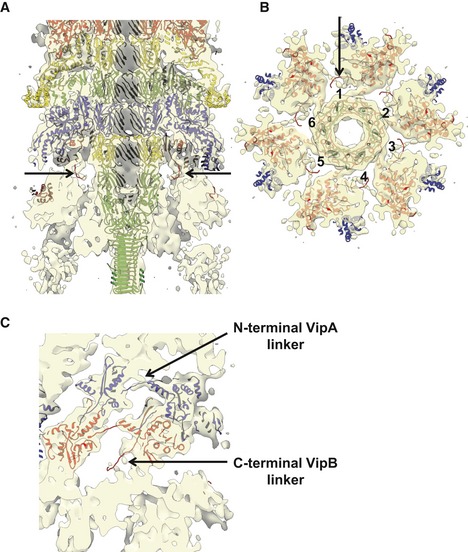
Figure EV4
Baseplateu2013sheath connection
Side cutaway view of the baseplate reconstruction with fitted atomic model of VipAu2010N3 sheathu2013tube (PDB 5MXN) and VgrGu20101 trimer (PDB 4MTK) and PAAR monomer (PDB 4JIV). Putative Cu2010termin...
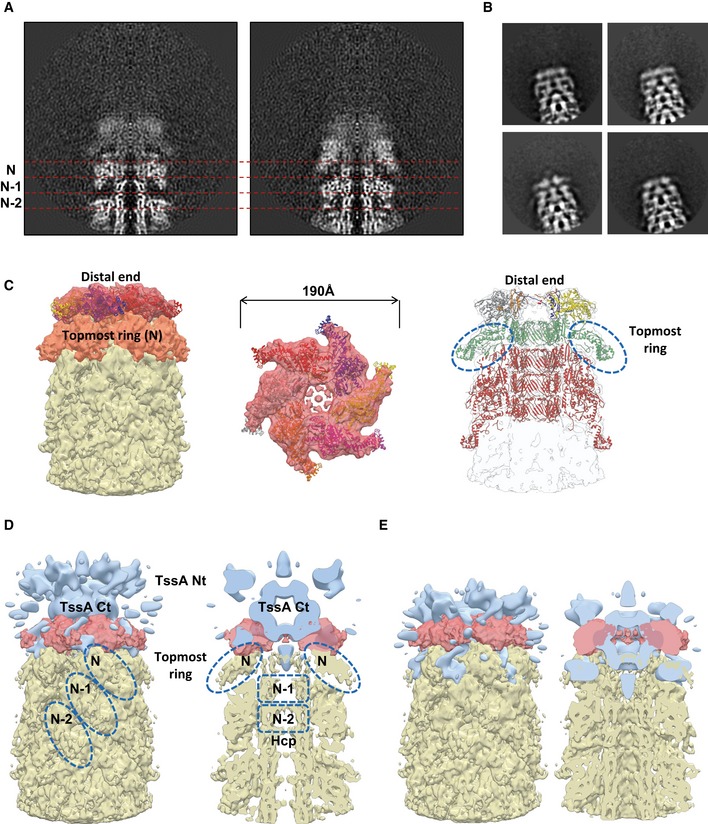
Figure EV5
Morphology of the sheath distal end
A Two orthogonal slices through the raw sheathu2013distalu2010end reconstruction shown. Ring numbers N, (Nu22121), and (Nu22122) correspond to the topmost ring and the two previous rings, and are sepa...
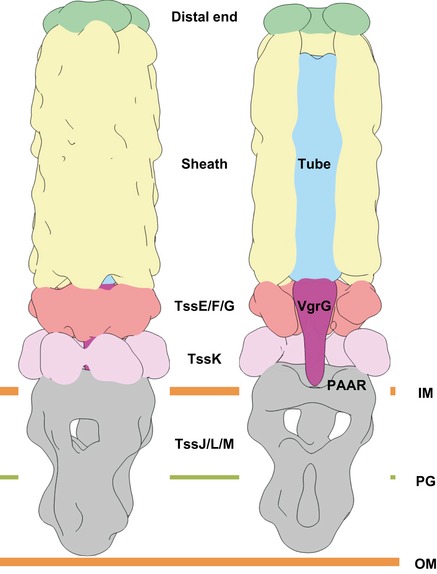
Figure EV6
Schematic representation of the assembled T6 SS
Side and cutaway views of the map, composed of the overlapping sixfoldu2010averaged sheath baseplate, sixfoldu2010averaged sheathu2013distal end, and fivefoldu2010averaged membrane complex (EMDu201029...
Figure images are served from the NIH/NLM PubMed Central Open Access Subset or Europe PMC; copyright remains with the publishers and authors.
💬 Discussion
0 commentsNo comments yet. Be the first to start a discussion!
Leave a Comment