Abstract
Complexes containing a pair of structural maintenance of chromosomes (SMC) family proteins are fundamental for the three-dimensional (3D) organization of genomes in all domains of life. The eukaryotic SMC complexes cohesin and condensin are thought to fold interphase and mitotic chromosomes, respectively, into large loop domains, although the underlying molecular mechanisms have remained unknown. We used cryo-EM to investigate the nucleotide-driven reaction cycle of condensin from the budding yeast Saccharomyces cerevisiae. Our structures of the five-subunit condensin holo complex at different functional stages suggest that ATP binding induces the transition of the SMC coiled coils from a folded-rod conformation into a more open architecture. ATP binding simultaneously triggers the exchange of the two HEAT-repeat subunits bound to the SMC ATPase head domains. We propose that these steps result in the interconversion of DNA-binding sites in the catalytic core of condensin, forming the basis of the DNA translocation and loop-extrusion activities.
🔬 Techniques
🧬 Organisms
💻 Software
🧪 Sample Preparation
🏭 Microscope Brands
🧪 Reagent Suppliers
📷 Detectors
💻 Software Details
💾 Data Repositories
🏛️ Research Organizations (ROR)
Affiliated research institutions:
📋 Methods
Cryo-EM grid preparation
For the collection of condensin apo state datasets, aliquots of purified condensin tetramer or pentamer samples (see Supplementary Note ) were thawed and injected onto a Superose 6 Increase 3.2/300 column (GE Healthcare) in nucleotide-free buffer (25 mM Tris-HCl, 125 mM NaCl, 1 mM TCEP, pH 7.5), prior to applying samples onto EM grids. Peak fractions were immediately used for cryo-EM grid preparations, using 3–3.5 μL of sample at a concentration of 0.15–0.25 mg/mL that was applied to freshly glow-discharged Cu/Rh 2/2 holey carbon 200 mesh grids (Quantifoil). The grids were blotted for 1.5–2 s at 4 °C and 100 % humidity, and were flash frozen using an FEI Vitrobot Mark IV (Thermo Fisher) and a liquid-ethane cryostat set to –180 °C 34 . For the collection of +ATP-state datasets, purified S. cerevisiae condensin pentamer complexes (see Supplementary Note ) were diluted into 25 mM HEPES-NaOH pH 7.5, 125 mM NaCl, 1 mM MgCl 2 and 1 mM DTT to a final concentration of 0.4 μM. After incubation with a mixture of 1 mM ATP and 1 mM AMP-PNP for 10 min, 3 μL were applied onto an UltrAufoil mesh 200 R1.2/1.3 grid (Quantifoil). Plunge freezing was carried out at 10 °C and 100 % humidity on an FEI Vitrobot Mark IV (Thermo Fisher) with a wait time of 2 min, blot force 3 and blot time 3. The blotting paper for the bottom side of the grid was replaced by a piece of Teflon to achieve one-sided blotting.
Cryo-EM data collection
Please refer to Tables 1 and 2 for data statistics. For the apo states, images were recorded on a Titan Krios electron microscope (FEI) equipped with a K2 or K3 summit direct electron detector (Gatan), mounted behind a GIF Quantum energy filter. Images were collected automatically using EPU (Thermo Fisher) or SerialEM 35 . A total of 13,628 micrographs of condensin tetramer grids were collected with the K2 camera in counting mode through 8 separate data collection sessions with total doses of 44–55 electrons per Å 2 during exposure times of 8–12 s, dose-fractionated into 40–55 movie frames, at defocus ranges of 1.6–3.6 μm. The magnifications used were 105,000× or 130,000×, resulting in physical pixel sizes of 1.16, 1.15, 1.047, 1.055, 1.065 Å per pixel. Three of the eight tetramer datasets with the K2 camera were collected at tilts of 40, 30 and 35°, respectively. ~10,500 micrographs of condensin tetramer grids were collected using the K3 camera in super-resolution mode (at a pixel size of 1.085 Å per pixel) with a total dose of 40 electrons per Å 2 during a total exposure time of 2.25 s, dose-fractionated into 40 movie frames, at a defocus range of 1.8–3.3 μm. A total of ~10,000 micrographs of condensin pentamer grids were collected with the K2 camera and a Volta phase plate (VPP) 36 in counting mode (at a pixel size of 1.065 Å per pixel) with a total dose of 45 electrons per Å 2 during a total exposure time of 9 s, dose-fractionated into 35–42 movie frames. A defocus range of 0.5–0.9 μm was used for VPP data collection. For the +ATP state, two datasets (4,158 micrographs and 4,894 micrographs, respectively) were acquired on a Titan Krios electron microscope (FEI) running at 300 kV, using a Gatan K2 detector in counting mode and a Gatan GIF energy filter with a slit width of 20 eV. A nominal defocus range of –1 to –2.5 μm was used with a total electron dose of 45 electrons per Å 2 divided over 40 frames (0.5 s/frame) and a pixel size of 1.7 Å/pixel (81,000× magnification). Since the data showed strong orientation bias, the stage was tilted by 30° during acquisition.
Show full methods section
Cryo-EM grid preparation
For the collection of condensin apo state datasets, aliquots of purified condensin tetramer or pentamer samples (see Supplementary Note ) were thawed and injected onto a Superose 6 Increase 3.2/300 column (GE Healthcare) in nucleotide-free buffer (25 mM Tris-HCl, 125 mM NaCl, 1 mM TCEP, pH 7.5), prior to applying samples onto EM grids. Peak fractions were immediately used for cryo-EM grid preparations, using 3–3.5 μL of sample at a concentration of 0.15–0.25 mg/mL that was applied to freshly glow-discharged Cu/Rh 2/2 holey carbon 200 mesh grids (Quantifoil). The grids were blotted for 1.5–2 s at 4 °C and 100 % humidity, and were flash frozen using an FEI Vitrobot Mark IV (Thermo Fisher) and a liquid-ethane cryostat set to –180 °C 34 . For the collection of +ATP-state datasets, purified S. cerevisiae condensin pentamer complexes (see Supplementary Note ) were diluted into 25 mM HEPES-NaOH pH 7.5, 125 mM NaCl, 1 mM MgCl 2 and 1 mM DTT to a final concentration of 0.4 μM. After incubation with a mixture of 1 mM ATP and 1 mM AMP-PNP for 10 min, 3 μL were applied onto an UltrAufoil mesh 200 R1.2/1.3 grid (Quantifoil). Plunge freezing was carried out at 10 °C and 100 % humidity on an FEI Vitrobot Mark IV (Thermo Fisher) with a wait time of 2 min, blot force 3 and blot time 3. The blotting paper for the bottom side of the grid was replaced by a piece of Teflon to achieve one-sided blotting.
Cryo-EM data collection
Please refer to Tables 1 and 2 for data statistics. For the apo states, images were recorded on a Titan Krios electron microscope (FEI) equipped with a K2 or K3 summit direct electron detector (Gatan), mounted behind a GIF Quantum energy filter. Images were collected automatically using EPU (Thermo Fisher) or SerialEM 35 . A total of 13,628 micrographs of condensin tetramer grids were collected with the K2 camera in counting mode through 8 separate data collection sessions with total doses of 44–55 electrons per Å 2 during exposure times of 8–12 s, dose-fractionated into 40–55 movie frames, at defocus ranges of 1.6–3.6 μm. The magnifications used were 105,000× or 130,000×, resulting in physical pixel sizes of 1.16, 1.15, 1.047, 1.055, 1.065 Å per pixel. Three of the eight tetramer datasets with the K2 camera were collected at tilts of 40, 30 and 35°, respectively. ~10,500 micrographs of condensin tetramer grids were collected using the K3 camera in super-resolution mode (at a pixel size of 1.085 Å per pixel) with a total dose of 40 electrons per Å 2 during a total exposure time of 2.25 s, dose-fractionated into 40 movie frames, at a defocus range of 1.8–3.3 μm. A total of ~10,000 micrographs of condensin pentamer grids were collected with the K2 camera and a Volta phase plate (VPP) 36 in counting mode (at a pixel size of 1.065 Å per pixel) with a total dose of 45 electrons per Å 2 during a total exposure time of 9 s, dose-fractionated into 35–42 movie frames. A defocus range of 0.5–0.9 μm was used for VPP data collection. For the +ATP state, two datasets (4,158 micrographs and 4,894 micrographs, respectively) were acquired on a Titan Krios electron microscope (FEI) running at 300 kV, using a Gatan K2 detector in counting mode and a Gatan GIF energy filter with a slit width of 20 eV. A nominal defocus range of –1 to –2.5 μm was used with a total electron dose of 45 electrons per Å 2 divided over 40 frames (0.5 s/frame) and a pixel size of 1.7 Å/pixel (81,000× magnification). Since the data showed strong orientation bias, the stage was tilted by 30° during acquisition.
Image processing and 3D reconstruction
For the apo state, image processing was done in RELION 3.0 37 . Movies were aligned using 5 × 5 patches in MotionCor2 with dose-weighting 38 . CTF parameters were estimated with Gctf 39 . For tilt datasets, local CTF estimation was performed using Gctf after initial processing. All refinements were performed using independent data half-sets (gold-standard refinement) and resolutions were determined based on the Fourier shell correlation (FSC = 0.143) criterion 40 . A tetramer dataset (750 images) was used for initial model calculation: Particles were picked manually from a few micrographs, and the resulting particles were binned and extracted with a 360 2 -pixel box size (2 Å/pixel) to generate 2D class averages. Good 2D class averages were used as a template for reference-based auto-picking. The resulting ~83 k particles were subjected to multiple rounds of 2D classifications, and a final ~19 k particles were used to calculate the initial 3D model in RELION ( Extended Data Fig. 1b ). For each dataset, particle picking was performed separately using the same strategy, starting with auto-picking using initial 2D classes; the resulting particles were then downscaled to 4 Å/pixel (180 2 -pixel box size) for initial processing. Due to condensin’s elongated shape, most particles were not properly centered after auto-picking and rare views tended to be lost during 2D classification. To resolve this issue, particles were first aligned against the 40 Å low-pass filtered initial model by 3D classification into one class, with a large offset search range (20 pixels) and a limited E-step resolution of 10 Å. The rationale was that particle translations become consistent for all viewing angles in 3D alignment, while translations are consistent only within each class average in 2D classification. Aligned particles were then subjected to 2D classification without alignment to remove contaminations and overlapping particles. After selecting good classes, duplicated particles within 100 Å were removed. For tilted datasets, local CTF estimation was performed with the refined particle coordinates using Gctf, followed by re-extraction of particles. The resulting particles from each dataset were then merged for further processing (~ 2.4 M particle images of tetramer and ~ 1.5 M of pentamer) ( Extended Data Fig. 1b ). The angular assignments resulting from these initial steps were also used for focused 3D classifications for the condensin arm and head, after re-centering particles. The set of pentamer particle images obtained was subjected to further 3D classification into seven classes with no image alignment, and resulted in five similar shaped classes (apo non-engaged form) and a unique class (apo bridged form). Among the five classes of the apo non-engaged form, the best class with clear density for Smc2, Smc4, Brn1 C and Ycs4 consisted of 100,388 particles. This class was selected and re-extracted in a 240 2 -pixel box (3 Å/pixel) and used for a final round of 3D refinement with a soft-edged mask and applying solvent-flattened FCSs. Post-processing with RELION yielded a final overall map of apo condensin at 8.1 Å resolution ( Extended Data Fig. 1c ). The class of the apo bridged form was re-extracted in a 240 2 -pixel box (3 Å/pixel) and the resulting 136,570 particles were subjected to another round of 3D classification into 3 classes. The best class consisting of 37,693 particles was selected and refined to 9.1 Å resolution ( Extended Data Fig. 1d ). For the processing of the apo non-engaged condensin arm segment, which contains the coiled coil and hinge domains, the particles of the tetramer sample from the initial processing were re-centered and re-extracted with a box size of 300 2 pixels (1.187 Å/pixel). An initial model for this part of condensin was produced by removing the density of the heads below the ‘joint’ from the overall apo map using UCSF Chimera 41 . After multiple rounds of 3D classifications and 2D classifications with no image alignments, 636,446 particle images were selected and 3D auto-refined. This resulted in a final map at 5.3 Å resolution ( Extended Data Fig. 2 ). For focused refinement of the apo bridged arm segment, the 136,570 particles were re-centered and re-extracted in a box of 400 2 pixels (1.187 Å/pixel). After further 3D and 2D classifications, the final 56,848 particles yielded a 7.8 Å resolution map ( Extended Data Fig. 2c,d ). For focused refinement of the apo condensin head segment, which contains the Smc2–Smc4 ATPase domains, Brn1 and Ycs4, the particle images from the initial processing were re-centered on the heads and re-extracted in a box size of 320 2 pixels (1.2 Å/pixel). Again, an initial model for this part was produced using UCSF Chimera 41 . The re-centered particle images of the tetramer heads (~2.4 M) were subjected to several rounds of 3D classification. The best class consisting of 403,128 particles was 3D refined to 4.6 Å resolution, followed by CTF refinement and Bayesian polishing in RELION 42 , resulting in a final resolution of 4.3 Å. The pentamer dataset (~1.5 M particle images) was processed with the same strategy and resulted in a ~5 Å resolution reconstruction with 172,888 particles. In the pentamer reconstruction, density for Ycg1 was not clearly visible, presumably because of its mobility with respect to the rest of the condensin complex. The final refined map of the pentamer sample was near-identical to the one obtained for the tetramer. Both datasets were hence merged at the level of refined particle images and the merged datasets yielded a combined and final 4.17 Å-resolution map of the apo non-engaged head segment ( Extended Data Fig. 3b ). For focused processing of the bridged head segment, the particles of the bridged class from the initial, overall processing were re-centered and re-extracted in a box size of 338 2 pixels (1.065 Å/pixel). After 3D/2D classifications, the resulting 24,593 particles were selected and 3D auto-refined, resulting in a final map at 7.5 Å resolution ( Extended Data Fig. 3d ). The processing strategy for the +ATP state is depicted in Extended Data Fig. 6 . Pre-processing of 9,052 micrograph stacks was done using the implementations of MotionCor2 in 5×5 patches with dose-weighting 38 and Gctf 39 in RELION 3.0 37 and, if not stated otherwise, all further analyses were also carried out in RELION. Particles were auto-picked and extracted in a box of 308 2 pixels (1.7 Å/pixel) and binned to a 150 2 -pixel box. After removing junk particles in reference-free 2D classifications, both datasets were combined and three initial maps were created de novo from 259,907 particles in cryoSPARC version 2 43 and then refined using heterogeneous refinement. The three refined maps were each subjected to a second round of ab initio and heterogenous refinement. Subsequently, similar classes were combined to yield the final three maps depicted in Extended Data Fig. 6a . The two classes with closed coiled coils were then combined, re-centered on the coiled-coil part, extracted in a box of 180 2 pixel (3.4 Å/pixel), cleaned up by 2D and 3D classifications without image alignment and then refined to yield an 8.2 Å-resolution map ( Extended Data Fig. 6b ). Open coiled coils were re-centered and classified in 2D. In addition, all head parts were re-centered and extracted in a box of 144 2 pixel (2.448 Å/pixel). In parallel, heads were auto-picked and combined with the re-centered head parts. After removal of duplicates within 70 Å, all head particles were cleaned up by 2D classification and refined to yield a 7.6 Å map ( Extended Data Fig. 6c ). A subsequent 3D classification resulted in a conformation with clear density for both coiled coils and a second form where density for the Smc2 coiled coil was largely absent ( Extended Data Fig. 8a ). Each class was refined to 8.4 Å and 7.9 Å, respectively ( Extended Data Fig. 8b,c ). Model building To generate a molecular model of the apo non-engaged Smc4 ATPase, the Brn1 carboxy-terminal domain and Ycs4, previous crystal structures of Smc4 hd –Brn1 C (PDB code 6QJ2) from C. thermophilum and Ycs4–Brn1 Ycs4 from C. thermophilum (PDB code 6QJ4) 20 were docked into the cryo-EM head segment map at 4.2 Å resolution using UCSF Chimera 41 . Manual modifications were performed in COOT 44 , including S. cerevisiae sequence assignment. Smc4 residues 151–365 and 1,234–1,414, Ycs4 residues 5–1,149 and Brn1 residues 643–748 were built manually based on the available density. Homology models of the Smc2 ATPase domain and the Brn1 amino-terminal domain were generated using as templates the crystal structure of Smc3hd–Scc1N from S. cerevisiae (PDB code 4UX3) 25 and the NMR structure of Brn1 N from C. thermophilum (PDB code 6Q6E) 20 . Modelling was performed using the SWISS-MODEL server 45 and models were rigid-body docked into the cryo-EM map using UCSF Chimera 41 . Smc2 residues 2–212 and 986–1,167 and Brn1 25–108 were fit according to the map. To generate a pseudo-atomic model of the arm, elbow and hinge regions of condensin, the crystal structure of the hinge domain from S. cerevisiae (PDB code 4RSI, Smc2 residues 453–739, Smc4 residues 560–947) 21 was fitted into the 5.3 Å map. Furthermore, the coiled coils were extended up to the elbow by building manually Smc2 residues 399–789 and Smc4 residues 544–969. The coiled-coil model of the region between the joint and the elbow (Smc2 residues 212–383, 792–936 and Smc4 residues 399–539, 773–1,114) was first built by placing poly-alanine chains into the density, and the sequences were tentatively assigned based on crosslink mass spec information and the map’s appearance. Finally, to obtain an overall atomic model of condensin, the above models of the arm and head regions were fitted into the overall low-resolution map at 8.1 Å resolution with UCSF Chimera 41 , and the missing residues linking the two parts were manually added using COOT 44 . For the molecular model of the apo bridged state, Smc2 hd –Brn1 N (Smc2 residues 2–233, 962–1,167), Smc4 hd -Brn1 C (Smc4 residues 151–402, 1,159–1,414) and Ycs4–Brn1 Ycs4 models were each taken from the apo non-engaged model and separately fitted by rigid-body fitting into the 7.5 Å bridged head map. Equally, the atomic model of the arm segment was taken from the non-engaged model and docked into the 7.8 Å arm segment map of the bridged state. Missing residues linking head and arm segments were added manually using COOT 44 . For the molecular model of the +ATP state, the existing crystal structure of the S. cerevisiae Ycg1–Brn1 Ycg1 complex (PDB code 5OQQ, chains A and C) was docked into the electron density using UCSF Chimera 41 . Ycg1 residues 499–507 of HEAT repeat 12 were manually added using COOT 44 . Brn1 residues not matching experimental electron density (residues 458–496) were deleted. For modelling the engaged Smc2–Smc4 head domains, the ‘helical’ and ‘RecA’ half-domains of C. thermophilum Smc2 (PDB code 6QJ1) and Smc4 hd –Brn1 C (PDB code 6QJ2) were placed individually. The Smc2 and Smc4 coiled-coil segments were adjusted in COOT 44 starting from manually placed segments taken from the apo model.
Crosslink mass spectrometry
The crosslinkers BS3 (bis(sulfosuccinimidyl)suberate) and sulfo-SDA (sulfosuccinimidyl 4,4’-azipentanoate) (Thermo Scientific Pierce) were dissolved in crosslinking buffer (20 mM HEPES, 150 mM NaCl, 1 mM TCEP, and 5 % glycerol, pH 7.7) to 100 mM before use. For crosslinking with BS3, the purified condensin tetramer in crosslinking buffer (20 mM HEPES, 150 mM NaCl, 1 mM TCEP, and 5 % glycerol, pH 7.7) were incubated at 0.7 mg/mL with 2 mM BS3 for 2 h on ice and the reactions were quenched with 50 mM NH 4 HCO 3 for 45 min at 4 °C. Reaction products were separated on a Criterion TGX 4–15 % SDS-PAGE gel (BioRad). The gel band corresponding to the crosslinked complex was excised and digested with trypsin (Thermo Scientific Pierce) 46 . The resulting tryptic peptides were extracted and desalted using C18 StageTips 47 . For photo-crosslinking the nucleotide-free apo condensin pentamer with sulfo-SDA, 0.85 mg/mL purified complexes were incubated with sulfo-SDA using three different protein-to-crosslinker molar ratios (1:250, 1:500, 1:1,000) for 2 h at 4 °C. For photo-crosslinking of condensin in the presence of ATP, ATP (3 mM) and MgCl 2 (5 mM) were added to the purified condensin pentamer at 0.85 mg/mL and crosslinking was performed using three protein-to-crosslinker molar ratios (1:300, 1:600, 1:1,200). The samples were irradiated with UV light at 365 nm for 20 min and quenched with 50 mM NH 4 HCO 3 . Subsequently, samples were denatured in 8 M urea, 100 mM NH 4 HCO 3 derivatized with iodoacetamide and digested with LysC endoproteinase (Wako) for 4 h at 25 °C. After dilution of the sample to a urea concentration of 1.5 M, trypsin (Thermo Scientific Pierce) was added and the samples were digested for 16 h at 25 °C. The resulting tryptic peptides were extracted and desalted using C18 StageTips 47 . Eluted peptides were fractionated using a Superdex Peptide 3.2/300 column (GE Healthcare) at a flow rate of 10 μL/min using 30 % (v/v) acetonitrile and 0.1 % (v/v) trifluoroacetic acid as mobile phase. 50 μl fractions were collected and dried. Samples for analysis were resuspended in 0.1 % (v/v) formic acid 1.6 % (v/v) acetonitrile. LC-MS/MS analysis was performed on an Orbitrap Fusion Lumos Tribrid mass spectrometer (Thermo Fisher) coupled on-line with an Ultimate 3000 RSLCnano system (Dionex, Thermo Fisher). Samples were separated on a 50-cm EASY-Spray column (Thermo Fisher). Mobile phase A consisted of 0.1 % (v/v) formic acid and mobile phase B of 80 % (v/v) acetonitrile with 0.1 % (v/v) formic acid. Flow rates were 0.3 μL/min using gradients optimized for each chromatographic fraction from offline fractionation, ranging from 2 % mobile phase B to 45 % mobile phase B over 90 min. Mass spec data were acquired in data-dependent mode using the top-speed setting with a three second cycle time. For every cycle, the full scan mass spectrum was recorded using the Orbitrap at a resolution of 120,000 in the range of 400 to 1,500 m/z. Ions with a precursor charge state between 3+ and 7+ were isolated and fragmented. Fragmentation by Higher-energy Collisional Dissociation (HCD) employed a decision tree logic with optimized collision energies 48 . The fragmentation spectra were then recorded in the Orbitrap with a resolution of 50,000. Dynamic exclusion was enabled with single repeat count and 60-seconds exclusion duration. A recalibration of the precursor m/z was conducted based on high-confidence (
📊 Figures
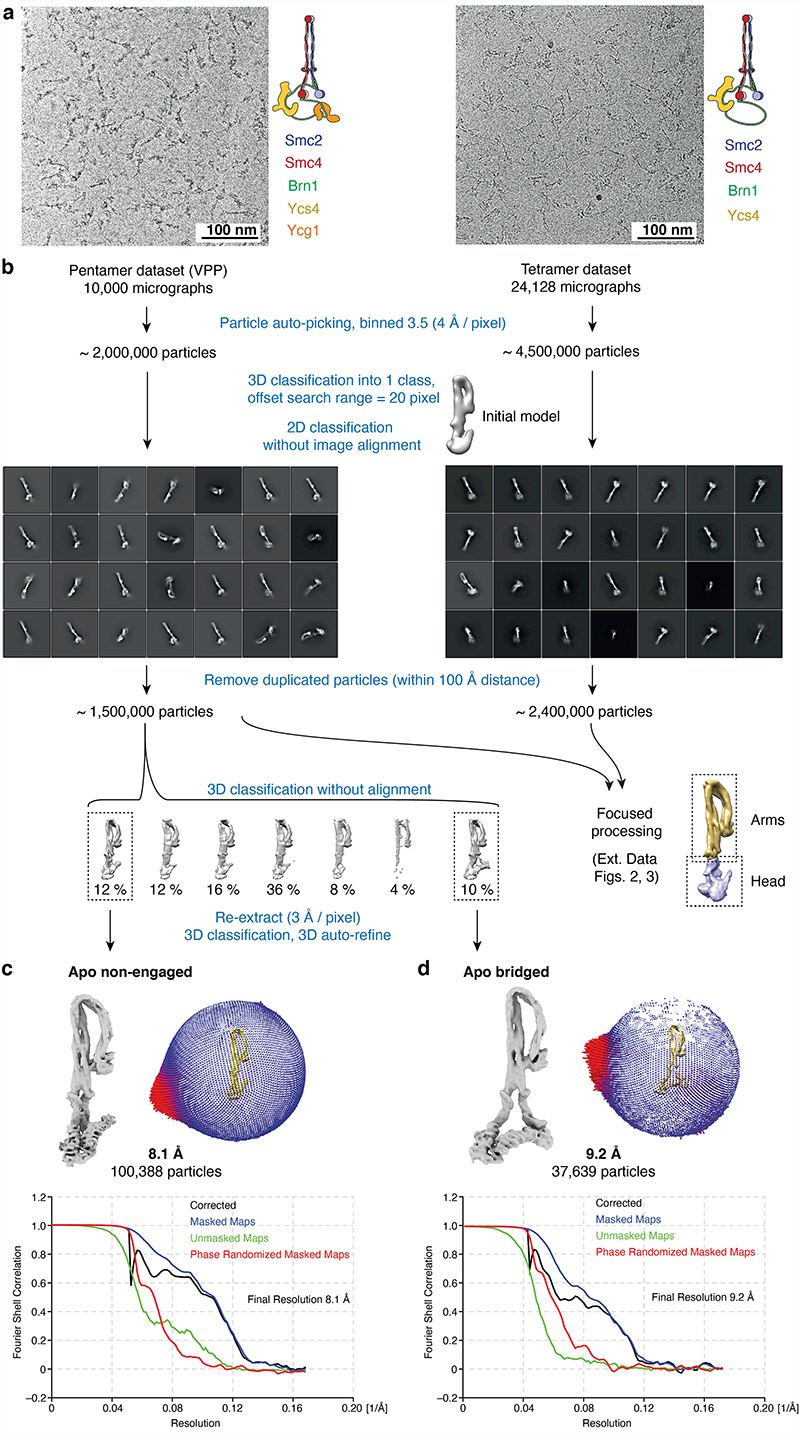
Extended Data Fig. 1
Cryo-EM structure determination of the nucleotide-free apo condensin complex.
a , Representative micrographs of nucleotide-free (apo) condensin tetramer (Smc2u2013Smc4u2013Brn1u2013Ycs4, left) and pentamer (Smc2u2013Smc4u2013Brn1u2013Ycs4u2013Ycg1, right). b , Workflow of initi...
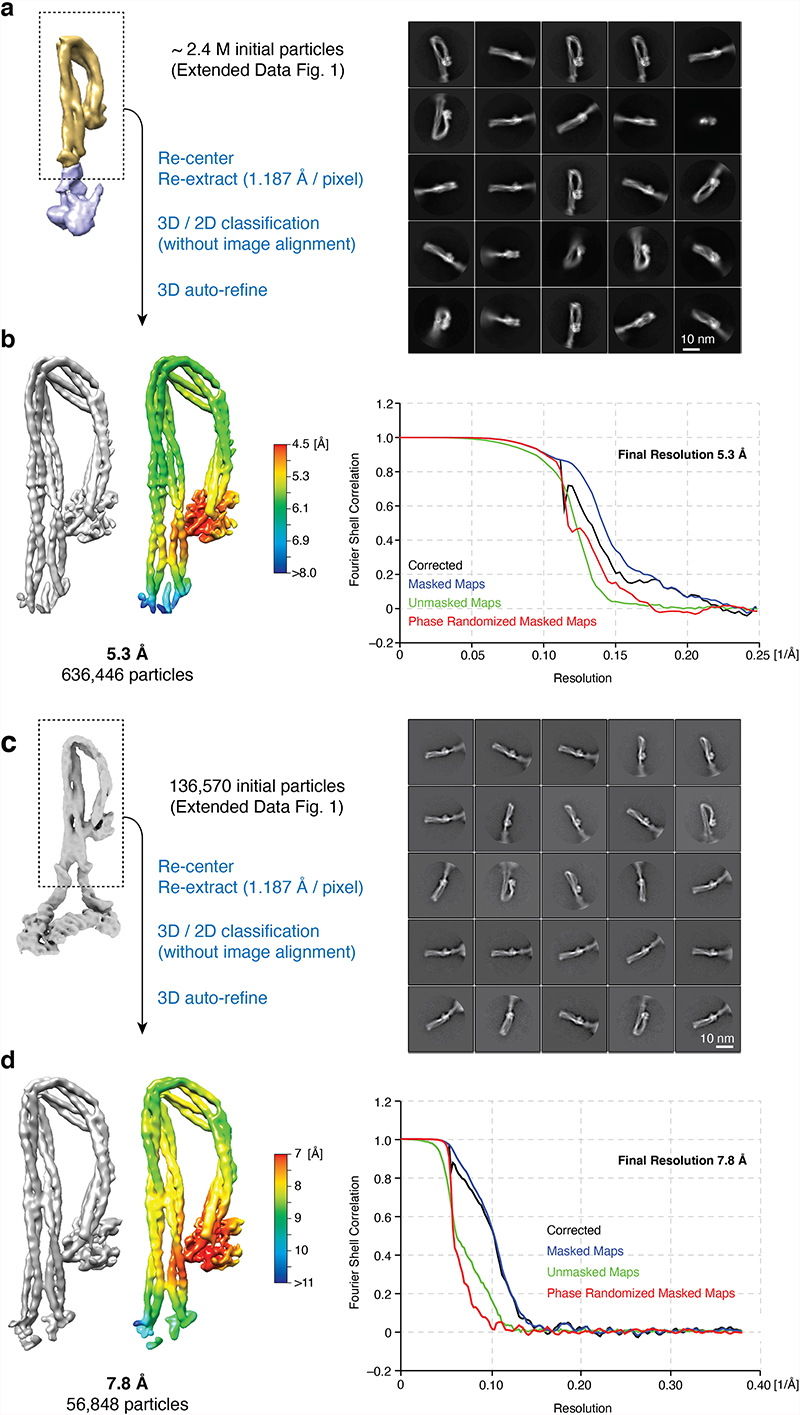
Extended Data Fig. 2
Focused image processing of the arm segments of nucleotide-free apo condensin.
a , Workflow for the apo non-engaged condensin arm segment. Particles of the tetramer complex were initially processed and preliminary angles and translations were assigned as described in Extended Da...
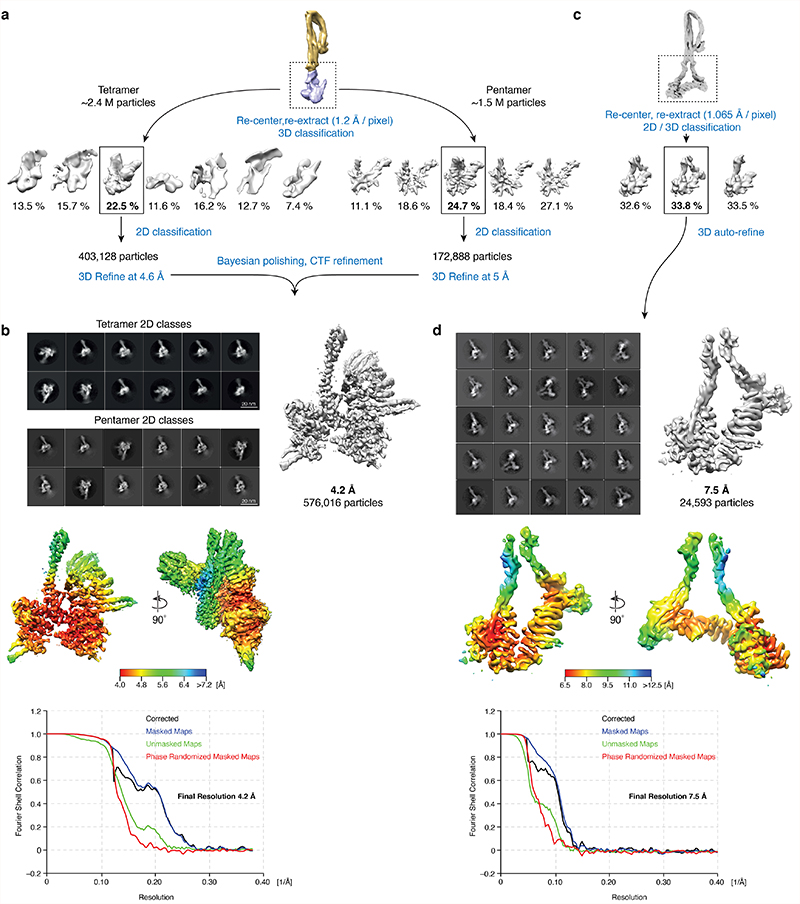
Extended Data Fig. 3
Focused image processing of the head segments of nucleotide-free apo condensin.
a , Workflow for the apo non-engaged condensin head segment. Particles of tetramer and pentamer complexes were initially processed and preliminary angles and translations were assigned as described in...
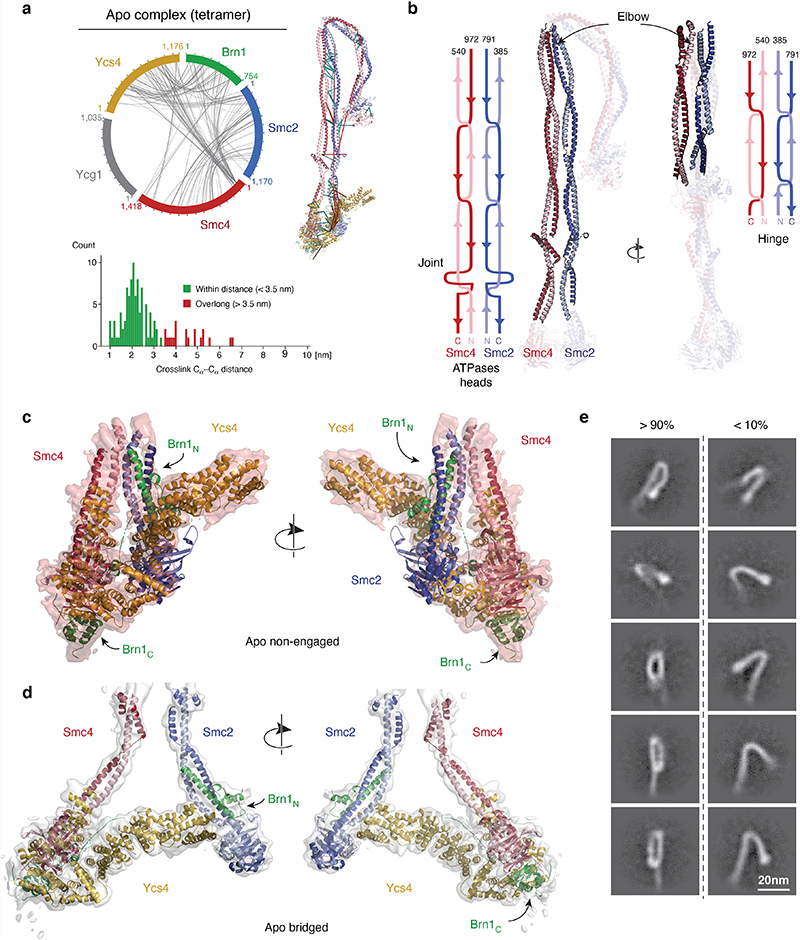
Extended Data Fig. 4
Crosslink mass spec and pseudo-atomic model of the apo complex.
a , Circle plots of inter-molecular BS3 crosslinks identified in condensin tetramer complexes in the absence of nucleotide with an FDR of < 1%. Bar plots show the distance distribution of crosslinks (...
Extended Data Fig. 5
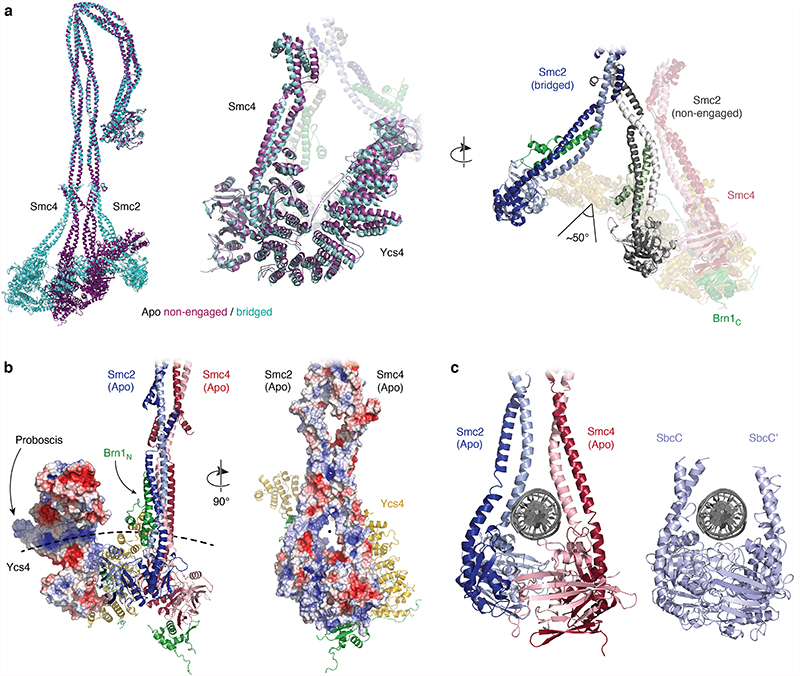
Conformation al changes and putative DNA binding sites in the apo condensin complex.
a , Structural alignment of pseudo-atomic models of overall apo complexes in the non-engaged and bridged states. b , Electrostatic potential maps of Ycs4 (left) and the Smc2u2013Smc4 heads and coiled ...
Extended Data Fig. 6
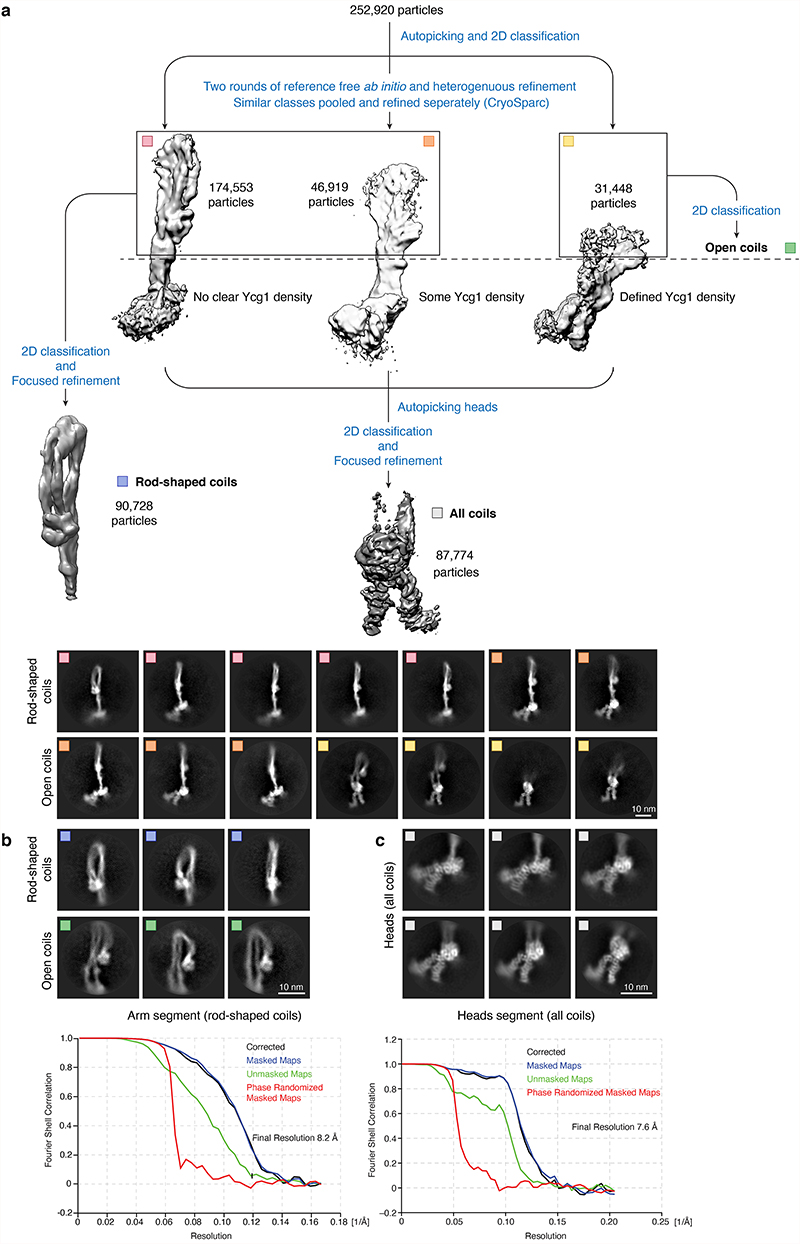
Structure determination of the +ATP condensin complex.
a , Workflow of the initial data processing of pentameric condensin in the presence of ATP by reference-free ab initio model estimation, combined with focused refinement and representative 2D class av...
Extended Data Fig. 7
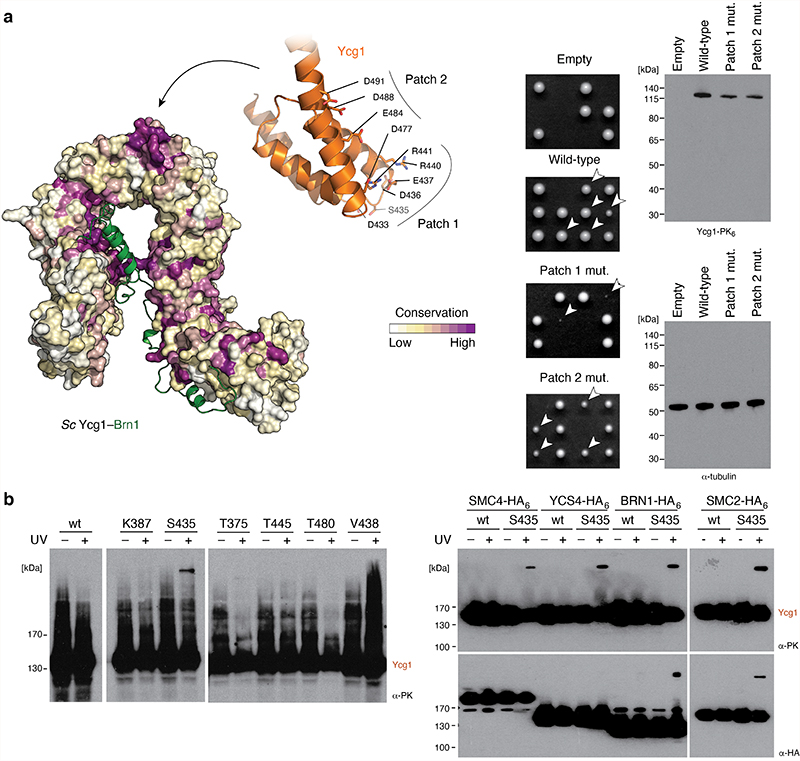
Ycg1 binds Smc2 and Brn1 via a conserved patch in vivo .
a , Surface conservation plot of S. cerevisiae Ycg1u2013Brn1 (left). Tetrad dissection of diploid S. cerevisiae YCG1/ycg1u0394 cells expressing an ectopic PK 6 -tagged copy of Ycg1 harboring patch 1 o...
Extended Data Fig. 8
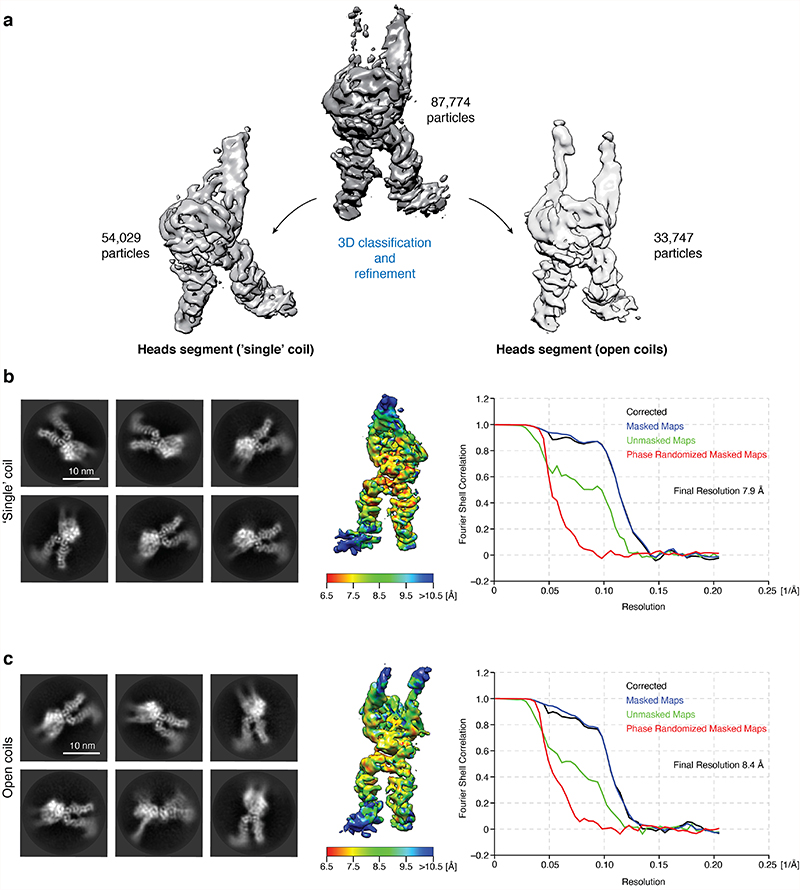
Sub-classification of the +ATP condensin head domain segment.
a , 3D classification of all head particles results in two distinct maps, one with clear density for both coiled coils (open coils, right) and a second one with weak Smc2 coiled coil density (u2018sin...
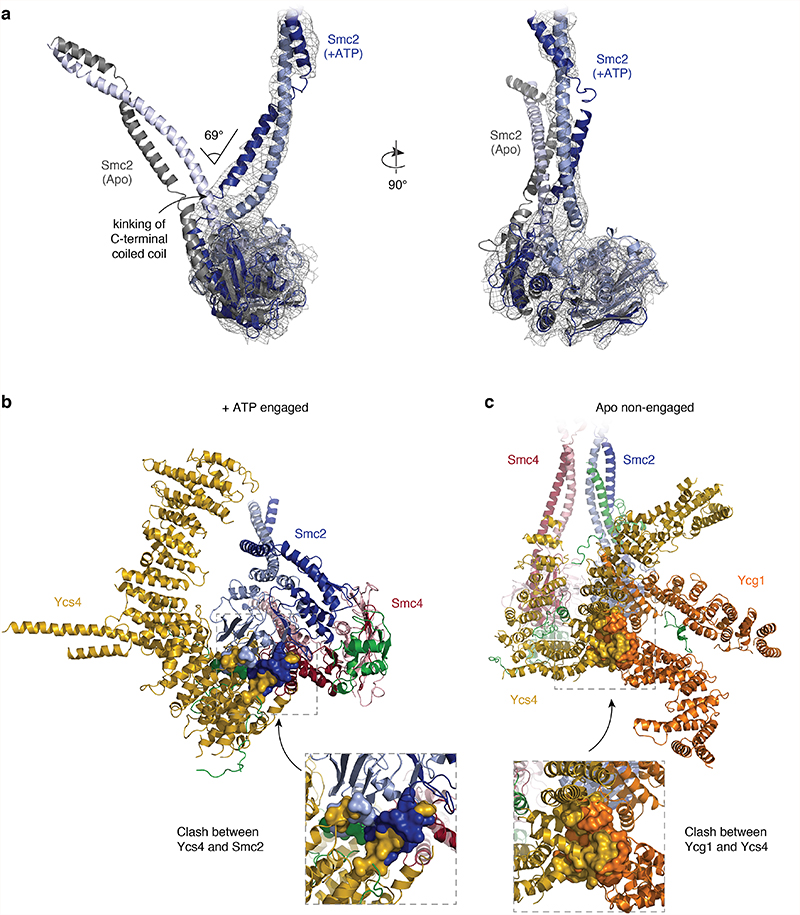
Extended Data Fig. 9
Conformational changes in the head segment between the apo and +ATP states.
a , Structural alignment based on the RecA-like lobe of the Smc2 head domains of the +ATP (u2018openu2019) form (in blue colors) and the apo (nucleotide-free) form (grey colors) highlights the extent ...
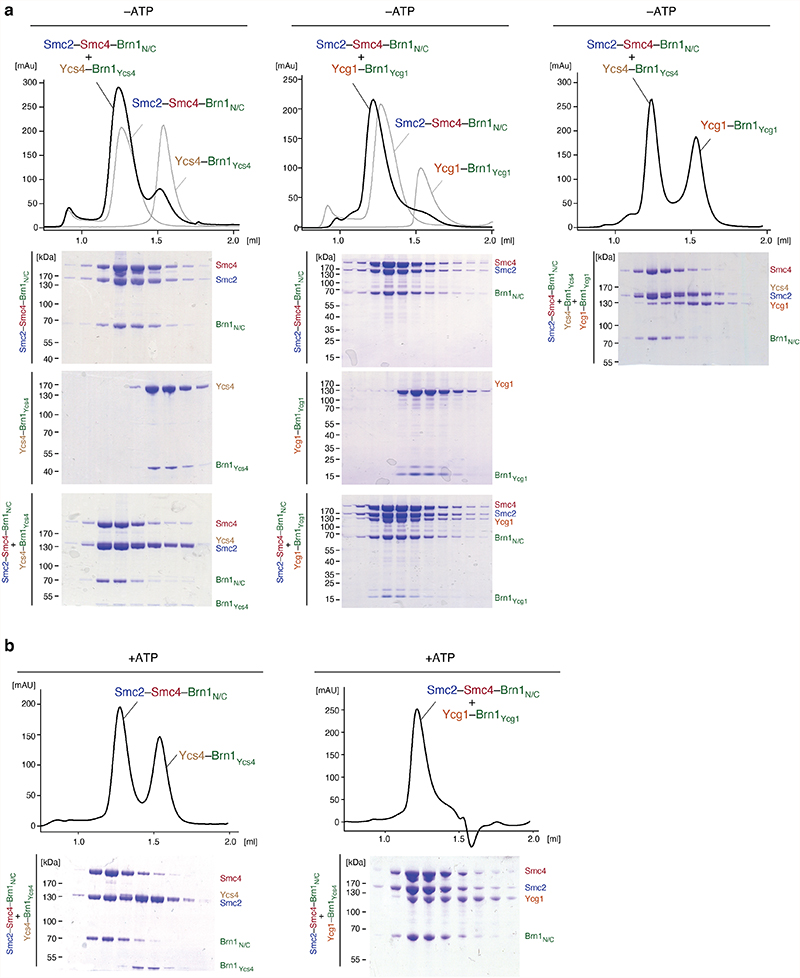
Extended Data Fig. 10
Association of Ycs4 with Smc2u2013Smc4 prevents Ycg1 binding.
a , Size exclusion chromatography of complexes formed between a trimeric Smc2u2013Smc4u2013Brn1 NC and either Ycs4u2013Brn1 Ycs4 (left), Ycg1u2013Brn1 Ycg1 (center) or both (right). Peak fractions wer...
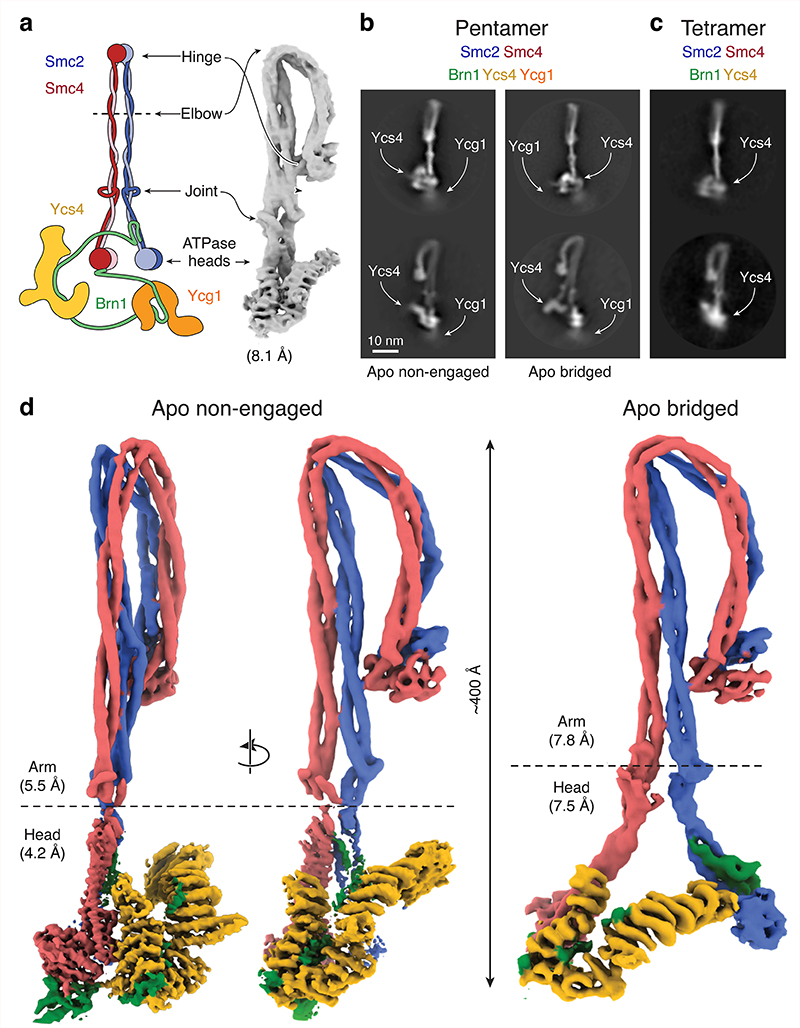
Fig. 1
Cryo-EM structures of the yeast condensin holo complex in the nucleotide-free apo form.
a , Schematic model of the S. cerevisiae condensin holo complex and 8.1 u00c5-resolution 3D map, showing its overall architecture. b , Representative 2D class average of the 5-subunit u2018pentameru20...
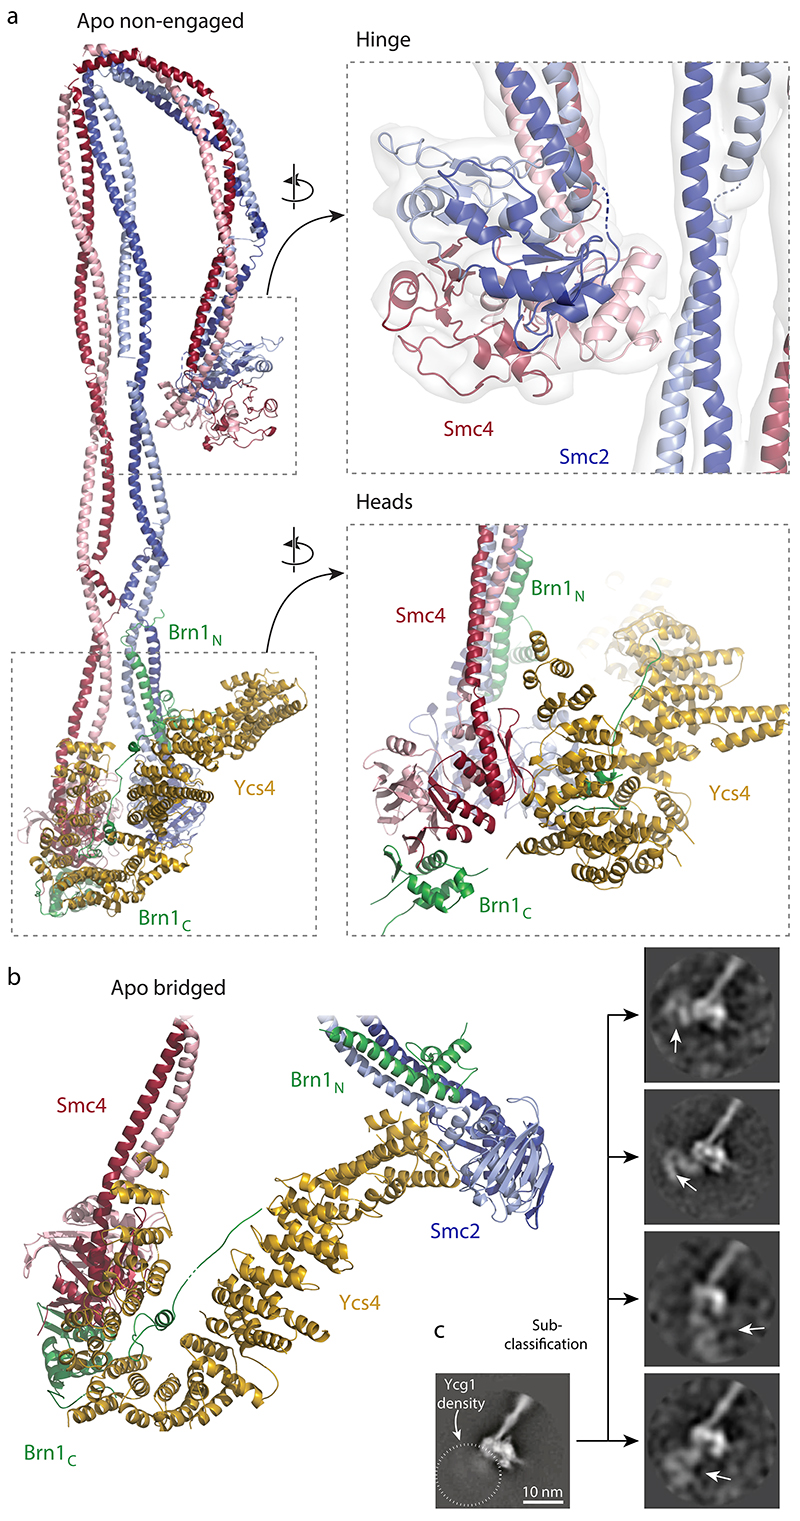
Fig. 2
Atomic models of the apo condensin holo complex.
a , Complete pseudo-atomic model of the non-engaged state. b , Pseudo-atomic model of the head segment of the bridged state c , Sub-classification of 2D class averages pinpoints positions of the Ycg1 ...
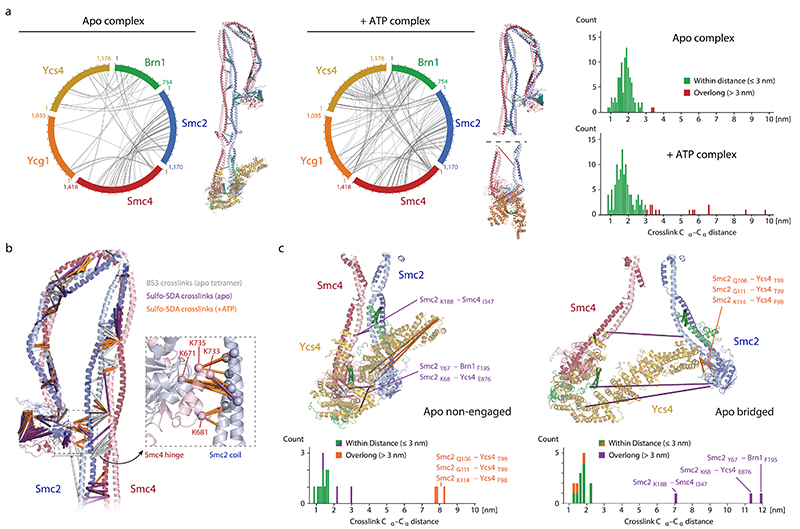
Fig. 3
Crosslink mass spectrometry.
a , Circle plots of inter-molecular sulfo-SDA crosslinks identified in condensin pentamer complexes in the absence (apo) or presence (+ATP) of nucleotide with an FDR of < 1%. Bar plots show the distan...
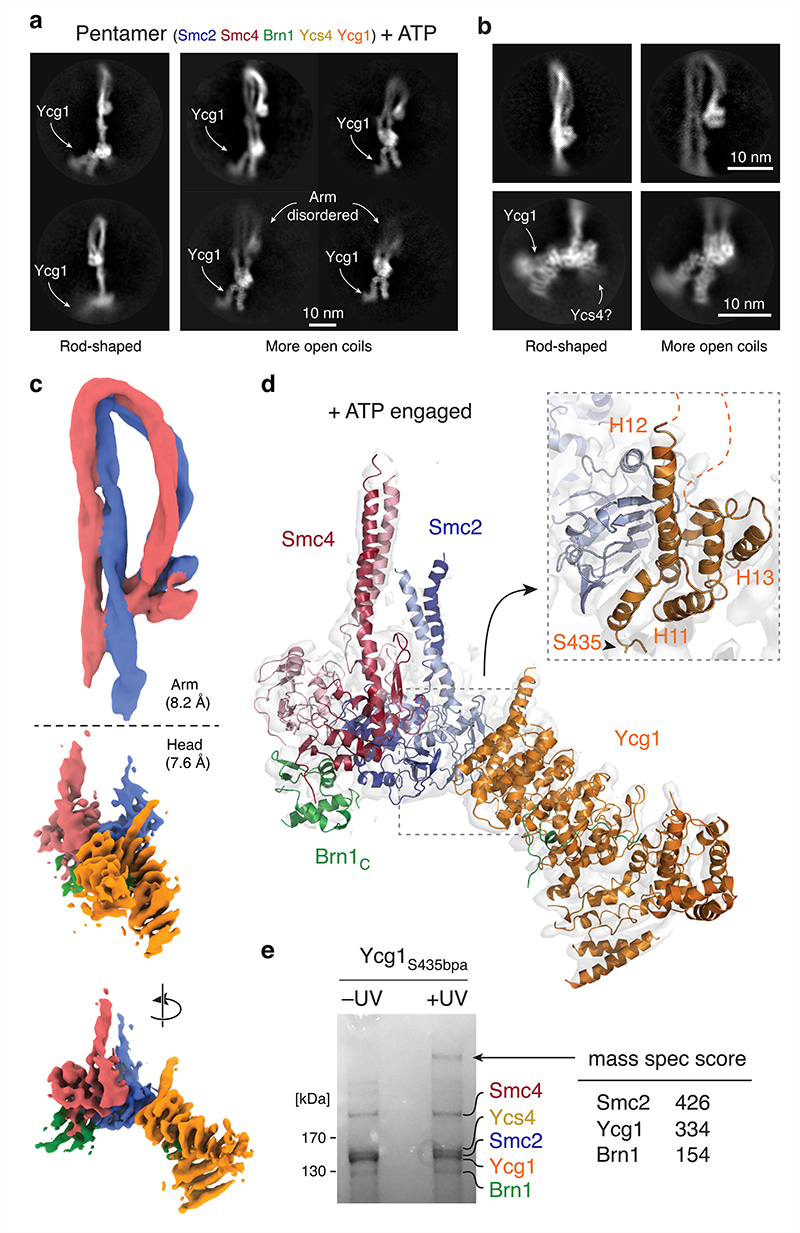
Fig. 4
Cryo-EM structure of the condensin holo complex in the presence of ATP.
Representative 2D class averages of a , pentamer complexes with rod-shaped (left) or more opened coiled coils (right) and of b , coiled-coil arm (left) or ATPase head (right) segments from a set of cl...
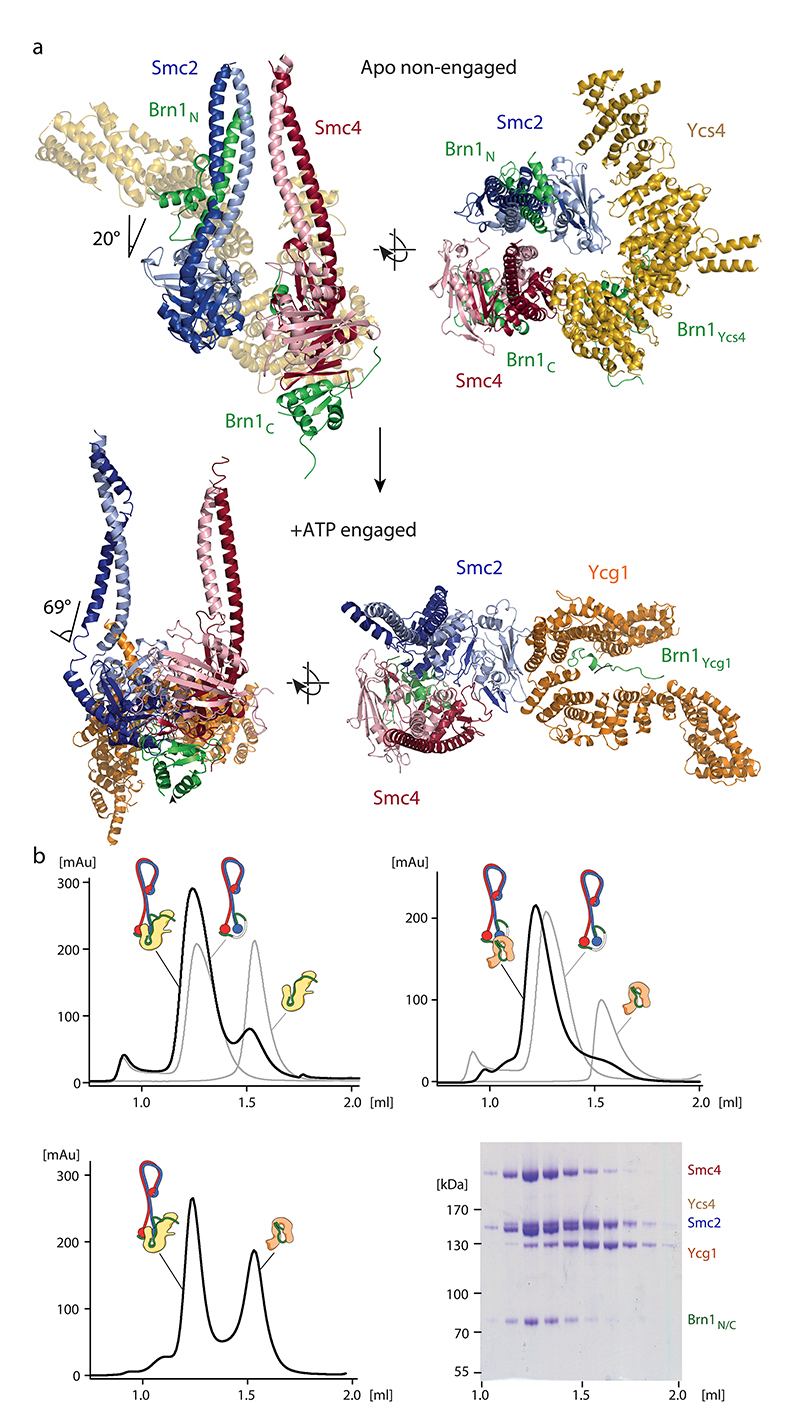
Fig. 5
ATP-dependent exchange of the HEAT-repeat subunits at the condensin heads.
a , Comparison of the ATPase head structures in the non-engaged apo state and the +ATP engaged state. Angles indicate the kink in the carboxy-terminal Smc2 coiled-coil helix. b , Analytical size exclu...
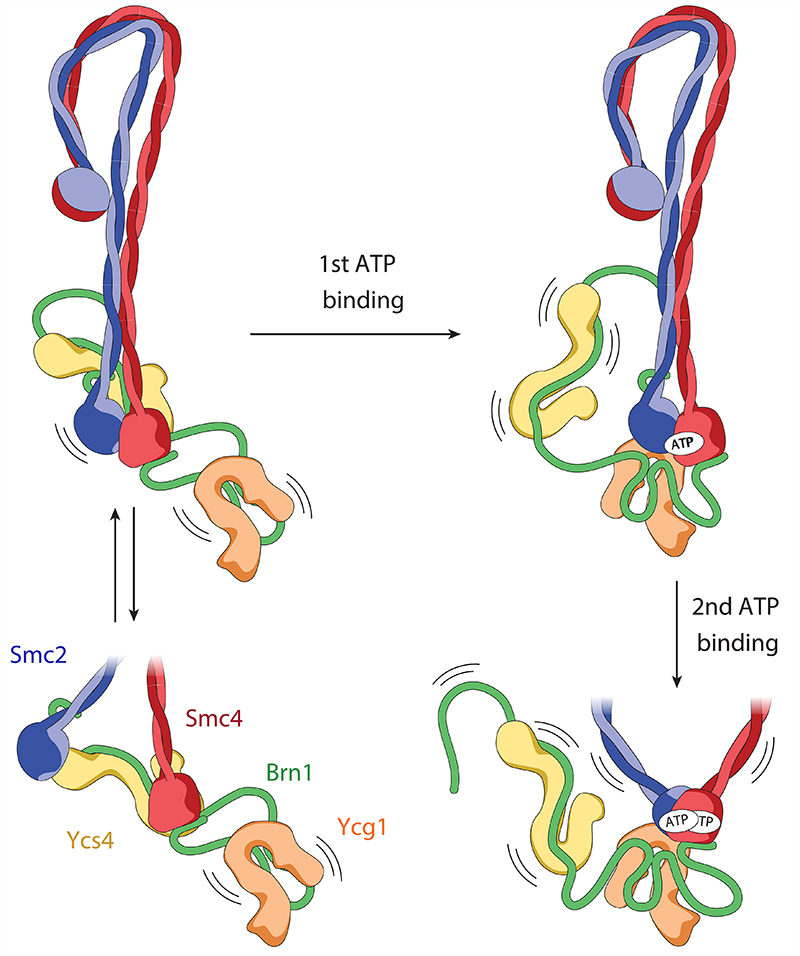
Fig. 6
Flip-flop model of the condensin reaction cycle.
In the absence of ATP, the Smc2 and Smc4 ATPase domains are either separated by ~2 nm, with Ycs4 bound to the Smc4 head (non-engaged state) or separated by ~10 nm with Ycs4 bound to both, the Smc2 and...
Figure images are served from the NIH/NLM PubMed Central Open Access Subset or Europe PMC; copyright remains with the publishers and authors.
💬 Discussion
0 commentsNo comments yet. Be the first to start a discussion!
Leave a Comment