Abstract
ZnT8 is a Zn 2+ /H + antiporter that belongs to SLC30 family and plays an essential role in regulating Zn 2+ accumulation in the insulin secretory granules of pancreatic β cells. However, the Zn 2+ /H + exchange mechanism of ZnT8 remains unclear due to the lack of high-resolution structures. Here, we report the cryo-EM structures of human ZnT8 (HsZnT8) in both outward- and inward-facing conformations. HsZnT8 forms a dimeric structure with four Zn 2+ binding sites within each subunit: a highly conserved primary site in transmembrane domain (TMD) housing the Zn 2+ substrate; an interfacial site between TMD and C-terminal domain (CTD) that modulates the Zn 2+ transport activity of HsZnT8; and two adjacent sites buried in the cytosolic domain and chelated by conserved residues from CTD and the His-Cys-His (HCH) motif from the N-terminal segment of the neighboring subunit. A comparison of the outward- and inward-facing structures reveals that the TMD of each HsZnT8 subunit undergoes a large structural rearrangement, allowing for alternating access to the primary Zn 2+ site during the transport cycle. Collectively, our studies provide the structural insights into the Zn 2+ /H + exchange mechanism of HsZnT8.
🔬 Techniques
🧬 Organisms
✨ Fluorophores
🧪 Sample Preparation
🔬 Cell Lines
🏭 Microscope Brands
🧪 Reagent Suppliers
💻 Software Details
💾 Data Repositories
🏷️ Research Resource Identifiers (RRIDs)
Verified research resources used in this paper:
🏛️ Research Organizations (ROR)
Affiliated research institutions:
📋 Methods
Key resources table
Reagent type (species) or resource Designation Source or reference Identifiers Additional information Strain, strain background ( Escherichia coli ) TOP10 Thermo Fisher Scientific Cat# 18258012 Strain, strain background ( Escherichia coli ) DH10bac Thermo Fisher Scientific Cat# 10361012 Cell line ( Spodoptera frugiperda ) Sf9 cells Thermo Fisher Scientific Cat# 11496015; RRID: CVCL_0549 Cell line ( Homo sapiens ) FreeStyle 293 F cells Thermo Fisher Scientific Cat# R79007 ; RRID: CVCL_D603 Recombinant DNA reagent pEZT-BM DOI: 10.1016/j.str.2016.03.004 Addgene:74099 Transfected construct ( Homo-sapiens ) pEZT-BM-ZNT8-N Flag and mutations This paper N/A transfected construct (human) Antibody Mouse monoclonal anti-FLAG tag Sigma Cat# F1804 WB (1:5000) Antibody Mouse monoclonal anti-b-actin Santa Cruz Biotechnology Cat# sc-69879; RRID: AB_1119529 WB (1:200) Antibody Mouse IgG HRP linked whole Ab GE healthcare Cat# NA931V; RRID: AB_772210 WB (1:10000) Chemical compound, drug Sodium Butyrate Sigma-Aldrich Cat# 303410 Chemical compound, drug n-Dodecyl-b-Maltopyranoside Anatrace Cat# D310, D310s Chemical compound, drug Cholesteryl hemisuccinate Sigma-Aldrich Cat# C6512 Chemical compound, drug Lauryl Maltose Neopentyl Glycol Anatrace Cat# NG310 Chemical compound, drug Digitonin Sigma Cat# D141 Chemical compound, drug 1,10-Phenanthroline Sigma Cat# 131377 Chemical compound, drug FluoZin−3 Thermo Fisher Scientific Cat# F24194 Peptide, recombinant protein 3X FLAG Peptide Sigma Cat# F4799 Software, algorithm MotionCor2 Zheng et al., 2017 https://emcore.ucsf.edu/ucsf-software Software, algorithm GCTF Zhang, 2016 https://www2.mrc-lmb.cam.ac.uk/research/locally-developed-software/zhang-software/#gctf Software, algorithm RELION Scheres, 2012 http://www2.mrc-lmb.cam.ac.uk/relion Software, algorithm Chimera Pettersen et al., 2004 https://www.cgl.ucsf.edu/chimera ; RRID: SCR_004097 Software, algorithm PyMol Schrödinger https://pymol.org/2 ; RRID: SCR_000305 Software, algorithm COOT Emsley et al., 2010 https://www2.mrc-lmb.cam.ac.uk/ personal/pemsley/coot ; RRID: SCR_014222 Software, algorithm PHENIX Adams et al., 2010 https://www.phenix-online.org Software, algorithm GraphPad Prism GraphPad Software https://www.graphpad.com/scientific-software/prism Software, algorithm OriginPro 8 OriginLab Corp. https://www.originlab.com Other Superose 6 Increase10/300 GL GE Healthcare Cat# 29091596 Other Anti-DYKDDDDK G1 Affinity Resin GeneScript Cat# 10362101 Other Amicon Ultra-15 Centrifugal Filter Units Milliporesigma Cat# UFC9100 Other Quantifoil R 1.2/1.3 grid Au300 quantifoil Cat# Q37572 Other Cellfectin Invitrogen Cat# 10362100 Protein expression and purification Human ZnT8 cDNA (residues 50–369) was cloned into pEZT vector with an N-terminal Flag tag and heterologously expressed in HEK293F cells ( R79007 , Thermo Fisher Scientific) using the BacMam system. The baculovirus generated in Sf9 cells (11496015, Thermo Fisher Scientific) was used to infect HEK293F cells at a ratio of 40:1 (cells:virus, v/v) and 10 mM sodium butyrate were added to the cell culture to boost protein expression. 48 hr after infection at 37°C, cells were collected by centrifugation at 4000 g. All purification procedures were carried out at 4°C unless specified otherwise. The cell pellet was re-suspended in Buffer A (25 mM Hepes pH 7.4, 150 mM NaCl) supplemented with protease inhibitors (1 mg/ml each of DNase, pepstatin, leupeptin, and aprotinin and 1 mM PMSF) and homogenized by sonication on ice. HsZnT8 protein was extracted with 1.5% (w/v) n-dodecyl-β-d-maltopyranoside (DDM; Anatrace) and 0.02% (w/v) cholesteryl hemisuccinate (CHS; Sigma-Aldrich) by gentle agitation for 2 hr. After extraction, the supernatant was collected after centrifugation at 40,000 g and incubated with anti-Flag M2 affinity resin by gentle agitation for 1 hr. Then the resin was collected on a disposable gravity column and washed with 20 column volume of Buffer A supplemented with 0.05% (w/v) lauryl maltose neopentyl glycol (MNG, Anatrace). HsZnT8 was eluted in Buffer A with 0.05% (w/v) MNG and 0.1 mg/ml Flag peptide. The protein eluate was concentrated and further purified by size-exclusion chromatography on a Superose6 10/300 GL column (GE Healthcare) in Buffer A with 0.06% (w/v) Digitonin. The peak fractions were collected and concentrated to 4 mg/ml for grid preparation. The HsZnT8 D110N/D224N double mutant construct were generated using QuikChange (Agilent). The same procedure was used to express and purify HsZnT8-DM for cryo-EM analysis.
Show full methods section
Key resources table
Reagent type (species) or resource Designation Source or reference Identifiers Additional information Strain, strain background ( Escherichia coli ) TOP10 Thermo Fisher Scientific Cat# 18258012 Strain, strain background ( Escherichia coli ) DH10bac Thermo Fisher Scientific Cat# 10361012 Cell line ( Spodoptera frugiperda ) Sf9 cells Thermo Fisher Scientific Cat# 11496015; RRID: CVCL_0549 Cell line ( Homo sapiens ) FreeStyle 293 F cells Thermo Fisher Scientific Cat# R79007 ; RRID: CVCL_D603 Recombinant DNA reagent pEZT-BM DOI: 10.1016/j.str.2016.03.004 Addgene:74099 Transfected construct ( Homo-sapiens ) pEZT-BM-ZNT8-N Flag and mutations This paper N/A transfected construct (human) Antibody Mouse monoclonal anti-FLAG tag Sigma Cat# F1804 WB (1:5000) Antibody Mouse monoclonal anti-b-actin Santa Cruz Biotechnology Cat# sc-69879; RRID: AB_1119529 WB (1:200) Antibody Mouse IgG HRP linked whole Ab GE healthcare Cat# NA931V; RRID: AB_772210 WB (1:10000) Chemical compound, drug Sodium Butyrate Sigma-Aldrich Cat# 303410 Chemical compound, drug n-Dodecyl-b-Maltopyranoside Anatrace Cat# D310, D310s Chemical compound, drug Cholesteryl hemisuccinate Sigma-Aldrich Cat# C6512 Chemical compound, drug Lauryl Maltose Neopentyl Glycol Anatrace Cat# NG310 Chemical compound, drug Digitonin Sigma Cat# D141 Chemical compound, drug 1,10-Phenanthroline Sigma Cat# 131377 Chemical compound, drug FluoZin−3 Thermo Fisher Scientific Cat# F24194 Peptide, recombinant protein 3X FLAG Peptide Sigma Cat# F4799 Software, algorithm MotionCor2 Zheng et al., 2017 https://emcore.ucsf.edu/ucsf-software Software, algorithm GCTF Zhang, 2016 https://www2.mrc-lmb.cam.ac.uk/research/locally-developed-software/zhang-software/#gctf Software, algorithm RELION Scheres, 2012 http://www2.mrc-lmb.cam.ac.uk/relion Software, algorithm Chimera Pettersen et al., 2004 https://www.cgl.ucsf.edu/chimera ; RRID: SCR_004097 Software, algorithm PyMol Schrödinger https://pymol.org/2 ; RRID: SCR_000305 Software, algorithm COOT Emsley et al., 2010 https://www2.mrc-lmb.cam.ac.uk/ personal/pemsley/coot ; RRID: SCR_014222 Software, algorithm PHENIX Adams et al., 2010 https://www.phenix-online.org Software, algorithm GraphPad Prism GraphPad Software https://www.graphpad.com/scientific-software/prism Software, algorithm OriginPro 8 OriginLab Corp. https://www.originlab.com Other Superose 6 Increase10/300 GL GE Healthcare Cat# 29091596 Other Anti-DYKDDDDK G1 Affinity Resin GeneScript Cat# 10362101 Other Amicon Ultra-15 Centrifugal Filter Units Milliporesigma Cat# UFC9100 Other Quantifoil R 1.2/1.3 grid Au300 quantifoil Cat# Q37572 Other Cellfectin Invitrogen Cat# 10362100 Protein expression and purification Human ZnT8 cDNA (residues 50–369) was cloned into pEZT vector with an N-terminal Flag tag and heterologously expressed in HEK293F cells ( R79007 , Thermo Fisher Scientific) using the BacMam system. The baculovirus generated in Sf9 cells (11496015, Thermo Fisher Scientific) was used to infect HEK293F cells at a ratio of 40:1 (cells:virus, v/v) and 10 mM sodium butyrate were added to the cell culture to boost protein expression. 48 hr after infection at 37°C, cells were collected by centrifugation at 4000 g. All purification procedures were carried out at 4°C unless specified otherwise. The cell pellet was re-suspended in Buffer A (25 mM Hepes pH 7.4, 150 mM NaCl) supplemented with protease inhibitors (1 mg/ml each of DNase, pepstatin, leupeptin, and aprotinin and 1 mM PMSF) and homogenized by sonication on ice. HsZnT8 protein was extracted with 1.5% (w/v) n-dodecyl-β-d-maltopyranoside (DDM; Anatrace) and 0.02% (w/v) cholesteryl hemisuccinate (CHS; Sigma-Aldrich) by gentle agitation for 2 hr. After extraction, the supernatant was collected after centrifugation at 40,000 g and incubated with anti-Flag M2 affinity resin by gentle agitation for 1 hr. Then the resin was collected on a disposable gravity column and washed with 20 column volume of Buffer A supplemented with 0.05% (w/v) lauryl maltose neopentyl glycol (MNG, Anatrace). HsZnT8 was eluted in Buffer A with 0.05% (w/v) MNG and 0.1 mg/ml Flag peptide. The protein eluate was concentrated and further purified by size-exclusion chromatography on a Superose6 10/300 GL column (GE Healthcare) in Buffer A with 0.06% (w/v) Digitonin. The peak fractions were collected and concentrated to 4 mg/ml for grid preparation. The HsZnT8 D110N/D224N double mutant construct were generated using QuikChange (Agilent). The same procedure was used to express and purify HsZnT8-DM for cryo-EM analysis.
Cryo-EM data collection Purified
HsZnT8-DM and HsZnT8-WT either in the presence or absence of Zn 2+ (1 mM) at 4 mg/ml was applied to a glow-discharged Quantifoil R1.2/1.3 300-mesh gold holey carbon grid (Quantifoil, Micro Tools GmbH, Germany), blotted under 100% humidity at 4°C and plunged into liquid ethane using a Mark IV Vitrobot (FEI). Micrographs were acquired on a Titan Krios microscope (FEI) with a K3 Summit direct electron detector (Gatan) in the super-resolution counting mode, operated at 300 kV using the SerialEM software ( Mastronarde, 2005 ). The slit width of the GIF-Quantum energy filter was set to 20 eV. A Volta phase plate was used to enhance low-resolution features ( Danev and Baumeister, 2016 ). Micrographs were dose-fractioned into 32 frames at the dose rate of ~2 e − /Å 2 /frame.
Image processing and 3D reconstruction
Movie frames of HsZnT8-DM micrographs were motion-corrected and binned two-fold, resulting in the pixel size of 0.83 Å, and dose-weighted using the Motioncorr2 program ( Figure 1—figure supplement 3 ; Zheng et al., 2017 ). CTF correction were performed using the GCTF programs ( Zhang, 2016 ). The rest of the image processing steps was carried out using RELION 3 ( Zivanov et al., 2018 ). A few micrographs from the HsZnT8-DM dataset were used for manual picking of ~1000 particles. These particles were subjected to 2D classification. Class averages representing projections of the HsZnT8 dimer in different orientations were used as templates for automated particle picking from the full datasets. A total of 1,287,890 particles were picked from 3384 micrographs. Particles were extracted and binned by four times (leading to 3.32 Å/pixel) and subjected to 2D classification. Particles in good 2D classes were chosen (569,565 in total) for 3D classification using an initial model generated from a subset of the particles in RELION. Particles from the 3D classes showing good secondary structural features were selected and re-extracted into the original pixel size of 0.83 Å. 3D refinements with C2 symmetry imposed resulted in 3D reconstructions to 4 Å resolution. To improve the resolution, we performed another round of 3D classification by using local search in combination with small angular sampling, resulting a new class showing improved density for the entire protein. The final reconstruction was resolved at overall 3.8 Å resolution. A total of 1,537,280 particles were picked from 3776 micrographs of HsZnT8-WT in the absence of Zn 2+ ( Figure 2—figure supplement 1 ). 831,115 particles were selected by 2D classification. A map of the ZnT8 in the outward-facing conformation was low-pass filtered and used as the initial reference. The subsequent 3D classification revealed one good class with each ZnT8 subunit adopting a distinct conformation. Therefore, the following 3D refinement was performed with C1 symmetry imposed, leading to a final reconstruction at 5.9 Å resolution. The same image processing procedure was used to obtain the 3D reconstruction of HsZnT8 in the presence of Zn 2+ , yielding a map at 4.1 Å resolution ( Figure 3—figure supplement 1 ). Local resolution was calculated in RELION. Resolution was estimated by applying a soft mask around the protein density with the Fourier Shell Correlation (FSC) 0.143 criterion. To calculate the difference map, the cryo-EM map of HsZnT8-DM in the absence of Zn 2+ at 3.8 Å resolution was firstly normalized to the same grey scale as the cryo-EM map of HsZnT8-WT in the presence of Zn 2+ , by using the command ‘vop scale’ in UCSF Chimera ( Pettersen et al., 2004 ). After aligning the two maps together in UCSF Chimera, the difference map was calculated by using the command ‘vop subtract’. Model building, refinement and validation Density maps of the HsZnT8-DM in the outward-facing conformation was of sufficient quality for de novo model building in Coot ( Figure 1—figure supplement 4 ; Emsley et al., 2010 ), facilitated by previous crystal structure of EcYiiP (PDB:3H90) ( Lu et al., 2009 ). The model was manually adjusted in Coot and refined against the map by using the real space refinement module with secondary structure and non-crystallographic symmetry restraints in the Phenix package ( Adams et al., 2010 ). The same procedure was used to build the model of HsZnT8-WT in the presence of Zn 2+ . The density of the HsZnT8-WT in the absence of Zn 2+ in the inward-facing conformation is relatively poor. The models of CTD and each TM from the outward-facing structure were rigid-body fitted into the cryo-EM density in Coot with good agreement. The model was subsequently refined against the map by using strong secondary structure restraints in Phenix. Model geometries were assessed by using Molprobity as a part of the Phenix validation tools and summarized in Supplementary file 1 ( Chen et al., 2010 ). The solvent accessible cavities were calculated with the program Caver ( Chovancova et al., 2012 ). The multiple sequence alignments were performed using the program Clustal Omega ( Sievers et al., 2011 ).
Vesicular zinc uptake assay
In a previous study, it has been shown that HsZnT8 expressed in HEK293 cells facilitated vesicular Zn 2+ uptake when Zn 2+ was introduced into cytosol by permeabilizing surface membrane using a Zn 2+ ionophore ( Merriman et al., 2016 ). In that study, the vesicular Zn 2+ accumulation was monitored by Zinpyr-1, a membrane-permeable Zn 2+ -selective fluorescent indicator that can be localized in vesicles. We adopted similar cell-based vesicular Zn 2+ uptake assay in our study, except that we permeabilized the cells with digitonin and directly monitored the cytosolic Zn 2+ concentration decrease caused by vesicular Zn 2+ uptake using Zn 2+ indicator FluoZin-3 as described below. HEK293F cells expressing HsZnT8 were harvested 36 hr after virus infection. To remove residual media and Zn 2+ , the cell pellet from 30 mL suspension culture was washed with 30 mL of uptake buffer (20 mM Hepes pH7.4 125 mM KCl, 5 mM NaCl, 10 mM Glucose, 10 μM Phenanthroline) three times, and then re-suspended in uptake buffer to a final concentration of 15 × 10 6 cells/mL. The cells were maintained on ice throughout. To measure Zn 2+ uptake, 100 μL of cell suspension was added into each well of a 96-well plate (Corning) and the following reagents were added sequentially: 1 μM FluoZin-3, 0.01% digitonin, and 9 μM ZnCl 2 . Zinc uptake was monitored by measuring FluoZin-3 fluorescence change for 5 min using a Molecular Devices SpectraMax M3 plate reader (excitation/emission: 490 nm/525 nm). Western blot analysis was performed on each sample used for uptake assay to ensure protein expression was comparable among the HsZnT8 WT and mutants.
Mouse anti-Flag antibodies
(Sigma) were used to detect HsZnT8. Mouse anti-β-actin (Santa Cruz Biotechnology) was used as a loading control. HRP-conjugated sheep anti-mouse antibody (GE Healthcare) was used as the secondary antibody. The expression level of HsZnT8 was calculated based on the quantification of the total level of ZnT8 and β-actin from the western blot analysis. All functional data were analyzed in GraphPad Prism 8 (GraphPad Software, Inc) or OriginPro (OriginLab Corp.). To obtain the rate of zinc uptake, the linear phase of the uptake measurement – the first 30 s of the reaction following zinc addition – was determined by fitting the data to a linear regression equation in OriginPro 8; the slope of the fit is taken as the rate of zinc uptake. The zinc uptake rates were normalized to the expression level of HsZnT8. Further analysis are indicated in the figure legend. The identities of all the cell lines have been authenticated. The mycoplasma contamination testing was performed and shown to be negative.
Quantification and statistical analysis
The number of independent experiment, the method used in statistical test, and the statistical significance are indicated in each figure legend and source manuscript files.
Additional files Supplementary file 1. CryoEM data collection and model statistics. Transparent reporting form
📊 Figures
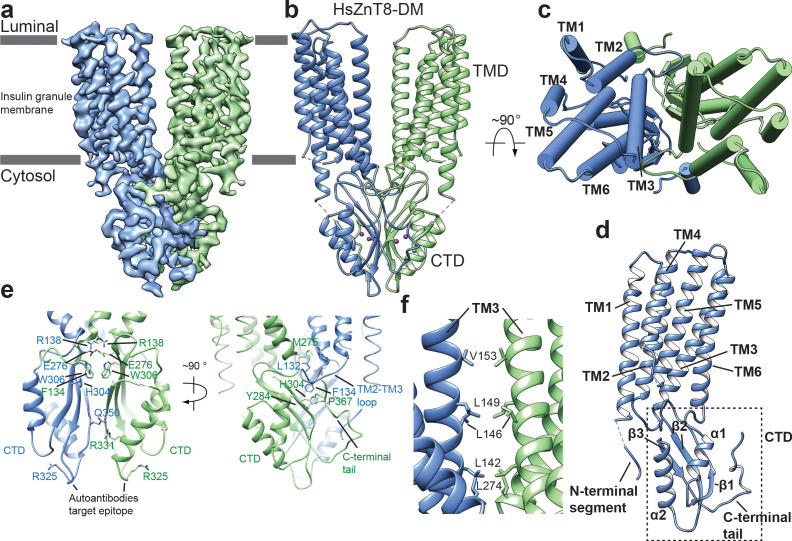
Figure 1.
Overall structure of HsZnT8-DM in the outward-facing conformation.
( a ) Cryo-EM reconstruction of HsZnT8-DM in the outward-facing conformation (contour level: 0.018,u00a04.8u00a0u03c3). The two subunits are colored in blue and green, respectively. ( b ) The ribbon r...
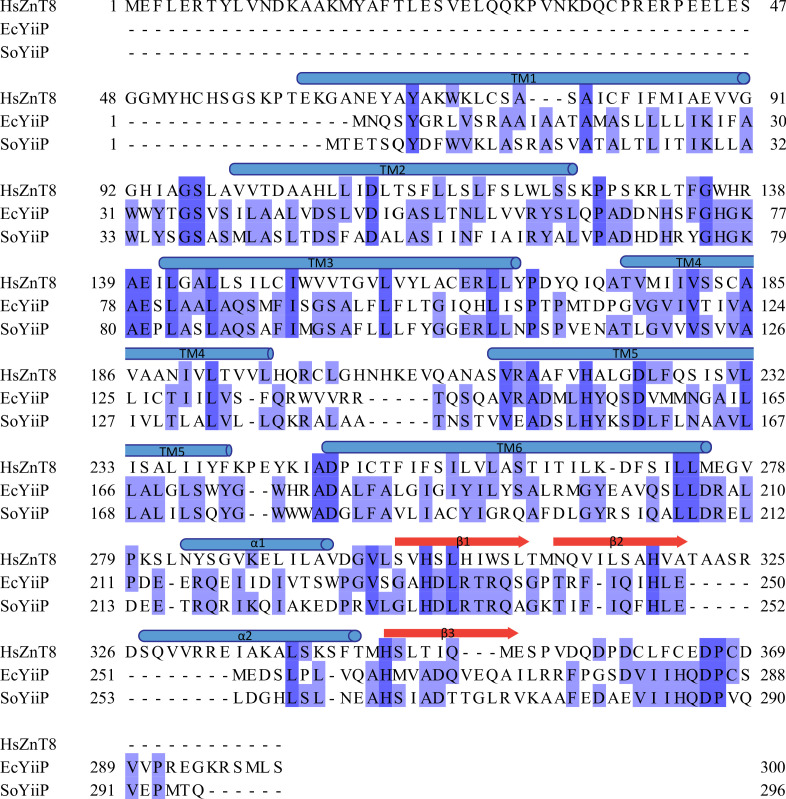
Figure 1u2014figure supplement 1.
Sequence alignment of HsZnT8 ( Q8IWU4 ), EcYiiP ( P69380 ) and SoYiiP ( Q8E919 ).
The protein accession codes for HsZnT8 and its bacterial orthologs are indicated.
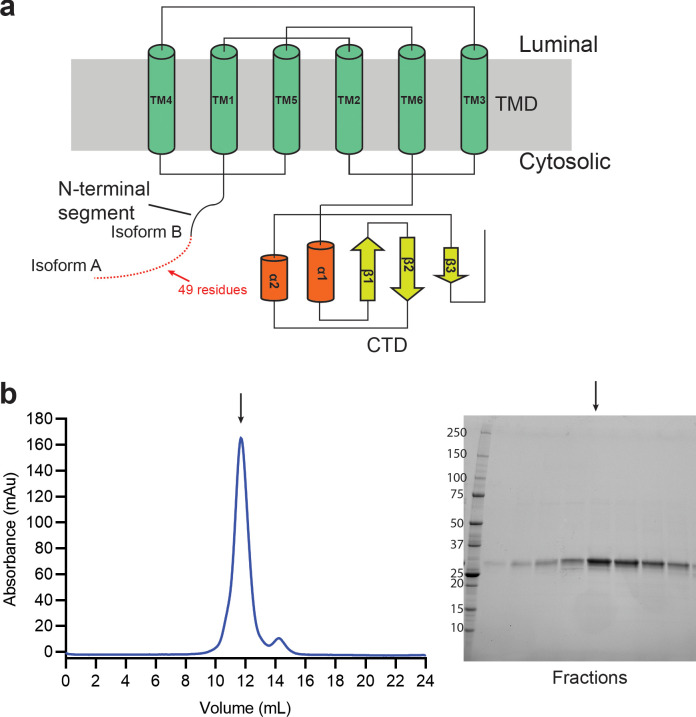
Figure 1u2014figure supplement 2.
Purification of the HsZnT8.
( a ) Topology and domain organization of the HsZnT8 subunit. The starting points of isoform A and B are labeled. ( b ) A representative size-exclusion chromatography of HsZnT8-DM (left) and the SDSu2...
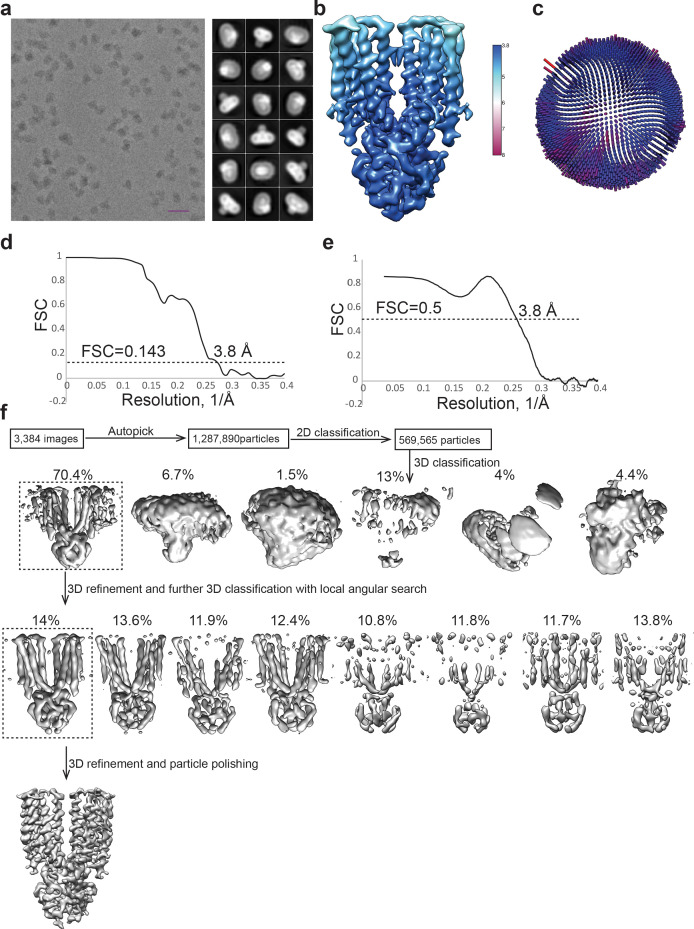
Figure 1u2014figure supplement 3.
Cryo-EM analysis of the HsZnT8-DM in the absence of Zn 2+ .
( a ) Representative electron micrograph and 2D class averages of the HsZnT8-DM. (Scale bar: 200 u00c5) ( b ) Cryo-EM map colored by local resolution. ( c ) Euler angle distribution of particles used ...
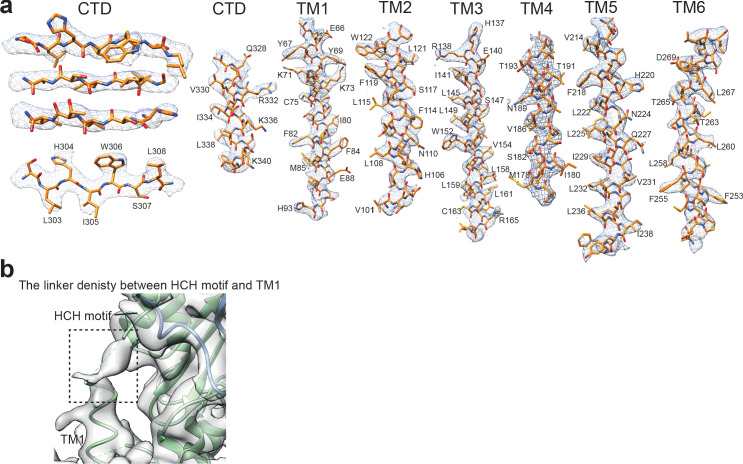
Figure 1u2014figure supplement 4.
Cryo-EM density of HsZnT8-DM in the absence of Zn 2+ .
( a ) Representative density maps of CTD domain and each TM of HsZnT8-DM. ( b ) The cryo-EM map of HsZnT8-DM low-pass filtered to 5 u00c5 showing the clear density (indicated by a dash box) for the li...
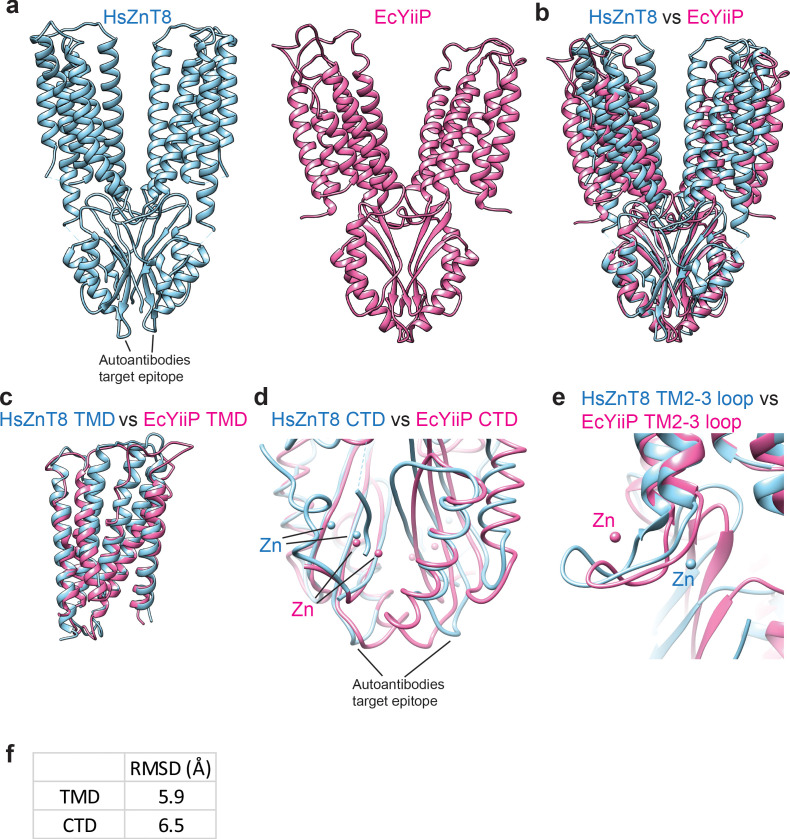
Figure 1u2014figure supplement 5.
Structural comparison between HsZnT8 and EcYiiP in outward-facing conformation.
( a ) Overall structures of HsZnT8 (blue) and EcYiiP (pink, PDB: 3H90) in outward-facing conformation. ( b ) Superposition of the dimeric HsZnT8 (blue) and EcYiiP (pink). ( c ) Superposition of the TM...
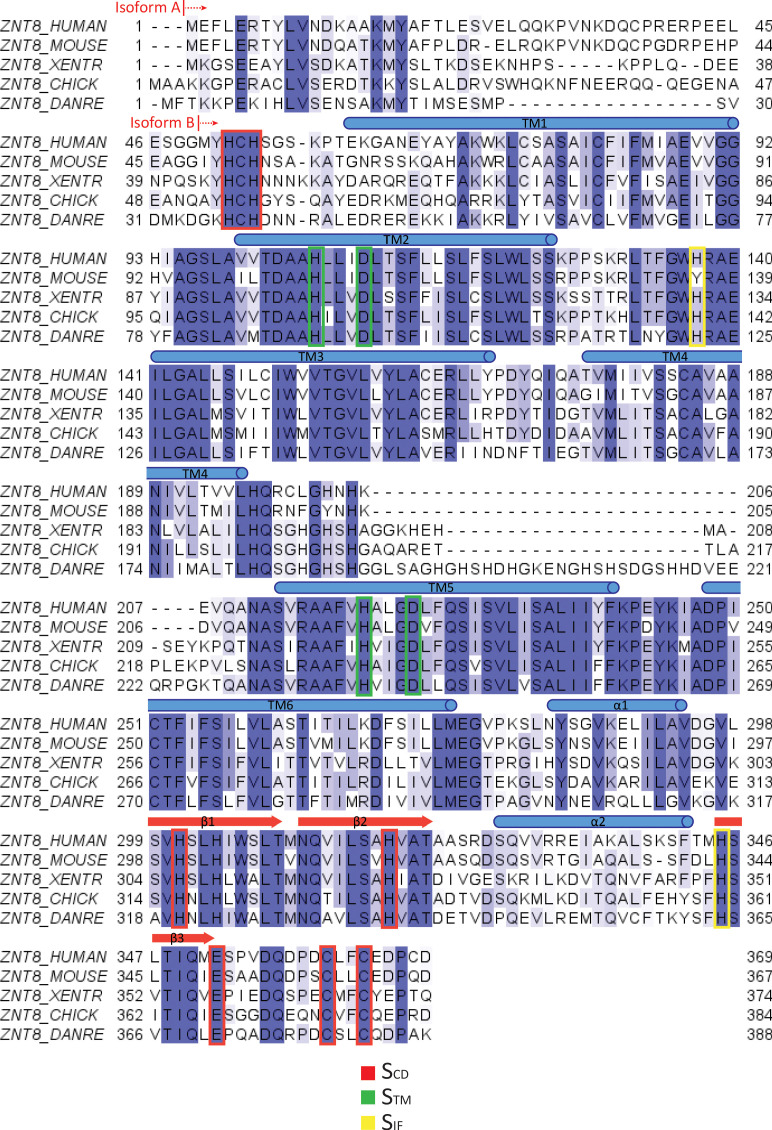
Figure 1u2014figure supplement 6.
Sequence alignment of ZnT8 from human ( Q8IWU4 ), mouse ( Q8BGG0 ), western clawed frog ( Q5XHB4 ), chicken (A0A1D5NY81) and zebrafish (A0A0R4IFM6).
The starting residues of isoform A and B are labeled. The Zn 2+ binding sites residues are marked with boxes. The protein accession codes for different ZnT8 orthologs are indicated.
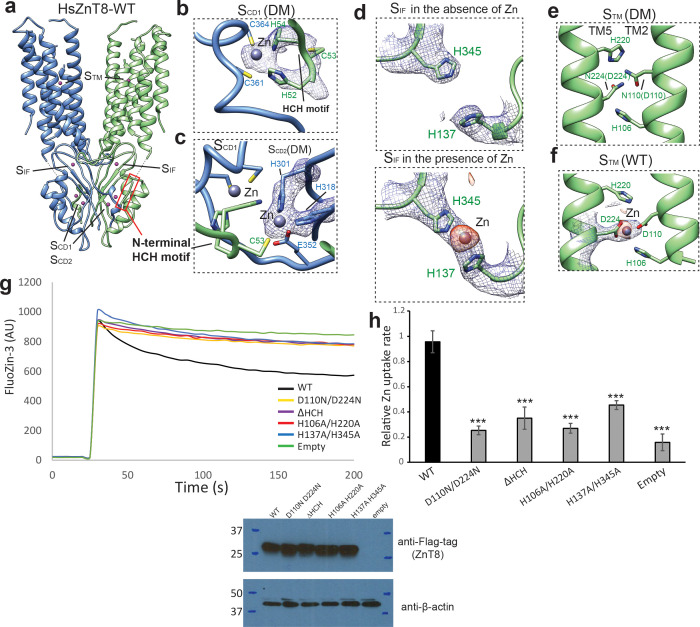
Figure 2.
The Zn 2+ binding sites in HsZnT8.
( a ) Overall view of Zn 2+ binding sites in HsZnT8-WT. The location of each site is indicated by a dash box. ( b ) and ( c ) Detailed views of S CD1 and S CD2 in the structure of HsZnT8-DM in the abs...
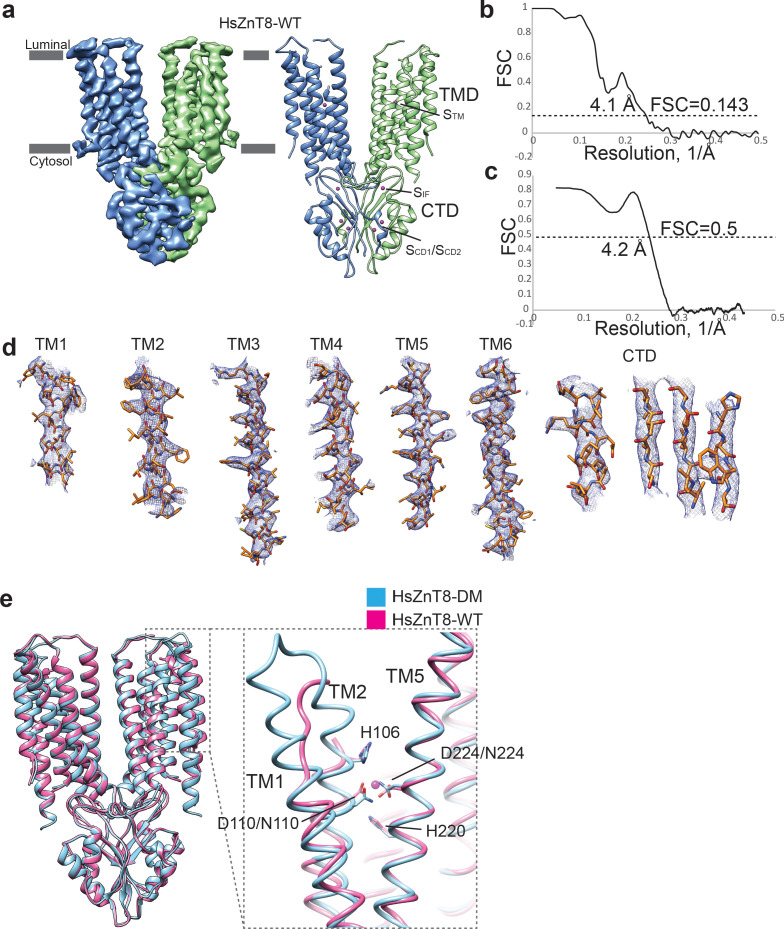
Figure 2u2014figure supplement 1.
Cryo-EM analysis of the HsZnT8-WT in the presence of Zn 2+ .
( a ) 3D reconstruction of HsZnT8-WT in the presence of Zn 2+ (left) and the corresponding ribbon representation of this complex (right). The 4 Zn 2+ binding sites in one subunit are labeled. The boun...
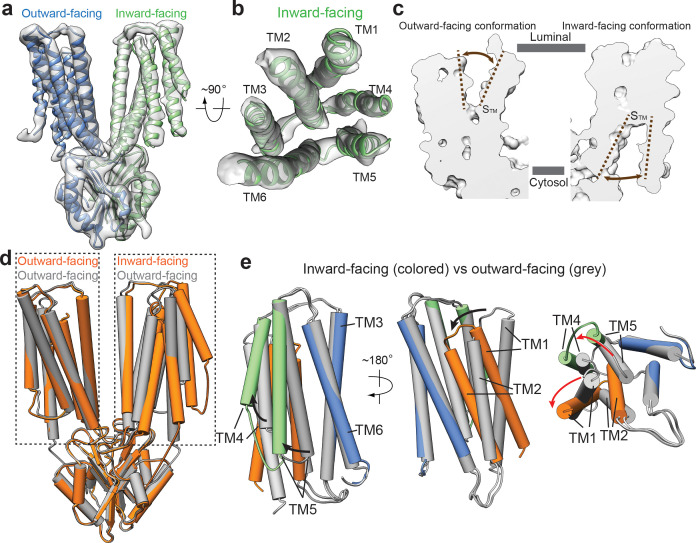
Figure 3.
Structural transitions between outward- and inward-facing conformations.
( a ) 3D reconstruction of HsZnT8-WT in the absence of Zn 2+ and the ribbon representation of the model fitted into cryo-EM map. ( b ) Top view of the TMD (TMs 1u20136) from the inward-facing subunit ...
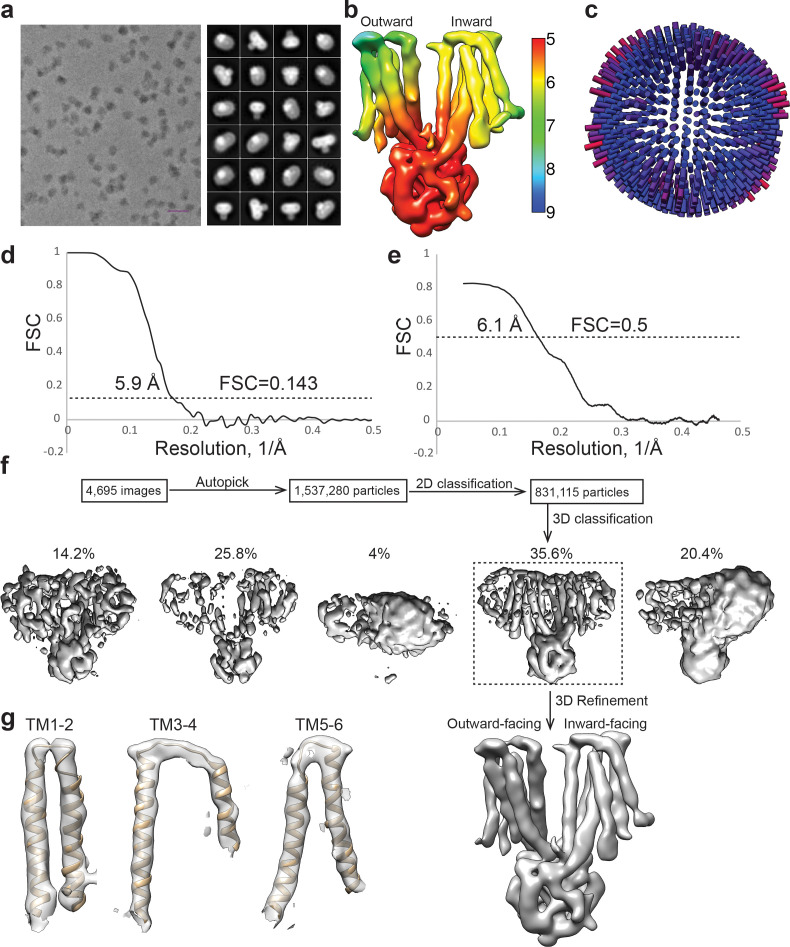
Figure 3u2014figure supplement 1.
Cryo-EM analysis of the HsZnT8-WT in the absence of Zn 2+ .
( a ) Representative electron micrograph and 2D class averages of the HsZnT8-WT in the absence of Zn 2+ . (Scale bar: 200 u00c5) ( b ) Cryo-EM map colored by local resolution. ( c ) Euler angle distri...
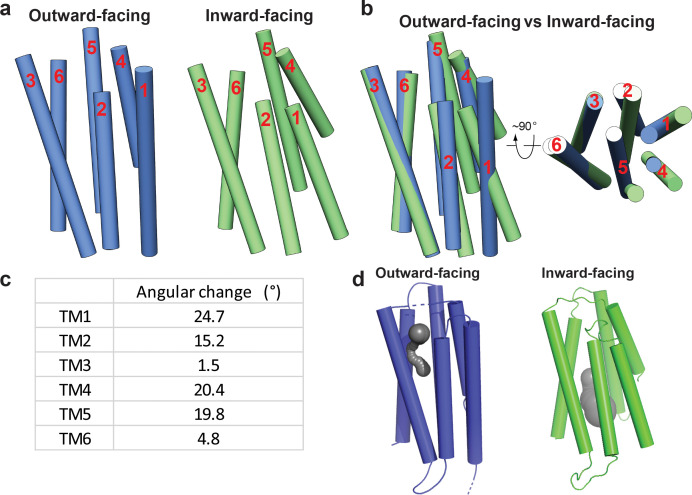
Figure 3u2014figure supplement 2.
Structural comparison between HsZnT8 in outward- and inward-facing conformations.
( a ) Structures of HsZnT8 TMD in outward- (blue) and inward-facing (green) conformation. The loops connecting TMs are omitted for clarity. ( b ) Superposition of the HsZnT8 TMD in outward- (blue) and...
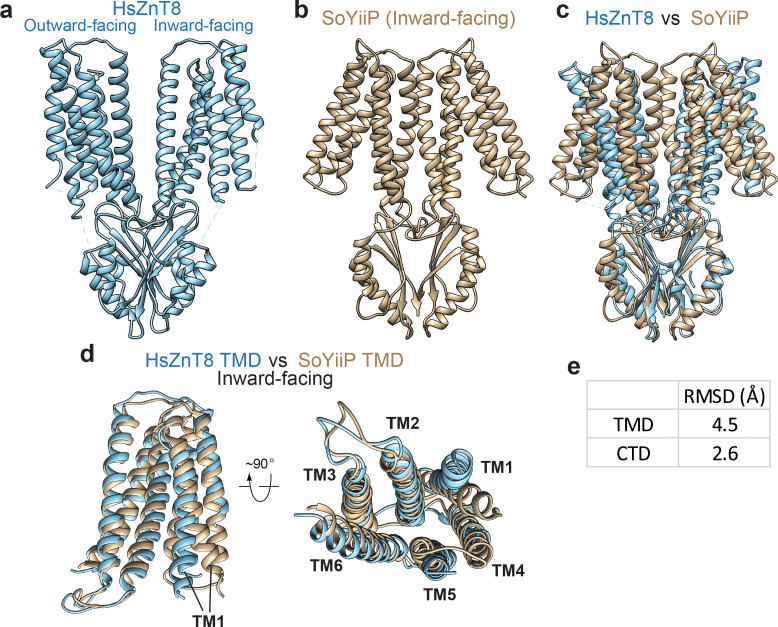
Figure 3u2014figure supplement 3.
Structural comparison between HsZnT8 and SoYiiP in inward-facing conformation.
( a ) Overall structures of HsZnT8 (blue) in heterogeneous conformation. ( b ) Overall structure of SoYiiP (yellow, PDB: 5VRF) in inward-facing conformation. ( c ) Superposition of the dimeric HsZnT8 ...
Video 1.
Structural transitions of the TMD of HsZnT8 between outward- and inward-facing conformations.
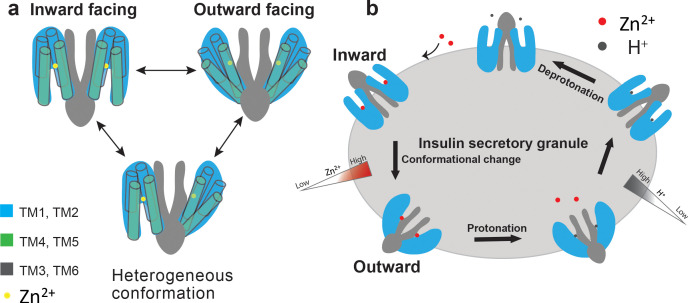
Figure 4.
Proposed working model of HsZnT8.
( a ) A cartoon representation illustrates that each ZnT8 subunit may shuttle between inward- and outward-facing conformations independently during the Zn 2+ transport cycle. ( b ) Schematic represent...
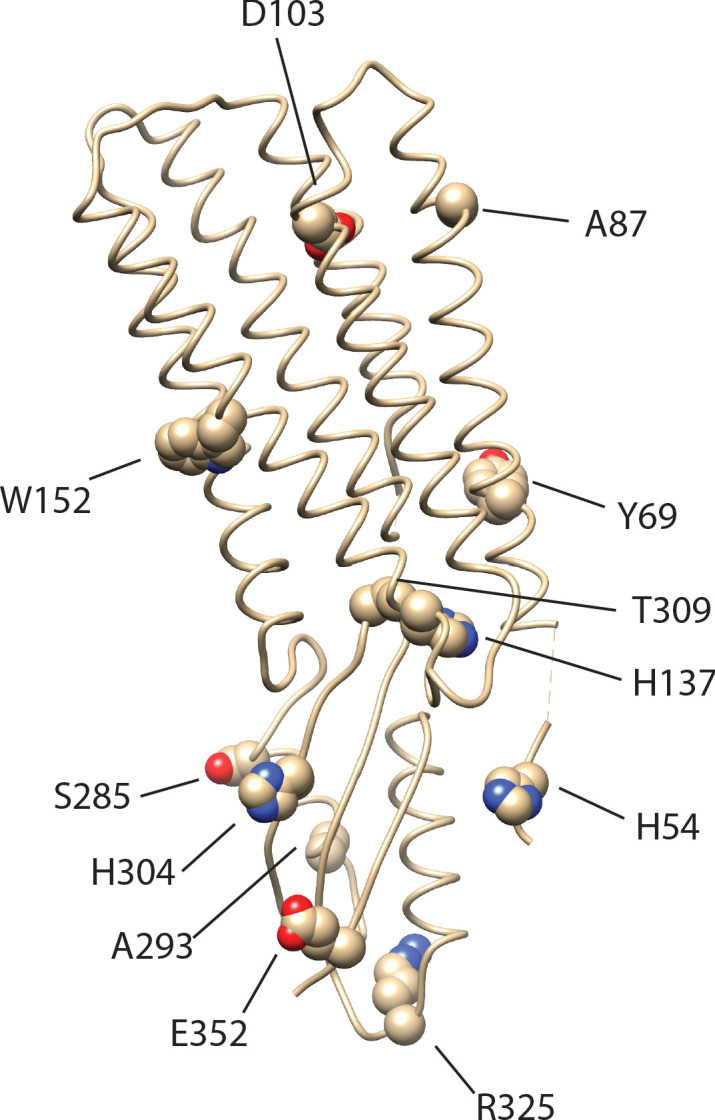
Figure 4u2014figure supplement 1.
Mapping of the disease-associated point mutations onto HsZnT8.
Several of these mutations are found in other ZnTs, but conserved in ZnT8.
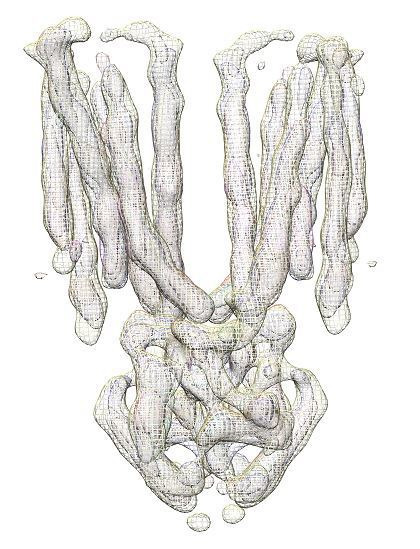
Author response image 1.
Figure images are served from the NIH/NLM PubMed Central Open Access Subset or Europe PMC; copyright remains with the publishers and authors.
💬 Discussion
0 commentsNo comments yet. Be the first to start a discussion!
Leave a Comment