Abstract
Diabetic retinopathy (DR) is a retinal disease caused by metabolic disorders of glucose tolerance that can lead to irreversible blindness if not adequately treated. Retinal pigment epithelial cell (RPEC) dysfunction contributes to the pathogenesis of DR. In the present study the anti‑inflammatory effect of curcumin (CUR) was investigated in RPECs damaged by high glucose levels. RPEC treated with 30 mmol/l glucose was regarded as high glucose group, and cells treated with 24.4 mmol/l mannitol was set as equivalent osmolarity group. Cell Counting Kit‑8 assay was used to measure RPEC viability, the expression of phosphorylated (p)‑AKT and p‑mammalian target of rapamycin (mTOR) were assessed by western blot, and secretion of tumor necrosis factor (TNF)‑α, interleukin (IL)‑6 and IL‑1β in the culture medium was measured by ELISA. Intracellular reactive oxygen species (ROS) levels were measured by laser scanning confocal microscope. The present data indicated that, compared with mannitol treatment, high glucose treatment reduced RPEC viability, increased TNF‑α, IL‑6 and IL‑1β secretion, increased ROS formation and promoted phosphorylation of AKT and mTOR. The antioxidant N‑acetylcysteine, the phosphoinositide 3‑kinase (PI3K)/AKT inhibitor LY294002 and the mTOR inhibitor rapamycin ameliorated the effects of high glucose. In addition, pretreatment with 10 µmol/l CUR reduced secretion levels of TNF‑α, IL‑6 and IL‑1β, ROS formation and phosphorylation of AKT and mTOR. In conclusion, CUR inhibited high glucose‑induced inflammatory injury in RPECs by interfering with the ROS/PI3K/AKT/mTOR signaling pathway. The present study may reveal the molecular mechanism of CUR inhibition effects to high glucose‑induced inflammatory injury in RPEC.
🔬 Techniques
✨ Fluorophores
🧪 Sample Preparation
🔬 Cell Lines
🏭 Microscope Brands
🧪 Reagent Suppliers
💻 Software Details
🏛️ Research Organizations (ROR)
Affiliated research institutions:
📋 Methods
Regents CUR (see Fig. 1 for chemical structure) was obtained from BioBioPha Co., Ltd. (Kunming, China). Glucose and mannitol were purchased from Sigma-Aldrich (Merck KGaA, Darmstadt, Germany). RPMI-1640 medium with glucose (5.6 mmol/l) was purchased from Gibco (Thermo Fisher Scientific, Inc., Waltham, MA, USA). Fetal bovine serum (FBS) was purchased from HyClone (GE Healthcare, Chicago, IL, USA). Penicillin and streptomycin were purchased from Beijing Solarbio Science & Technology Co., Ltd. (Beijing, China). 2′,7′-dichlorodihydrofluororescein diacetate (DCFH-DA), DAPI, LY294002, rapamycin and N-acetylcysteine (NAC) were obtained from Beyotime Institute of Biotechnology (Jiangsu, China).
Cell Counting Kit
(CCK)-8 was purchased from Invitrogen (Thermo Fisher Scientific, Inc.). AKT (catalog no. 9272), phosphorylated (p)-AKT (catalog no. 9611) and p-mTOR (catalog no. 2971) antibodies were purchased from Cell Signaling Technology Inc. (Danvers, MA, USA). mTOR (catalog no. 66888-1-Ig) and β-actin (catalog no. 60008-1-Ig) antibodies were obtained from ProteinTech Group, Inc. (Chicago, IL, USA). Horseradish peroxidase (HRP)-conjugated goat anti-mouse secondary antibodies (catalog no. TA130004) and HRP-conjugated goat anti-rabbit secondary antibodies (catalog no. TA130023) were purchased from the OriGene Technologies, Inc. (Beijing, China).
Cell culture ARPE-19 human
RPECs were obtained from the Type Culture Collection of the Chinese Academy of Sciences (catalog no. CRL-4000; Shanghai, China). RPECs were cultured in RPMI-1640 medium supplemented with 10% FBS and 100 U/ml penicillin/streptomycin, and maintained at 37°C in a saturated humidified atmosphere with 5% CO 2 . Prior to experiments, RPECs were cultured in RPMI-1640 medium with 1% FBS at 37°C for 12 h, and glucose was added to the culture medium (30 mmol/l) for 0, 6, 12 and 24 h. To exclude the effects of high osmolarity on RPECs, 24.4 mmol/l mannitol was used as an equivalent osmolarity control to 30 mmol/l glucose. For specific inhibitors or antioxidant treatments, RPECs were incubated with LY294002 (1 µmol/l), rapamycin (10 µmol/l) or NAC (1 mmol/l) for 1 h at 37°C before high glucose treatment; and in CUR treatment experiments, RPECs were incubated with CUR for 1 h at 37°C prior to high glucose treatment. The concentration of LY294002 was selected based on our previous study ( 30 ), whereas the concentrations of rapamycin and NAC were determined according to previously reported methods ( 31 ).
Show full methods section
Regents CUR (see Fig. 1 for chemical structure) was obtained from BioBioPha Co., Ltd. (Kunming, China). Glucose and mannitol were purchased from Sigma-Aldrich (Merck KGaA, Darmstadt, Germany). RPMI-1640 medium with glucose (5.6 mmol/l) was purchased from Gibco (Thermo Fisher Scientific, Inc., Waltham, MA, USA). Fetal bovine serum (FBS) was purchased from HyClone (GE Healthcare, Chicago, IL, USA). Penicillin and streptomycin were purchased from Beijing Solarbio Science & Technology Co., Ltd. (Beijing, China). 2′,7′-dichlorodihydrofluororescein diacetate (DCFH-DA), DAPI, LY294002, rapamycin and N-acetylcysteine (NAC) were obtained from Beyotime Institute of Biotechnology (Jiangsu, China).
Cell Counting Kit
(CCK)-8 was purchased from Invitrogen (Thermo Fisher Scientific, Inc.). AKT (catalog no. 9272), phosphorylated (p)-AKT (catalog no. 9611) and p-mTOR (catalog no. 2971) antibodies were purchased from Cell Signaling Technology Inc. (Danvers, MA, USA). mTOR (catalog no. 66888-1-Ig) and β-actin (catalog no. 60008-1-Ig) antibodies were obtained from ProteinTech Group, Inc. (Chicago, IL, USA). Horseradish peroxidase (HRP)-conjugated goat anti-mouse secondary antibodies (catalog no. TA130004) and HRP-conjugated goat anti-rabbit secondary antibodies (catalog no. TA130023) were purchased from the OriGene Technologies, Inc. (Beijing, China).
Cell culture ARPE-19 human
RPECs were obtained from the Type Culture Collection of the Chinese Academy of Sciences (catalog no. CRL-4000; Shanghai, China). RPECs were cultured in RPMI-1640 medium supplemented with 10% FBS and 100 U/ml penicillin/streptomycin, and maintained at 37°C in a saturated humidified atmosphere with 5% CO 2 . Prior to experiments, RPECs were cultured in RPMI-1640 medium with 1% FBS at 37°C for 12 h, and glucose was added to the culture medium (30 mmol/l) for 0, 6, 12 and 24 h. To exclude the effects of high osmolarity on RPECs, 24.4 mmol/l mannitol was used as an equivalent osmolarity control to 30 mmol/l glucose. For specific inhibitors or antioxidant treatments, RPECs were incubated with LY294002 (1 µmol/l), rapamycin (10 µmol/l) or NAC (1 mmol/l) for 1 h at 37°C before high glucose treatment; and in CUR treatment experiments, RPECs were incubated with CUR for 1 h at 37°C prior to high glucose treatment. The concentration of LY294002 was selected based on our previous study ( 30 ), whereas the concentrations of rapamycin and NAC were determined according to previously reported methods ( 31 ).
CCK-8 assay
RPEC viability was measured using a CCK-8 method. Briefly, RPECs were seeded in 96-well plates at a density of 1–1.5×10 4 cells/ml. After culturing at 37°C for 0, 6, 12 or 24 h, 10 µl CCK-8 solution was added and the cells were incubated at 37°C for 4 h. Optical density (OD) was measured at 450 nm using a microplate reader (Molecular Devices, LLC, Sunnyvale, CA, USA). This experiment was replicated three times. ELISA RPECs were seeded in 96-well plates at a density of 1–1.5×10 4 cells/ml and incubated for 12 h at 37°C. Following incubation, the medium was collected and TNF-α (catalog no. ab181421), IL-1β (catalog no. ab100562) and IL-6 (catalog no. ab46027) content were measured by ELISA kits (Abcam, Cambridge, UK), according to the manufacturer's protocols. This experiment was replicated three times.
Detection of intracellular ROS
The intracellular ROS content of RPECs was examined following incubation with cell-permeable DCFH-DA, which is converted to fluorescent DCF in the presence of ROS. Briefly, cells were seeded in a 6-well plate at a density of 1–1.5×10 7 cells/ml. Following treatment with 30 mmol/l glucose or 24.4 mmol/l mannitol for 12 h, 10 µmol/l DCFH-DA and 1 µg/l DAPI in FBS-free RPMI-1640 were added and the plates were incubated for 20 min at 37°C. Cells were washed using RPMI-1640 with 10% FBS, and images were captured using a laser scanning confocal microscope (Olympus Corporation, Tokyo, Japan). The fluorescence intensity was measured in six random fields and analyzed using ImageJ software (version 1.4l; National Institutes of Health, Bethesda, MD, USA).
Western blot analysis
RPECs in the various treatments cultured on 6-well plates were collected with pancreatin and lysed on ice for 30 min in Western and IP Cell Lysis buffer (catalog no. P0013J; Beyotime Institute of Biotechnology) supplemented with protease inhibitor cocktail and phosphatase inhibitors (150 µl). Protein levels were quantified using a Bicinchoninic Acid Protein Assay kit (catalog no. P0009; Beyotime Institute of Biotechnology). Protein extracts (50 µg) were separated by 10% SDS-PAGE and transferred onto polyvinylidene difluoride membranes. Following blocking with 10% skim milk overnight at 4°C, the membranes were incubated with primary antibodies against p-AKT (1:500), p-mTOR (1:600) or control β-actin (1:50,000) at 4°C for 12 h, washed three times with PBS, followed by incubation with HRP-conjugated secondary antibodies (1:2,000) for 2.5 h at room temperature. Each membrane was stripped and re-probed for its corresponding total protein, AKT (1:1,000) or mTOR (1:1,200). Protein bands were visualized using a chemiluminescence detection system (Pierce; Thermo Fisher Scientific, Inc.). Images were captured and analyzed using ImageJ software (version 1.41; National Institutes of Health, Bethesda, MD, USA); β-actin was used for normalization.
Statistical analysis
Statistical analysis was performed on GraphPad Prism 6.0 (GraphPad Software, Inc. La Jolla, CA, USA). All data are presented as the mean ± standard error of the mean of three independent experiments. Statistical analysis was performed by one-way analysis of variance, followed by the Tukey-Kramer post-test to determine any significant differences. P
📊 Figures
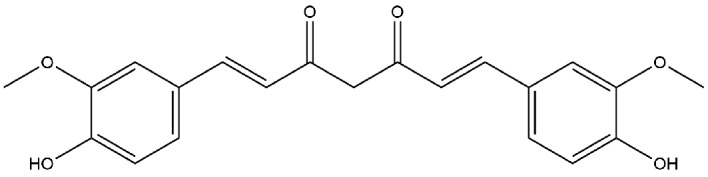
Figure 1.
The chemical structure of curcumin; 1,7-Bis(4-hydroxy-3-methoxyphenyl)-1,6-heptadiene-3,5-dione.
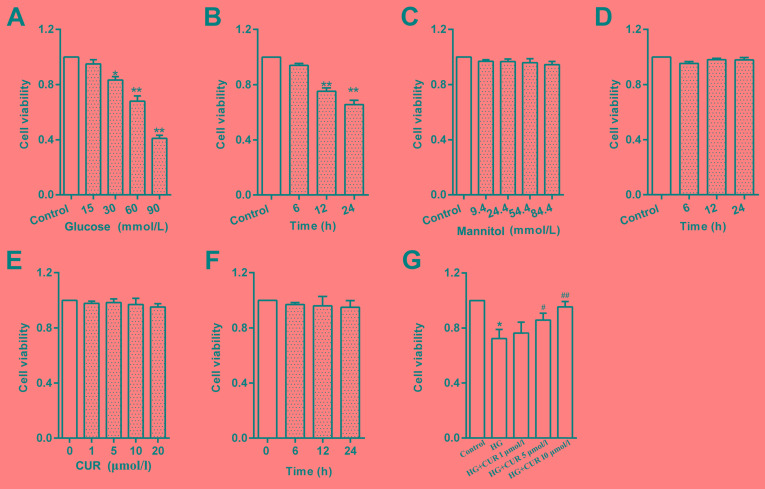
Figure 2.
HG treatment reduces RPEC viability. (A) Effects of various glucose concentrations (0u201390 mmol/l) on RPECs viability following 12 h incubation. (B) Effects of HG (30 mmol/l) on RPECs at varying inc...
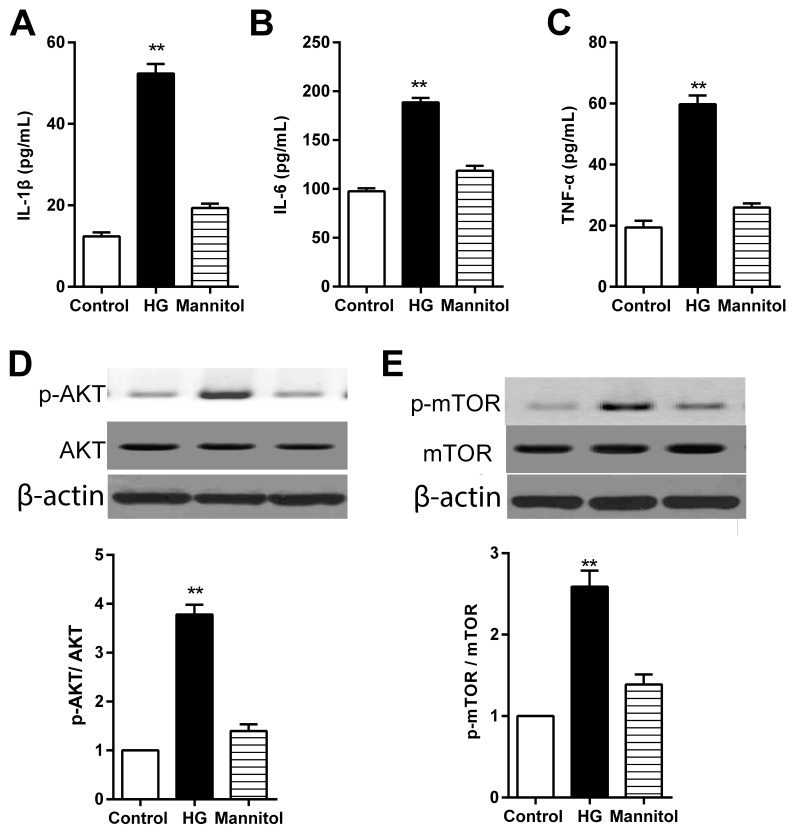
Figure 3.
High glucose treatment increases the secretion levels of IL-1u03b2, IL-6 and TNF-u03b1 in RPECs. (A-C) Expression levels of (A) IL-1u03b2, (B) IL-6 and (C) TNF-u03b1 in the culture medium of cells tre...
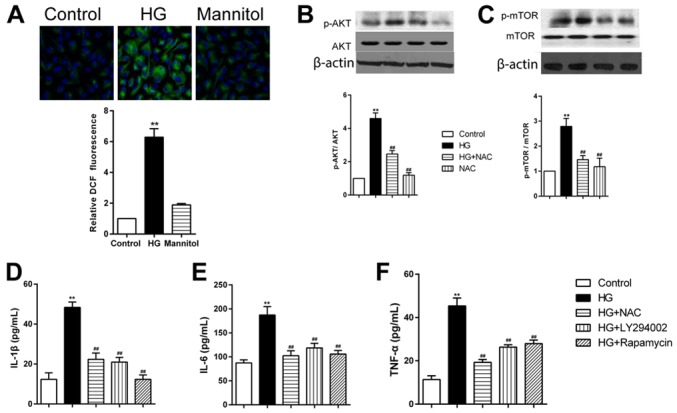
Figure 4.
HG treatment increases cytokine secretion RPECs via the ROS/PI3K/AKT/mTOR signaling pathway. (A) ROS formation in cells treated with high glucose or mannitol for 12 h was measured by 2u2032,7u2032-dic...
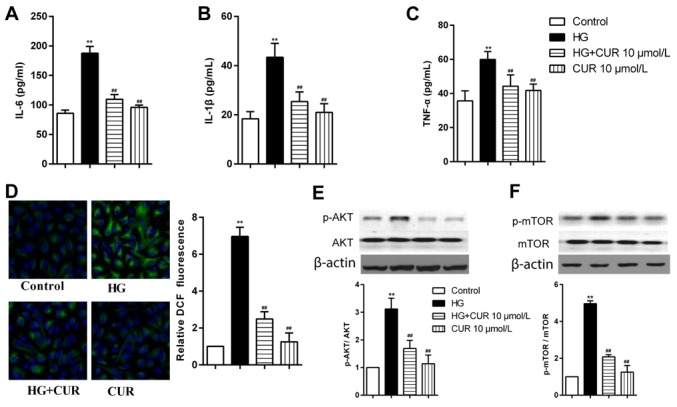
Figure 5.
CUR treatment reduces the high glucose-induced secretion of IL-1u03b2, IL-6 and TNF-u03b1 via the ROS/PI3K/AKT/mTOR signaling pathway in RPECs. (A-C) Expression levels of (A) IL-6, (B) IL-1u03b2 and (...
Figure images are served from the NIH/NLM PubMed Central Open Access Subset or Europe PMC; copyright remains with the publishers and authors.
💬 Discussion
0 commentsNo comments yet. Be the first to start a discussion!
Leave a Comment