Abstract
AbstractChanges in protein subcellular localization and abundance are central to biological regulation in eukaryotic cells. Quantitative measures of protein dynamics in vivo are therefore highly useful for elucidating specific regulatory pathways. Using a combinatorial approach of yeast synthetic genetic array technology, high-content screening, and machine learning classifiers, we developed an automated platform to characterize protein localization and abundance patterns from images of log phase cells from the open-reading frame−green fluorescent protein collection in the budding yeast, Saccharomyces cerevisiae. For each protein, we produced quantitative profiles of localization scores for 16 subcellular compartments at single-cell resolution to trace proteome-wide relocalization in conditions over time. We generated a collection of ∼300,000 micrographs, comprising more than 20 million cells and ∼9 billion quantitative measurements. The images depict the localization and abundance dynamics of more than 4000 proteins under two chemical treatments and in a selected mutant background. Here, we describe CYCLoPs (Collection of Yeast Cells Localization Patterns), a web database resource that provides a central platform for housing and analyzing our yeast proteome dynamics datasets at the single cell level. CYCLoPs version 1.0 is available at http://cyclops.ccbr.utoronto.ca. CYCLoPs will provide a valuable resource for the yeast and eukaryotic cell biology communities and will be updated as new experiments become available.
🔬 Techniques
🧬 Organisms
💻 Software
✨ Fluorophores
🧪 Sample Preparation
🏭 Microscope Brands
🧪 Reagent Suppliers
💻 Software Details
🏛️ Research Organizations (ROR)
Affiliated research institutions:
📊 Figures
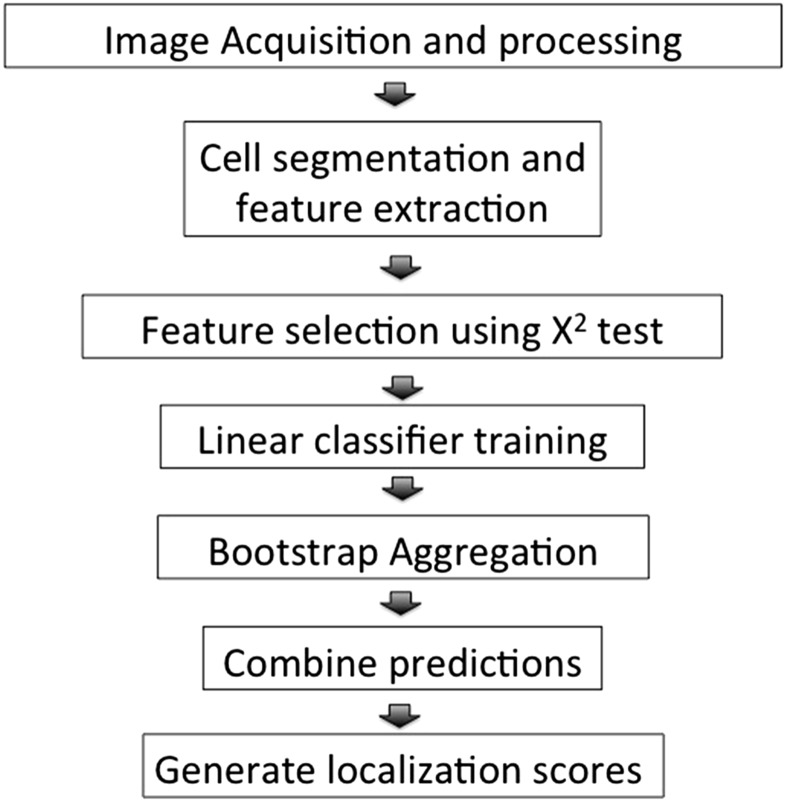
Figure 1
Overview of the ensLOC framework for quantifying subcellular localization of yeast proteins.
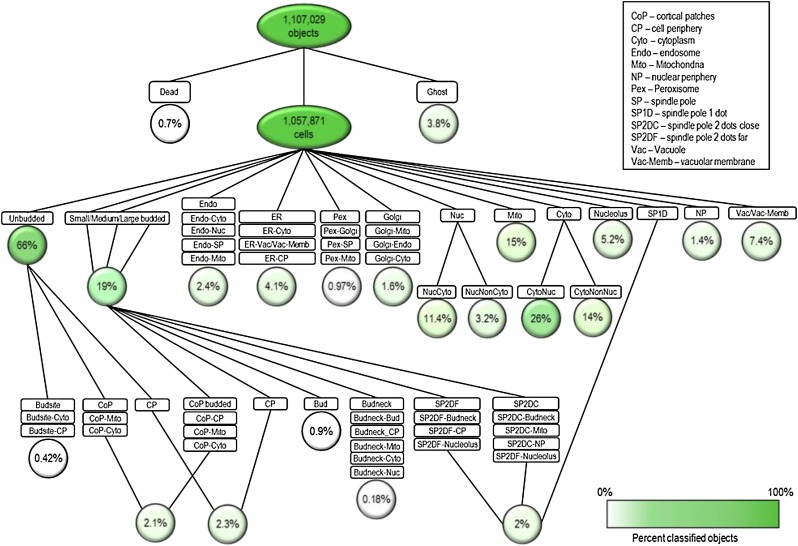
Figure 2
Diagram illustrating the ensemble of 60 binary classifiers for protein localization and quantification (modified from Chong et al. 2015 ). Only cell images that were not filtered by the quality-contro...
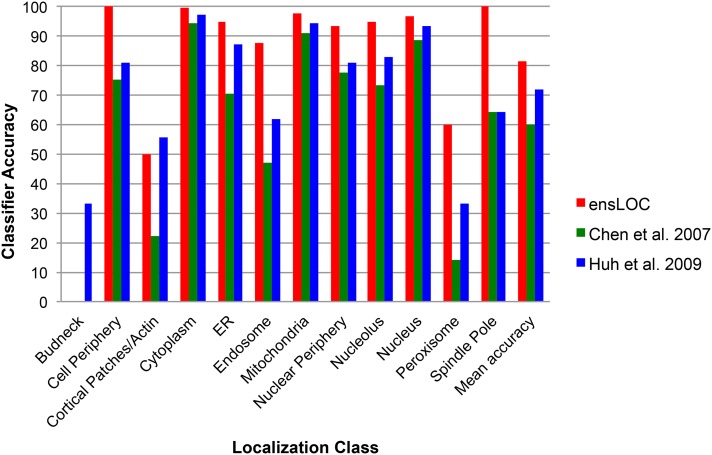
Figure 3
Classifier accuracy of the ensLOC framework. The accuracy of the ensLOC framework (red) in assigning protein localization to 12 different subcellular compartments (X-axis) is compared with two other a...
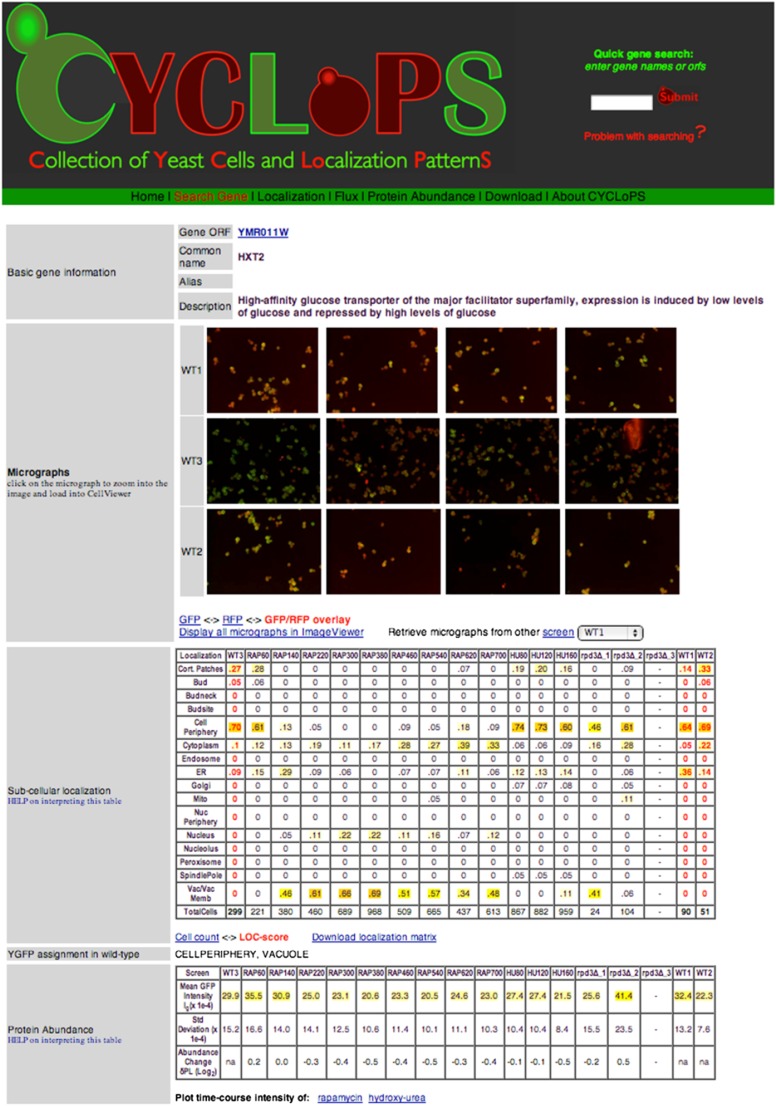
Figure 4
Screen shot of sample search and result page generated by CYCLoPs is shown. A query of the Hxt2 protein produces images of yeast cells from three wild-type screens (WT1, WT2, WT3). The tables list num...
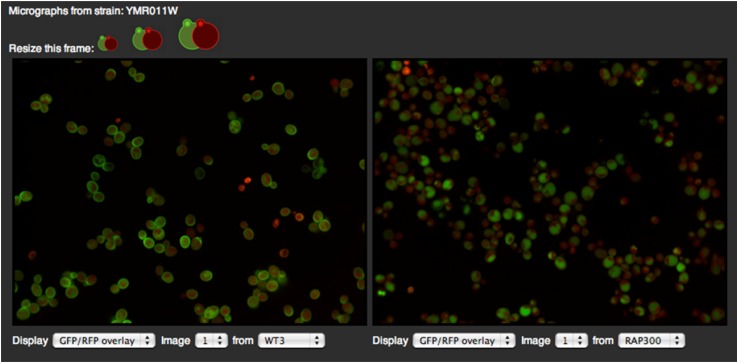
Figure 5
ImageViewer showing micrographs of a wild-type strain expressing Hxt2-GFP after growth in standard medium (left) and 300 min after treatment with rapamycin (RAP300, right).
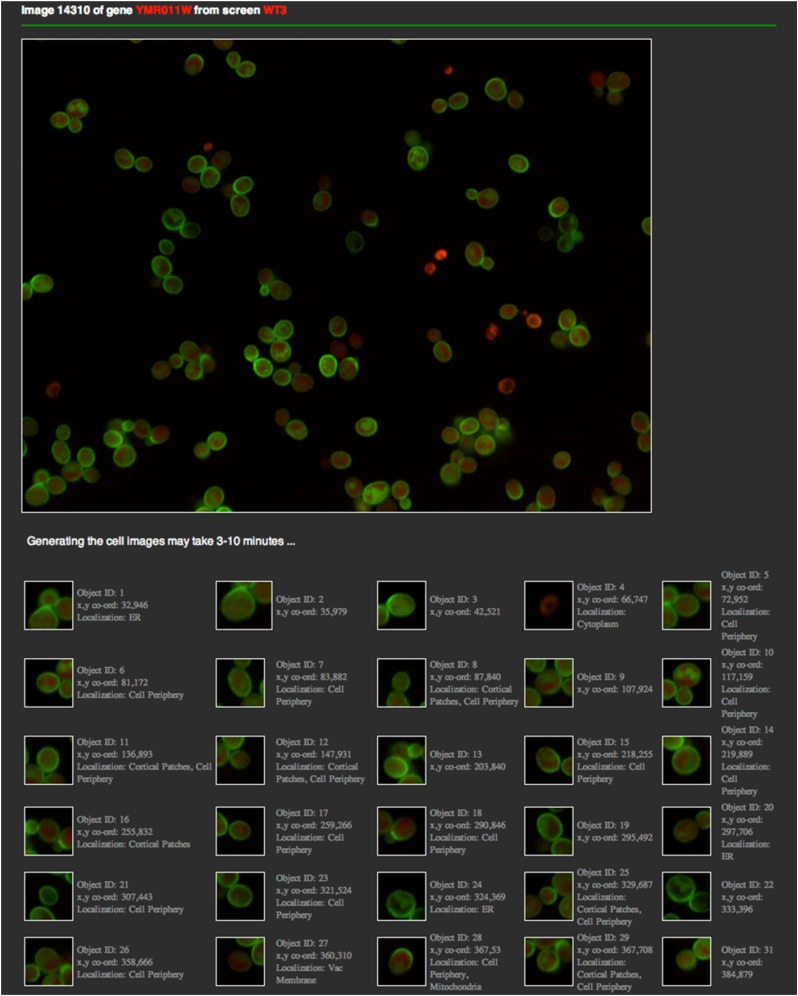
Figure 6
Cell viewer for inspecting individual cells in a micrograph.
Figure images are served from the NIH/NLM PubMed Central Open Access Subset or Europe PMC; copyright remains with the publishers and authors.
💬 Discussion
0 commentsNo comments yet. Be the first to start a discussion!
Leave a Comment