Abstract
AbstractThe rapid spread of COVID-19 is motivating development of antivirals targeting conserved SARS-CoV-2 molecular machinery. The SARS-CoV-2 genome includes conserved RNA elements that offer potential small-molecule drug targets, but most of their 3D structures have not been experimentally characterized. Here, we provide a compilation of chemical mapping data from our and other labs, secondary structure models, and 3D model ensembles based on Rosetta's FARFAR2 algorithm for SARS-CoV-2 RNA regions including the individual stems SL1-8 in the extended 5′ UTR; the reverse complement of the 5′ UTR SL1-4; the frameshift stimulating element (FSE); and the extended pseudoknot, hypervariable region, and s2m of the 3′ UTR. For eleven of these elements (the stems in SL1–8, reverse complement of SL1–4, FSE, s2m and 3′ UTR pseudoknot), modeling convergence supports the accuracy of predicted low energy states; subsequent cryo-EM characterization of the FSE confirms modeling accuracy. To aid efforts to discover small molecule RNA binders guided by computational models, we provide a second set of similarly prepared models for RNA riboswitches that bind small molecules. Both datasets (‘FARFAR2-SARS-CoV-2’, https://github.com/DasLab/FARFAR2-SARS-CoV-2; and ‘FARFAR2-Apo-Riboswitch’, at https://github.com/DasLab/FARFAR2-Apo-Riboswitch’) include up to 400 models for each RNA element, which may facilitate drug discovery approaches targeting dynamic ensembles of RNA molecules.
🔬 Techniques
✨ Fluorophores
🏭 Microscope Brands
🧪 Reagent Suppliers
💻 Software Details
💻 Code & Software
Models of SARS-CoV-2 genomic elements generated by FARFAR2
High Throughput Robust Analysis of Capillary Electrophoresis
Basic Inference Engine for RNA Structure
Models of apo riboswitches generated by FARFAR2
💾 Data Repositories
🏛️ Research Organizations (ROR)
Affiliated research institutions:
📋 Methods
Chemical reactivity experiments
We collected chemical reactivity profiles for SL1–4 and SL2–6 of the 5′ UTR, the reverse complement of SL1–4, and the hypervariable region of the 3′ UTR. The DNA templates for the stem–loop 1–4 RNA were amplified from a gBlock sequence for the extended 5′ UTR, and the DNA template for the hyper-variable region was amplified from a gBlock sequence for the 3′ UTR. The SL2–6 construct was designed using the Primerize webserver ( 25 ) with built-in 5′ and 3′ ‘reference hairpins’ for signal normalization flanking the region of interest and building using PCR assembly following the Primerize protocol (primers and gBlock sequences ordered from Integrated DNA Technologies, sequences in Supplementary Table S5 ). For amplification off of gBlocks, primers were designed to add a Phi2.5 T7 RNA polymerase promoter sequence ( 26 ) (TTCTAATACGACTCACTATT) at the amplicon's 5′ end and a 20 bp Tail2 sequence (AAAGAAACAACAACAACAAC) at its 3′ end. The PCR reactions contained 5 ng of gBlock DNA template, 2 μM of forward and reverse primer, 0.2 mM of dNTPs, 2 units of Phusion DNA polymerase, and 1X of HF buffer. The reactions were first denatured at 98°C for 30 s. Then for 35 cycles, the samples were denatured at 98°C for 10 s, annealed at 64°C for 30 s, and extended at 72°C for 30°C. This was followed by an incubation at 72°C for 10 min for a final extension. Assembly products were verified for size via agarose gel electrophoresis and subsequently purified using Agencourt RNAClean XP beads. Purified DNA was quantified via NanoDrop (Thermo Scientific) and 8 pmol of purified DNA was then used for in vitro transcription with T7 TranscriptAid kits (Thermo Scientific). The resulting RNA was purified with Agencourt RNAClean XP beads supplemented with an additional 12% of PEG-8000 and quantified via NanoDrop. Owing to its longer length, the SL2–6 construct was subsequently size purified using a denaturing polyacrylamide gel (7 M urea, 1× TBE, hand-poured in Bio-Rad Criterion midi cassettes), loaded in 80% formamide, run at 18 W for 35 min following 1 h of pre-running the gel prior to loading. A RiboRuler LR size standard (Thermo Scientific) was used. The correct-sized band was visualized using SyBr Gold (Invitrogen) and excised using a blue-light transilluminator, and the RNA was finally purified from the gel slice using a Zymo ZR-PAGE recovery kit. For RNA modification, 1.2 pmol of RNA was denatured in 50 mM Na-HEPES pH 8.0 at 90°C for 3 min and cooled at room temperature for 10 min. The RNA was then folded with the addition of MgCl 2 to a final concentration of 10 mM in 15 μl, incubated at 50°C for 30 min, and then left at room temperature for 10 min. For chemical modification of folded RNA, fresh working stocks of 1-methyl-7-nitroisatoic anhydride (1M7) were prepared. For 1M7, 4.24 mg of 1M7 was dissolved in 1 ml of anhydrous DMSO. For a no-modification control reaction, 5 μl of RNase free H 2 O was added to 15 μl of folded RNA. Samples were incubated at room temperature for 15 min. Then, 5 μl of 5 M NaCl, 1.5 μl of oligo-dT Poly(A)Purist MAG beads (Ambion), and 0.065 pmol of 5′ fluorescein (FAM)-labeled Tail2-A20 primer were added (sequence in Supplementary Table S5 ), and the solution was mixed and incubated for 15 min. The magnetic beads were then pulled down by placing the mixture on a 96-post magnetic stand, washed twice with 100 μl of 70% EtOH, and air dried for 10 min before being resuspended in 2.5 μl RNase free H 2 O. For cDNA synthesis, 2.5 μl resuspension of purified, polyA magnetic beads carrying chemically modified RNA was mixed with 2.5 μl of reverse transcription premix with SuperScript-III (Thermo Fisher). The reaction was incubated at 48°C for 45 min. The RNA was then degraded by adding 5 μl of 0.4 M NaOH and incubating the mixture at 90 °C for 3 min. The degradation reaction was placed on ice and quickly quenched by the addition of 2 μl of an acid quench solution (1.4 M NaCl, 0.6 M HCl and 1.3 M NaOAc). Bead-bound, FAM labeled cDNA was purified by magnetic bead separation, washed twice with 100 μl of 70% EtOH, and air-dried for 10 min. To elute the bound cDNA, the magnetic beads were resuspended in 10.0625 μl ROX/Hi-Di (0.0625 μl of ROX 350 ladder [Applied Biosystems] in 10 μl of Hi-Di formamide [Applied Biosystems]) and incubated at room temperature for 20 min. The resulting eluate was loaded onto capillary electrophoresis sequencers (ABI-3100 or ABI-3730) either on a local machine or through capillary electrophoresis (CE) services rendered by ELIM Biopharmaceuticals. CE data were analyzed using the HiTRACE 2.0 package ( https://github.com/ribokit/HiTRACE ) ( 27 ), following the recommended steps for sequence assignment, peak fitting, background subtraction of the no-modification control, correction for signal attenuation, and reactivity profile normalization. Eterna chemical mapping experiments In separate high throughput experiments to probe RNA structures, Eterna players designed 3030 sequences for the Eterna Roll Your Own Structure Lab, including regions of the SARS-CoV-2 5′ UTR, FSE and 3′ UTR in Eterna Constructs 1–7 ( Supplementary Table S5 ). A DNA library for these constructs was synthesized by Genscript, with each construct 127 bases including the T7 RNA polymerase promoter sequence ( 26 ) (TTCTAATACGACTCACTATA) and a 20 bp Tail2 sequence (AAAGAAACAACAACAACAAC) at its 3′ end. This pool of DNA oligonucleotides (360 ng) was amplified by emulsion PCR with Phire Hot Start II DNA-Polymerase. An oil-surfactant mixture was prepared containing 80 μl of ABIL EM90, 1 μl of Triton X100 and 1919 μl of mineral oil. The oil phase was vortexed for 5 min and kept on ice for 30 min. An aqueous phase was prepared containing 1× Phire Hot Start II buffer, 0.2 mM dNTPs, 1.5 μl of Phire II DNA polymerase, 2 μl of the T7 promoter primer, 2 μM of the reverse complement of the Tail2 sequence, and 0.5 mg/ml of BSA in final volume of 75 μl. An emulsion was prepared in a 1.0 ml glass vial by first adding 300 μl of the oil–surfactant mixture into the glass vial, vortexing at 1000 rpm for 5 min, and then adding 10 μl of the aqueous phase every 10 s until the final emulsion volume was 350 μl. The emulsion was transferred into PCR tubes and PCR was performed by denaturing at 98°C for 30 s, cycling with 98°C for 10 s, 55°C for 10 s and 72°C for 30 s for 42 cycles, and extending at 72°C for 5 min. The PCR reaction was purified by adding 100 μl of mineral oil, vortexing, and centrifuging at 13 000 g for 10 min, and then discarding the oil phase. The PCR products were degreased with diethyl ether and ethyl acetate and incubated at 37°C for 5 min. The reaction volume was adjusted with H 2 O to 40 μl and then purified with 72 μl AMPure XP beads (Beckman Coulter), eluting into 20 μl of H 2 O. DNA was transcribed with TranscriptAid T7 High Yield Transcription Kit (K0441), at 37°C for 3 h, treated with DNAse-I for 30 min, and purified with AMPure XP beads with 40% PEG at a 7:3 ratio of beads to PEG. RNA was eluted with 25 μl of H 2 O. 15 pmol of RNA was added into 2 μl of 500 mM Na-HEPES, pH 8.0, denatured at 90°C for 3 min, and cooled down to room temperature for 10 min. 2 μl of 100 mM MgCl 2 was added, and the reaction volume was brought to 15 μl with H 2 O. RNA was incubated at 50°C for 30 min. RNA was cooled down at room temperature for 20 min before being modified with 5 μl of 1M7 (8.48 mg/ml of DMSO) or left untreated for an untreated control sample. The reaction was left room temperature for 15 min, in final volume at 20 μl. The reaction was quenched with 5 μl of 500 mM Na-MES pH 6.0, the volume was adjusted to be 100 μl, and the reaction was purified with ethanol precipitation. Reverse transcription was performed using SuperScript III RTase (Thermo Fisher). RNA was added into a reaction mix of 1× First strand buffer, 5 mM DTT, 0.8 mM dNTPs and 0.6 μl of SS-III RTase (Thermo Fisher), and 1 μl of 0.25 μM primer (RTB000 and RTB001 in Supplementary Table S5 for the no modification and 1M7 samples respectively, with these sequences adding an index sequence and Illumina adapter). The reaction volume was brought to 15 μl. The reaction was incubated at 48°C for 40 min and stopped by adding 5 μl of 0.4 M sodium hydroxide and heating the reaction at 90°C for 3 min, cooling the reaction on ice for 3 min, and neutralizing the reaction with 2 μl of an acid quench mix (2 ml of 5 M sodium chloride, 3 ml of 3 M sodium acetate, 2 ml of 2 M hydrochloric acid). cDNA was purified with Oligo C’ beads. Illumina adapters were ligated using Circ Ligase I (Lucigen) and linker pA-Adapt-Bp ( Supplementary Table S5 ), with ligation at 68°C for 2 h, and the reaction was stopped at 80°C for 10 min. 10 μl of 5 M NaCl cDNA was added, and cDNA was purified with AMPure XP and eluted in 15 μl H 2 O. The ligated product was sequenced on a Miseq for 101 cycles for read 1 and 51 cycles for read 2. Sequencing data were analyzed using the MAPseeker software, freely available for non-commercial use at https://eternagame.org/about/software .
Show full methods section
Chemical reactivity experiments
We collected chemical reactivity profiles for SL1–4 and SL2–6 of the 5′ UTR, the reverse complement of SL1–4, and the hypervariable region of the 3′ UTR. The DNA templates for the stem–loop 1–4 RNA were amplified from a gBlock sequence for the extended 5′ UTR, and the DNA template for the hyper-variable region was amplified from a gBlock sequence for the 3′ UTR. The SL2–6 construct was designed using the Primerize webserver ( 25 ) with built-in 5′ and 3′ ‘reference hairpins’ for signal normalization flanking the region of interest and building using PCR assembly following the Primerize protocol (primers and gBlock sequences ordered from Integrated DNA Technologies, sequences in Supplementary Table S5 ). For amplification off of gBlocks, primers were designed to add a Phi2.5 T7 RNA polymerase promoter sequence ( 26 ) (TTCTAATACGACTCACTATT) at the amplicon's 5′ end and a 20 bp Tail2 sequence (AAAGAAACAACAACAACAAC) at its 3′ end. The PCR reactions contained 5 ng of gBlock DNA template, 2 μM of forward and reverse primer, 0.2 mM of dNTPs, 2 units of Phusion DNA polymerase, and 1X of HF buffer. The reactions were first denatured at 98°C for 30 s. Then for 35 cycles, the samples were denatured at 98°C for 10 s, annealed at 64°C for 30 s, and extended at 72°C for 30°C. This was followed by an incubation at 72°C for 10 min for a final extension. Assembly products were verified for size via agarose gel electrophoresis and subsequently purified using Agencourt RNAClean XP beads. Purified DNA was quantified via NanoDrop (Thermo Scientific) and 8 pmol of purified DNA was then used for in vitro transcription with T7 TranscriptAid kits (Thermo Scientific). The resulting RNA was purified with Agencourt RNAClean XP beads supplemented with an additional 12% of PEG-8000 and quantified via NanoDrop. Owing to its longer length, the SL2–6 construct was subsequently size purified using a denaturing polyacrylamide gel (7 M urea, 1× TBE, hand-poured in Bio-Rad Criterion midi cassettes), loaded in 80% formamide, run at 18 W for 35 min following 1 h of pre-running the gel prior to loading. A RiboRuler LR size standard (Thermo Scientific) was used. The correct-sized band was visualized using SyBr Gold (Invitrogen) and excised using a blue-light transilluminator, and the RNA was finally purified from the gel slice using a Zymo ZR-PAGE recovery kit. For RNA modification, 1.2 pmol of RNA was denatured in 50 mM Na-HEPES pH 8.0 at 90°C for 3 min and cooled at room temperature for 10 min. The RNA was then folded with the addition of MgCl 2 to a final concentration of 10 mM in 15 μl, incubated at 50°C for 30 min, and then left at room temperature for 10 min. For chemical modification of folded RNA, fresh working stocks of 1-methyl-7-nitroisatoic anhydride (1M7) were prepared. For 1M7, 4.24 mg of 1M7 was dissolved in 1 ml of anhydrous DMSO. For a no-modification control reaction, 5 μl of RNase free H 2 O was added to 15 μl of folded RNA. Samples were incubated at room temperature for 15 min. Then, 5 μl of 5 M NaCl, 1.5 μl of oligo-dT Poly(A)Purist MAG beads (Ambion), and 0.065 pmol of 5′ fluorescein (FAM)-labeled Tail2-A20 primer were added (sequence in Supplementary Table S5 ), and the solution was mixed and incubated for 15 min. The magnetic beads were then pulled down by placing the mixture on a 96-post magnetic stand, washed twice with 100 μl of 70% EtOH, and air dried for 10 min before being resuspended in 2.5 μl RNase free H 2 O. For cDNA synthesis, 2.5 μl resuspension of purified, polyA magnetic beads carrying chemically modified RNA was mixed with 2.5 μl of reverse transcription premix with SuperScript-III (Thermo Fisher). The reaction was incubated at 48°C for 45 min. The RNA was then degraded by adding 5 μl of 0.4 M NaOH and incubating the mixture at 90 °C for 3 min. The degradation reaction was placed on ice and quickly quenched by the addition of 2 μl of an acid quench solution (1.4 M NaCl, 0.6 M HCl and 1.3 M NaOAc). Bead-bound, FAM labeled cDNA was purified by magnetic bead separation, washed twice with 100 μl of 70% EtOH, and air-dried for 10 min. To elute the bound cDNA, the magnetic beads were resuspended in 10.0625 μl ROX/Hi-Di (0.0625 μl of ROX 350 ladder [Applied Biosystems] in 10 μl of Hi-Di formamide [Applied Biosystems]) and incubated at room temperature for 20 min. The resulting eluate was loaded onto capillary electrophoresis sequencers (ABI-3100 or ABI-3730) either on a local machine or through capillary electrophoresis (CE) services rendered by ELIM Biopharmaceuticals. CE data were analyzed using the HiTRACE 2.0 package ( https://github.com/ribokit/HiTRACE ) ( 27 ), following the recommended steps for sequence assignment, peak fitting, background subtraction of the no-modification control, correction for signal attenuation, and reactivity profile normalization. Eterna chemical mapping experiments In separate high throughput experiments to probe RNA structures, Eterna players designed 3030 sequences for the Eterna Roll Your Own Structure Lab, including regions of the SARS-CoV-2 5′ UTR, FSE and 3′ UTR in Eterna Constructs 1–7 ( Supplementary Table S5 ). A DNA library for these constructs was synthesized by Genscript, with each construct 127 bases including the T7 RNA polymerase promoter sequence ( 26 ) (TTCTAATACGACTCACTATA) and a 20 bp Tail2 sequence (AAAGAAACAACAACAACAAC) at its 3′ end. This pool of DNA oligonucleotides (360 ng) was amplified by emulsion PCR with Phire Hot Start II DNA-Polymerase. An oil-surfactant mixture was prepared containing 80 μl of ABIL EM90, 1 μl of Triton X100 and 1919 μl of mineral oil. The oil phase was vortexed for 5 min and kept on ice for 30 min. An aqueous phase was prepared containing 1× Phire Hot Start II buffer, 0.2 mM dNTPs, 1.5 μl of Phire II DNA polymerase, 2 μl of the T7 promoter primer, 2 μM of the reverse complement of the Tail2 sequence, and 0.5 mg/ml of BSA in final volume of 75 μl. An emulsion was prepared in a 1.0 ml glass vial by first adding 300 μl of the oil–surfactant mixture into the glass vial, vortexing at 1000 rpm for 5 min, and then adding 10 μl of the aqueous phase every 10 s until the final emulsion volume was 350 μl. The emulsion was transferred into PCR tubes and PCR was performed by denaturing at 98°C for 30 s, cycling with 98°C for 10 s, 55°C for 10 s and 72°C for 30 s for 42 cycles, and extending at 72°C for 5 min. The PCR reaction was purified by adding 100 μl of mineral oil, vortexing, and centrifuging at 13 000 g for 10 min, and then discarding the oil phase. The PCR products were degreased with diethyl ether and ethyl acetate and incubated at 37°C for 5 min. The reaction volume was adjusted with H 2 O to 40 μl and then purified with 72 μl AMPure XP beads (Beckman Coulter), eluting into 20 μl of H 2 O. DNA was transcribed with TranscriptAid T7 High Yield Transcription Kit (K0441), at 37°C for 3 h, treated with DNAse-I for 30 min, and purified with AMPure XP beads with 40% PEG at a 7:3 ratio of beads to PEG. RNA was eluted with 25 μl of H 2 O. 15 pmol of RNA was added into 2 μl of 500 mM Na-HEPES, pH 8.0, denatured at 90°C for 3 min, and cooled down to room temperature for 10 min. 2 μl of 100 mM MgCl 2 was added, and the reaction volume was brought to 15 μl with H 2 O. RNA was incubated at 50°C for 30 min. RNA was cooled down at room temperature for 20 min before being modified with 5 μl of 1M7 (8.48 mg/ml of DMSO) or left untreated for an untreated control sample. The reaction was left room temperature for 15 min, in final volume at 20 μl. The reaction was quenched with 5 μl of 500 mM Na-MES pH 6.0, the volume was adjusted to be 100 μl, and the reaction was purified with ethanol precipitation. Reverse transcription was performed using SuperScript III RTase (Thermo Fisher). RNA was added into a reaction mix of 1× First strand buffer, 5 mM DTT, 0.8 mM dNTPs and 0.6 μl of SS-III RTase (Thermo Fisher), and 1 μl of 0.25 μM primer (RTB000 and RTB001 in Supplementary Table S5 for the no modification and 1M7 samples respectively, with these sequences adding an index sequence and Illumina adapter). The reaction volume was brought to 15 μl. The reaction was incubated at 48°C for 40 min and stopped by adding 5 μl of 0.4 M sodium hydroxide and heating the reaction at 90°C for 3 min, cooling the reaction on ice for 3 min, and neutralizing the reaction with 2 μl of an acid quench mix (2 ml of 5 M sodium chloride, 3 ml of 3 M sodium acetate, 2 ml of 2 M hydrochloric acid). cDNA was purified with Oligo C’ beads. Illumina adapters were ligated using Circ Ligase I (Lucigen) and linker pA-Adapt-Bp ( Supplementary Table S5 ), with ligation at 68°C for 2 h, and the reaction was stopped at 80°C for 10 min. 10 μl of 5 M NaCl cDNA was added, and cDNA was purified with AMPure XP and eluted in 15 μl H 2 O. The ligated product was sequenced on a Miseq for 101 cycles for read 1 and 51 cycles for read 2. Sequencing data were analyzed using the MAPseeker software, freely available for non-commercial use at https://eternagame.org/about/software .
Secondary structure modeling
Chemical reactivity from Manfredonia et al. ( 8 ), Huston et al. ( 6 ) and Sun et al. ( 5 ) are publicly available at http://www.incarnatolab.com/datasets/SARS_Manfredonia_2020.php , http://www.github.com/pylelab/SARS-CoV-2_SHAPE_MaP_structure , and http://rasp.zhanglab.net respectively. DMS reactivity data from Lan et al. ( 3 ) and and SHAPE reactivity data from Iserman et al. ( 7 ) were obtained by request. We modeled RNA secondary structures using RNAstructure ( 28 ) guided by SHAPE or DMS reactivity data using default parameters, through MATLAB wrapper scripts available in the Biers package ( https://github.com/ribokit/Biers ).
FARFAR2 3D modeling
We generated ensembles for SARS-CoV-2 RNA elements using Rosetta's FARFAR2 protocol, providing a collection of models we term the FARFAR2-SARS-CoV-2 dataset. Beginning with a sequence and secondary structure, FARFAR2 generates models through Monte Carlo substitutions of 3-residue fragments sampled from previously solved RNA structures, followed by refinement in a high-resolution physics-based free energy function, which models hydrogen bonding, solvation effects, nucleobase stacking, torsional preferences and other physical forces known to impact macromolecule structure ( 21 ). The models were created using the rna_denovo application in Rosetta 3.12 using default parameters for FARFAR2 ( 21 ). Rosetta is freely available for non-commercial use at https://www.rosettacommons.org . For each system, we generated large model sets using the Stanford high performance computing cluster Sherlock and the Open Science Grid ( 29 ). For systems larger than 50 nucleotides, we clustered the 400 lowest energy structures with a 5 Å RMSD clustering radius, the procedure used for similarly sized systems in our recent FARFAR2 modeling benchmark ( 21 ). (Here and below, RMSD was computed as the all-heavy-atom RMSD between two models, as in all recent Rosetta work on RNA modeling.) For smaller systems, we clustered the 400 lowest energy structures with a 2 Å RMSD clustering radius, analogous to the procedure used for similarly sized systems in the FARFAR2 study. Clustering was achieved via the rna_cluster application used in the FARFAR2 and other Rosetta RNA studies, which iterates through unclustered structures from best to worst energy, either assigning them to an existing cluster (if the all-heavy-atom RMSD of the model is within the clustering radius of the cluster center) or starting a new cluster. We make available up to 50 models from each of the 10 lowest energy clusters in the resulting FARFAR2-SARS-CoV-2 dataset to help efforts in virtual screening that take advantage of ensembles. We note that these models and their frequency in clusters are not necessarily an accurate representation of the thermodynamic ensemble obtained by the RNA due to biases in Rosetta FARFAR2 sampling and inaccuracies in the Rosetta all-atom free energy function. Nevertheless, the models offer a starting point of physically realistic conformations for virtual ligand screening and more sophisticated approaches to thermodynamic ensemble modeling. For each RNA segment, we carried out Rosetta modeling using the secondary structure proposed in the literature ( Supplementary Table S1 ). We additionally considered experimentally derived secondary structures for each RNA region ( Supplementary Table S1 ). We carried out additional Rosetta modeling using each experimentally derived secondary structure if the new secondary structure was substantially different from the original structure proposed in the literature (i.e. if it added or removed stems compared to the literature structure, or if it altered more than three base-pairs in any stem). Each 3D model collection reflects a single secondary structure for each RNA element; for constructs where more than one secondary structure has been proposed or predicted, we generated separate model collections, with the exception of the FSE for which we combined three closely related secondary structures. Homology modeling with FARFAR2 for the 5′ UTR SL2 and the 3′ UTR stem–loop II-like motif (s2m) was carried out using the approach outlined in ref. ( 30 ). For the 5′ UTR SL2, PDB ID 2L6I ( 11 ) was used as a template for positions 45–59. For the 3′ UTR s2m, PDB ID 1XJR ( 12 ) was used as a template for positions 297 28–29 768; here, nucleotide numbering maps to the 3′ UTR secondary structure in Figure 4 .
Quality assessment of models
Simulations that are sufficiently converged produce multiple occupancy clusters, which signal that FARFAR2 sampling is able to discover lowest energy states, as evaluated in Rosetta's all-atom energy function. Runs with only single occupancy clusters would need more computer power to discover lowest energy states. In Table 1 , we report the ‘E-gap’: the difference in Rosetta energy units (REU) for the best-scoring model in each cluster compared to the top-scoring model in the simulation overall. Rosetta energy functions have been fit such that REU estimate energies in kcal/mol ( 31 ), so E-gap values similar to or smaller than 4.0 indicate structures that are predicted to make up a significant fraction of the ground state ensemble and that may be trapped by small molecule drugs without a major cost in binding affinity. Table 1. FARFAR2-SARS-CoV-2 models System Length Models generated Model convergence (Å) a Predicted minimum RMSD (Å) b Percent of clusters with < 8.0 REU E-gap to lowest energy model c Percent of clusters showing multiple occupancy d 5′ UTR constructs 5′ UTR (1–480) 480 66011 50.9 44.92 ± 6.13 20% 0% 5′ UTR stem–loop 1 (7–33) 27 200000 1.83 5.17 ± 0.52 100% 100% 5′ UTR stem–loop 2 (45–59) 15 200000 2.39 5.63 ± 0.74 100% 100% 5′ UTR stem–loop 3 (61–75) 15 200000 2.58 5.78 ± 0.70 100% 100% 5′ UTR stem–loop 4 (84–127) 44 2018457 1.82 5.16 ± 0.49 100% 80% 5′ UTR stem–loop 5 (148–295) 148 2392320 18.99 19.07 ± 6.15 100% 10% 5′ UTR stem–loop 5/6 (148–343) 196 2020963 25.91 24.68 ± 6.27 50% 10% 5′ UTR stem–loop 6 (302–343) 42 200000 8.92 10.92 ± 2.21 100% 100% 5′ UTR stem–loop 7 (349–394) 27 200000 7.39 9.67 ± 1.90 20% 100% 5′ UTR stem–loop 8 (407–478) 72 4055322 6.86 9.24 ± 1.47 70% 100% 5′ UTR reverse complement 5′ UTR reverse complement stem–loops 1–4 (149–1) 149 2031710 19.61 19.57 ± 4.37 90% 0% Frameshift stimulating element constructs Frameshift stimulating element (13459–13546) 88 390722 14.45 15.39 ± 3.09 80% 80% Suspected frameshift stimulating element dimer (13459–13546) 176 23066 21.99 21.50 ± 4.08 30% 0% 3′ UTR constructs 3′ UTR beginning with bulged hairpin (29511–29871) 361 11430 39.71 35.85 ± 5.51 20% 0% 3′ UTR hypervariable region (29659–29852) 194 28029 25.38 24.25 ± 4.18 80% 0% 3′ UTR pseudoknot (29543–29665; 29846–29876) 158 1017205 21.93 21.45 ± 5.52 100% 0% 3′ UTR pseudoknot fragment consisting of the pseudoknot (PK), P2, and P6 (29606–29665; 29846–29876) 95 1017205 10.24 11.99 ± 2.05 100% 50% 3′ UTR BSL extended structure (29543–29665; 29846–29876) 158 1012716 24.04 23.16 ± 4.29 100% 0% 3′ UTR stem–loop II-like motif, homology modeled from PDB ID: 1XJR (12) (29724–29773) 50 200000 6.95 9.32 ± 0.09 50% 100% 3′ UTR stem–loop II-like motif, secondary structure based on NMR data from Wacker et al. (38) (29724–29773) 50 500000 2.97 6.10 ± 0.75 100% 10% a Mean pairwise all-heavy-atom RMSD between 10 lowest energy cluster centers discovered. b Predicted RMSD to true structure. c Rosetta all-atom free energy gap of cluster's lowest energy model compared to lowest energy model discovered in run. REU = Rosetta energy units, calibrated so that 1.0 corresponds approximately to 1 k B T. d Percent of clusters with more than one cluster member. Clustering was carried out on top 400 models ranked by Rosetta all-atom free energy, based on 5.0 Å threshold, except for small RNAs (SL1–4, SL6–7, s2m), where 2.0 Å threshold was applied. For each simulation, we additionally report a ‘convergence’ estimate in Table 1 , estimated as the mean pairwise RMSD of the top 10 cluster centers predicted by FARFAR2. Prior work aiming at accurate prediction of single native crystal structures has demonstrated that convergence is a predictor for modeling accuracy ( 21 , 32 , 33 ), with prior tests suggesting that models that have 7.5 Å convergence or lower have mean single-structure prediction accuracy of at worst 10 Å, and models with 5 Å convergence or lower have single-structure prediction accuracy of at worst 8 Å ( 21 ). In this work, we are however not assuming that the RNA targets form a single ‘native’ structure. Instead, we take this convergence measure as a proxy for whether sampling may have been adequate to generate a useful model set. As a direct measure of the thoroughness of sampling, we also present the ‘occupancies’ of each of the top 10 clusters. Conformations sampled repeatedly in independent Rosetta-FARFAR2 runs (cluster membership greater than 1) indicate some level of convergence in sampling and those conformations are more likely to be realistic low-energy structures. In Figures 1 – 4 , we show cluster members as a cloud of translucent structures behind each cluster's lowest energy conformation to visually convey the level of convergence; lack of such a cloud indicates a ‘singlet’ in which the cluster involves only one member. We include up to 50 representative top-scoring models in each cluster as the model collection for each RNA element, with structures available in the Github repository: https://github.com/DasLab/FARFAR2-SARS-CoV-2 . Large model sets with the top 5% of models for each simulation are included at the PURL repository: https://purl.stanford.edu/pp620tj8748 . Figure 1. 5′ UTR chemical reactivity, secondary structure, and 3D models. ( A ) The heatmap compares chemical reactivity from recent publications probing SARS-CoV-2 RNA ( 3 , 5–8 , 16 ) along with reactivity data collected in this work (Das lab SL1–4 and Das lab SL2–6, and Eterna constructs 1–5). Gray values indicate no data, and reactivity increases from white to orange. The conservation track indicates the conservation percentage for each nucleotide across SARS-related species from white (0% conserved) to black (100% conserved.) The secondary structure track is white in paired regions and orange in unpaired regions, following the secondary structure in panel B. Domains are indicated with coloring as follows: SL1 (red), SL2 (orange), SL3 (yellow), SL4 (light green), linker between SL4–SL5 (dark green), SL5 (blue), SL6 (purple), SL7 (light purple) and SL8 (brown). ( B ) In bold are positions that are completely conserved across a set of SARS-related virus sequences . Base pairs that are not identified by the integrated DMS mapping and NMR analysis of Wacker et al. ( 39 ) are shown in grey. Base pairs found to have significant co-variance across coronaviruses in Mafredonia et al. ( 8 ) ( E -value less than 0.05) are highlighted in green. Positions are colored according to their chemical reactivity in Manfredonia et al. ( 8 ) Regions are boxed according to their coloring in 3D models. Top 4 clusters are depicted for SL1, SL2, SL3, SL4, SL5, SL6, SL7 and SL8. For SL2, a cluster derived from homology modeling to NMR structure 2L6I ( 11 ) is depicted, and the cluster with lowest RMSD from this NMR-derived structure is indicated. The top-scoring cluster member in each case is depicted with solid colors, and the top cluster members (up to 10) are depicted as transparent structures. Figure 2. Chemical reactivity, secondary structure and 3D models for the reverse complement of the 5′ UTR SL1–4. ( A ) The heatmap depicts SHAPE reactivity from this work probing the reverse complement of the 5′ UTR SL1–4. Reactivity increases from white to orange. The conservation track indicates the conservation percentage for each nucleotide across SARS-related species from white (0% conserved) to black (100% conserved). The secondary structure track is white in paired regions and orange in unpaired regions, using the secondary structure as predicted by RNAstructure guided by SHAPE data. Domains are indicated with colored boxes. ( B ) The secondary structure for the reverse complement of the 5′ UTR SL1–4 is depicted as used for FARFAR2 modeling. In bold are positions that are completely conserved across a set of SARS-related virus sequences . Positions are colored according to their chemical reactivity shown in panel A). Regions are boxed according to their coloring in 3D models. 3D models for 10 clusters (all single-occupancy) are depicted. Figure 3. Frameshift stimulating element (FSE) chemical reactivity, secondary structure, and 3D models. ( A ) The heatmap compares chemical reactivity from recent publications probing SARS-CoV-2 RNA ( 3 , 5–8 , 13 ), along with reactivity data collected in this work for a region within the FSE (Eterna construct 6). Gray values indicate no data, and reactivity increases from white to orange. The conservation track indicates the conservation percentage for each nucleotide across SARS-related species , from white (0% conserved) to black (100% conserved.) The secondary structure track is white in paired regions and orange in unpaired regions, using the secondary structure for the extended FSE as predicted by RNAstructure guided SHAPE data ( 13 ). Domains are indicated with colored boxes as follows: Stem 1 (red), Stem 2 (orange), Stem 3 (yellow) and the dimerization loop (green). ( B ) Frameshift stimulating element secondary structure, depicting alternate secondary structures used for FARFAR2 modeling. In bold are positions that are completely conserved across a set of SARS-related virus sequences. Base pairs that are not identified by the integrated DMS mapping and NMR analysis of Wacker et al. ( 39 ) are shown in grey. Positions are colored according to their chemical reactivity when the 88-nt segment shown here was probed with SHAPE reagents ( 13 ). Regions are boxed according to their coloring in 3D models. 3D models for 10 frameshift stimulating element clusters are depicted. The top-scoring cluster member in each case is depicted with solid colors, and the top cluster members (up to 10) are depicted as transparent structures. The structure of the FSE as determined by cryo-EM in Zhang et al. ( 13 ) is depicted, and the cluster center with lowest RMSD (9.9 Å) to this structure is indicated. Supplementary Figure S4 includes an alternate secondary structure and 3D models for the extended FSE including Alternate Stem 1. Figure 4. 3′ UTR chemical reactivity, secondary structure, and 3D models. ( A ) The heatmap compares chemical reactivity from recent publications probing SARS-CoV-2 RNA ( 3 , 5 , 6 , 8 , 16 ) along with reactivity data collected in this work. Gray values indicate no data, and reactivity increases from white to orange. The conservation track indicates the conservation percentage for each nucleotide across SARS-related species from white (0% conserved) to black (100% conserved.) The secondary structure track is white in paired regions and orange in unpaired regions. Domains are indicated with colored boxes matching their coloring in 3D models. ( B ) Positions are colored according to their chemical reactivity in Manfredonia et al. ( 8 ) Regions are boxed according to their coloring in 3D models. In bold are positions that are completely conserved across a set of SARS-related virus sequences. Base pairs that are not identified by the integrated DMS mapping and NMR analysis of Wacker et al. ( 39 ) are shown in grey. Base pairs found to have significant co-variance across coronaviruses in Mafredonia et al. ( 8 ) ( E -value less than 0.05) are highlighted in green. 3D models are shown for the top 4 clusters for a segment containing the 3′ UTR pseudoknot, P2 and P5. 3D models are also shown for the top 4 clusters for the stem–loop II-like motif with models based on the NMR-derived secondary structure ( 39 ), and the top 2 clusters for the stem–loop II-like motif, with models built based on homology to template structure 1XJR ( 12 ). The top-scoring cluster member in each case is depicted with solid colors, and the top cluster members (up to 10) are depicted as transparent structures. To guide the development of virtual screening approaches using the SARS-CoV-2 FARFAR2 models, we additionally compiled similarly prepared representative models for ten small-molecule binding RNA aptamers using previously generated decoy sets ( 21 ). This dataset, which we term the FARFAR2-Apo-Riboswitch dataset, has structures available in the Github repository: https://github.com/DasLab/FARFAR2-Apo-Riboswitch . Identifying 3D motifs For the 5′ UTR, reverse complement of the 5′ UTR, frameshift stimulating element, and the 3′ UTR, we searched for matches to 3D RNA motifs from previously solved RNA structures using JAR3D ( 34 ). In particular, for every internal loop and terminal loop containing 3–8 nucleotides in these regions, we searched for a match with the motifs in Motif Atlas version 3.2 ( 35 ) using the online JAR3D server. We identified hits with an exact sequence match to a loop of a known structure, or for cases with loop sizes greater than four, at most 1 loop residue substitution from a known structure. We excluded cases where proteins were present within 10 Å of the structure containing the loop motif. For each hit, we used the rna_denovo application to combine the loop region from the identified structure with the coordinates for the remaining nucleotides that had been obtained from the top-scoring FARFAR2 structure. These models including loop motifs from JAR3D are available in the Github repository: https://github.com/DasLab/FARFAR2-SARS-CoV-2 . Predicting binding pockets We identified candidate small-molecule binding pockets in the RNA constructs from the FARFAR2-SARS-CoV-2 dataset, running fpocket ( 36 ) with default settings on each model set. To evaluate binding pockets predicted by fpocket, we additionally evaluated fpocket on each small-molecule binding aptamer in the FARFAR2-Apo-Riboswitch dataset. For each of these riboswitch aptamers, we ran pocket prediction on the native structure with the ligand removed, on the FARFAR2 models in the FARFAR2-Apo-Riboswitch dataset, and on the near-native models for each case that were generated using FARFAR2 with coordinates constrained to the native structure as described previously ( 21 ). Match between pockets predicted by fpocket and the native binding pocket was computed by enumerating the residues in the binding pocket (all residues with at least two atoms within 4 Å of the ligand), and computing the percent of native binding pocket residues included in the predicted pocket.
Convergence of experimentally derived secondary structures across groups RNA secondary structures are required to seed RNA 3D modeling. After our original modeling ( 37 ), several additional studies have been reported that constrain secondary structures through experimentally determined chemical reactivities of RNA segments in vitro or in cells ( 3 , 5–8 , 13 , 16 ). We made use of all currently published reactivity data along with data collected in our lab and on the Eterna project's ‘cloud laboratory’ pipeline to refine and update secondary structure models ( Supplementary Table S1 ; experimental methods described in Methods). The SHAPE and DMS reactivity profiles for the 5′ UTR and beginning of the SARS-CoV-2 coding region, FSE and 3′ UTR collected by different research groups across in vitro and in vivo probing conditions showed remarkable consistency across datasets (Figures 1A , 3A and 4A ), supporting consistency seen across datasets in the 5′ UTR in a recent review ( 38 ). In addition, data from 60-nt constructs proposed in the Eterna Roll Your Own Structure lab largely supported reactivity in the 5′ UTR and 3′ UTR, with most differences from the genome-wide probing data appearing at the constructs’ ends due to base-pairing changes at the boundaries of the shorter probed windows, for instance at the 3′ end of Eterna Construct 4 or 5′ end of Eterna Construct 5 (Figure 1A ). The experimentally derived secondary structures were therefore similar across datasets ( Supplementary Table S1 ), with some exceptions including an extended region around the FSE and the hypervariable region of the 3′ UTR, noted below. In addition to the growing wealth of chemical mapping data, recent NMR experiments integrated with DMS mapping determined the secondary structure for stem–loops in the 5′ UTR, the FSE, and regions of the 3′ UTR, largely confirming the secondary structures derived from chemical mapping experiments ( 39 ). In the 5′ UTR, these data support nearly all base pairs proposed previously in the literature, showing agreement with SHAPE and DMS reactivity experiments from recent studies. Additionally, the NMR data support the base pairs in the pseudoknot conformation for the FSE and the extended bulged stem–loop (BSL) conformation for the 3′ UTR pseudoknot, again agreeing with previously proposed structures. In these regions, the base pairs that are not seen in the NMR data are primarily terminal base pairs and are depicted in grey in the secondary structure diagrams in this manuscript. Notably, the SARS-CoV-2 s2m secondary structure determined by NMR differs from the secondary structure derived from homology modeling to the SARS-CoV-1 s2m crystal structure ( 1 , 12 , 39 ), providing a distinct secondary structure for Rosetta modeling ( Supplementary Table S1 ). The experimentally derived secondary structures and resulting 3D models are described in more detail for each probed segment below.
Models of riboswitch aptamers as a benchmark for virtual drug screening methods Use of the above SARS-CoV-2 RNA 3D models for virtual screening would be aided by a benchmark of analogous de novo models of RNA’s that are known to bind small molecules. Recent RNA-puzzles blind prediction trials have shown that FARFAR2 models in combination with conservation information enable manual identification of ligand binding sites in 3D models of bacterial ‘riboswitch’ aptamers ( 22–24 ). To guide use of FARFAR2 models for virtual screening, we have therefore compiled the FARFAR2-Apo-Riboswitch dataset, containing models of RNA elements that are known to bind small molecules, depicted in Supplementary Figure S7 . These targets include binders for diverse ligands, including S -adenosyl methionine (SAM), glycine, cobalamin, 5-hydroxytryptophan, the cyclic dinucleotides c-di-AMP (the ydaO riboswitch), the alarmone nucleotide ZMP (AICAR monophosphate), glutamine and guanidinium. Each RNA was modeled without ligands present during fragment assembly or refinement, to mimic the protocols that would be used in virtual drug screening, in which modeling of apo RNA structures are used for computational docking of ligands. Three of these model sets for SAM-I, SAM-I/IV and SAM-IV made use of homology to previous riboswitch structures’ ligand binding sites (Homology, Supplementary Figure S7A-C ), for historical reasons: the actual RNA-Puzzles challenges (or in the case of SAM-IV, an ‘unknown RFAM’ challenge for the RNA-Puzzles, involving tests based on cryoEM ( 57 )) were posed at times in which crystal structures of riboswitch aptamers with homologous SAM binding sites were available. These model sets therefore serve as ‘positive controls’ for virtual drug screening protocols, which should be able to unambiguously identify homology-guided SAM binding sites as good aptamers for SAM. The modeling also included riboswitch aptamer cases ( de novo , Supplementary Figure S7D-J ) in which the ligand binding sites were not modeled by homology, in closer analogy to virtual screening approaches that might make use of the FARFAR2-SARS-CoV-2 models. These models include cases such as the ydaO riboswitch, where modeling did not achieve a model closer than 10.0 Å RMSD to the RNA crystallized with two cyclic-diAMP ligands, perhaps owing to the large ligand and the substantial degree to which contacts with that ligand may organize the crystallized conformation. It will be interesting to see if these models still allow recognition of small molecule binding sites by computational methods. For the RNA riboswitches and aptamers in the FARFAR2-Apo-Riboswitch dataset, we used fpocket to predict candidate binding pockets for small-molecules, making pocket predictions for all FARFAR2 cluster centers just as we did for SARS-CoV-2 RNA elements. In addition, to assess the accuracy of fpocket predictions, pocket predictions were made for the native structure without ligand present and for near-native models sampled with FARFAR2 using constraints to the native structure. In 9 of the 10 cases, when candidate pockets were identified using FARFAR2 models for these riboswitches, at least one pocket was predicted that contained at least 40% of native structure's binding site residues ( Supplementary Figure S8 , blue). Near-native models yielded pocket predictions with more residues from the native binding pocket, and native structures with ligand removed tended to yield the most native-like binding pocket predictions ( Supplementary Figure S8 , orange and red). Nevertheless, we note that in all cases, most of the predicted pockets were distinct from the native binding pocket, and we found that we were not able to consistently distinguish native pockets from other pockets using physical attributes measured by fpocket. We provide in Supplementary Table S4 additional metrics for the model sets in the FARFAR2-Apo-Riboswitch dataset, including the same RMSD convergence estimates, cluster occupancy and E-gap numbers as for our FARFAR2-SARS-CoV-2 models as well as RMSD to experimentally determined ligand-bound structures. If these metrics correlate with the ability of virtual screening methods to discover known native ligands for these RNA elements, they will be useful in evaluating the likelihood of success of such methods in discovering molecules for the FARFAR2-SARS-CoV-2 models.
Supplementary Material gkab119_Supplemental_File Click here for additional data file.
📊 Figures
Graphical Abstract
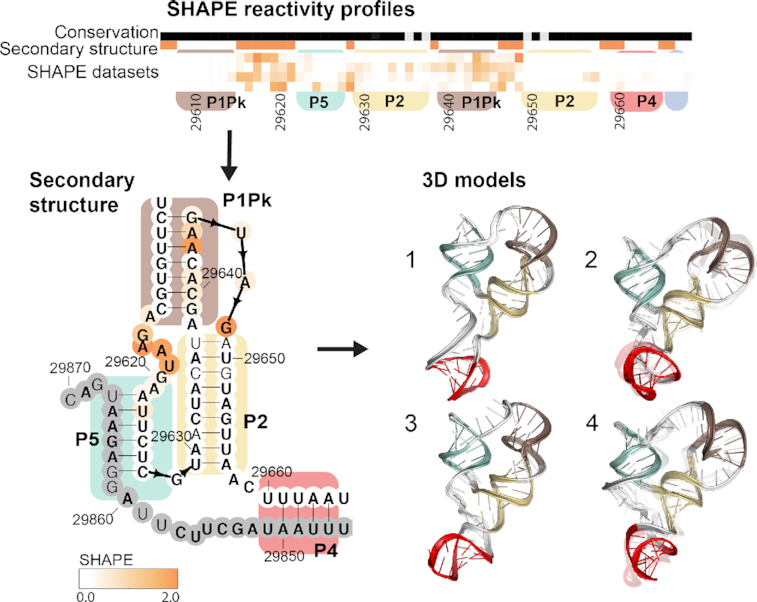
De novo 3D models of SARS-CoV-2 RNA elements and small-molecule-binding RNAs to aid drug discovery.
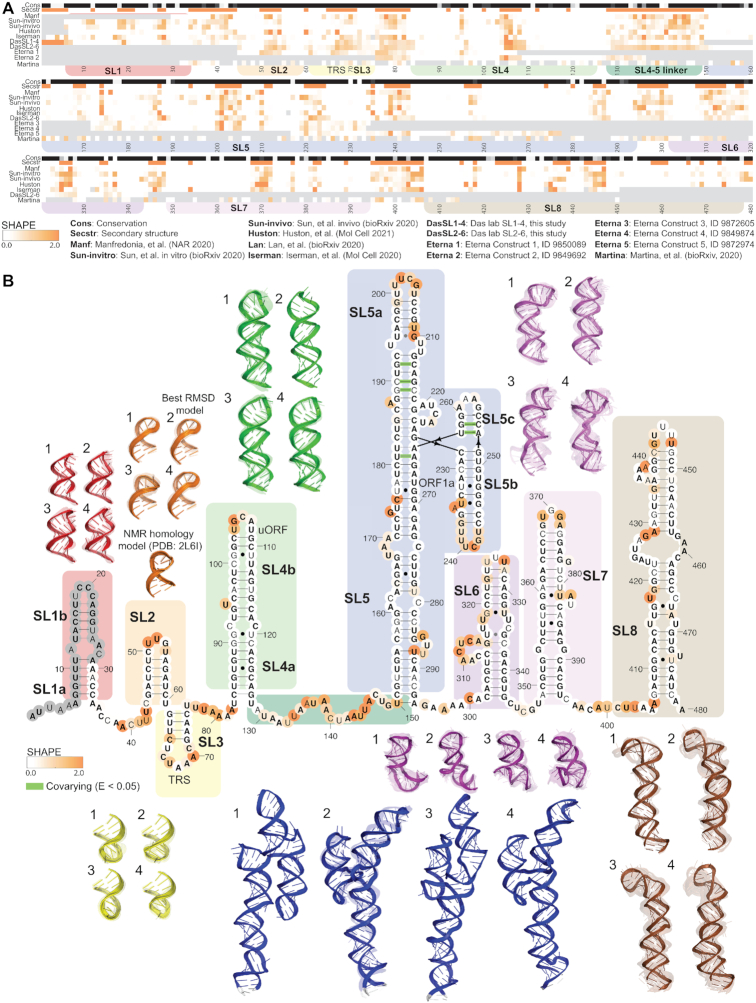
Figure 1.
5u2032 UTR chemical reactivity, secondary structure, and 3D models. ( A ) The heatmap compares chemical reactivity from recent publications probing SARS-CoV-2 RNA ( 3 , 5u20138 , 16 ) along with react...
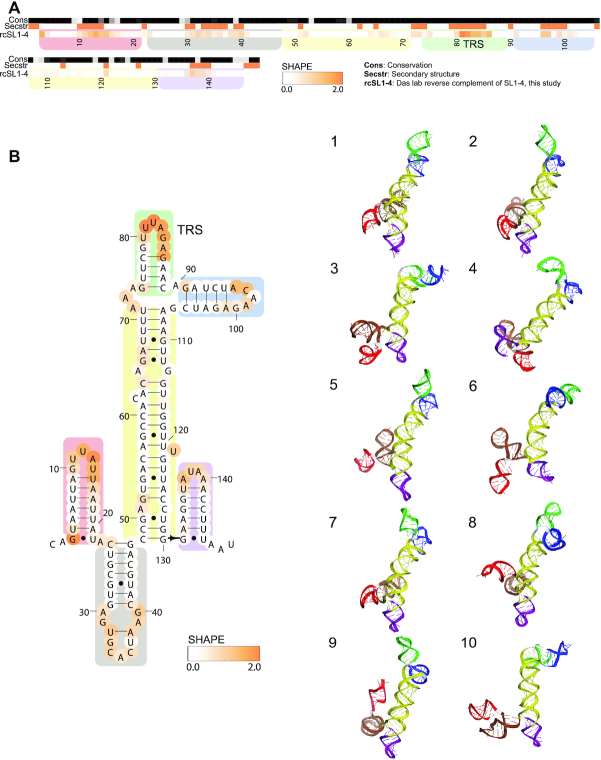
Figure 2.
Chemical reactivity, secondary structure and 3D models for the reverse complement of the 5u2032 UTR SL1u20134. ( A ) The heatmap depicts SHAPE reactivity from this work probing the reverse complement ...
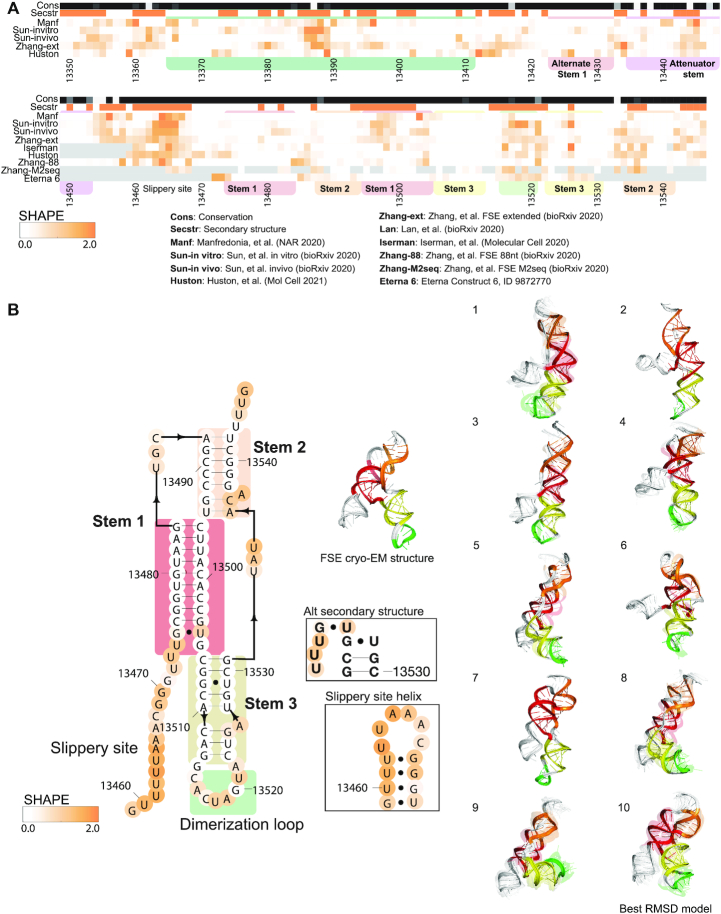
Figure 3.
Frameshift stimulating element (FSE) chemical reactivity, secondary structure, and 3D models. ( A ) The heatmap compares chemical reactivity from recent publications probing SARS-CoV-2 RNA ( 3 , 5u201...
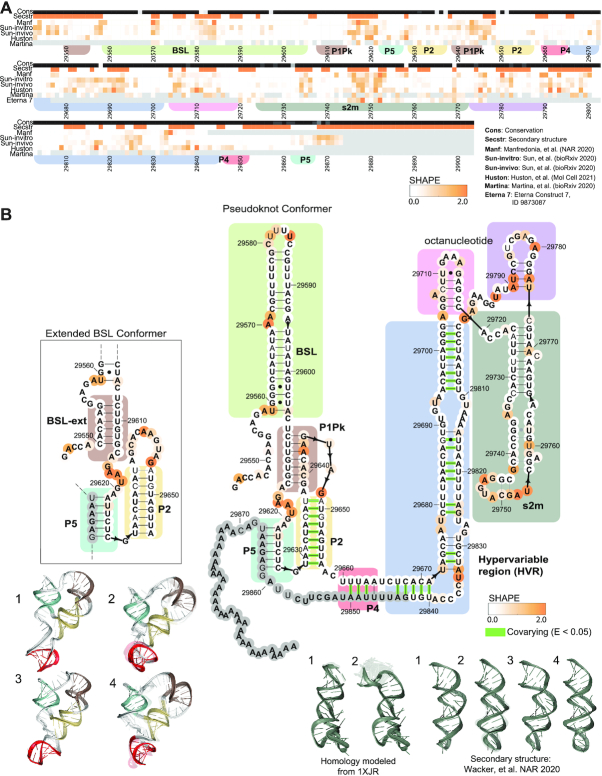
Figure 4.
3u2032 UTR chemical reactivity, secondary structure, and 3D models. ( A ) The heatmap compares chemical reactivity from recent publications probing SARS-CoV-2 RNAu00a0( 3 , 5 , 6 , 8 , 16 ) along with...
Figure images are served from the NIH/NLM PubMed Central Open Access Subset or Europe PMC; copyright remains with the publishers and authors.
💬 Discussion
0 commentsNo comments yet. Be the first to start a discussion!
Leave a Comment