Abstract
AbstractNitric oxide ("Equation missing") is a free radical with a wide range of biological effects, but practically impossible to visualize in single cells. Here we report the development of novel multicoloured fluorescent quenching-based "Equation missing"probes by fusing a bacteria-derived "Equation missing"-binding domain close to distinct fluorescent protein variants. These genetically encoded "Equation missing"probes, referred to as geNOps, provide a selective, specific and real-time read-out of cellular "Equation missing"dynamics and, hence, open a new era of "Equation missing"bioimaging. The combination of geNOps with a Ca2+sensor allowed us to visualize "Equation missing"and Ca2+signals simultaneously in single endothelial cells. Moreover, targeting of the "Equation missing"probes was used to detect "Equation missing"signals within mitochondria. The geNOps are useful new tools to further investigate and understand the complex patterns of "Equation missing"signalling on the single (sub)cellular level.
🔬 Techniques
🧬 Organisms
✨ Fluorophores
🧪 Sample Preparation
🔬 Cell Lines
🏭 Microscope Brands
🧪 Reagent Suppliers
💻 Software Details
🏛️ Research Organizations (ROR)
Affiliated research institutions:
📋 Methods
Cloning of geNOps Briefly, cloning was performed according to standard procedures and all products were verified by sequencing. Genomic DNA of E. Coli DH10α was isolated by a DNA extraction protocol using phenol/chloroform extraction followed by ethanol precipitation and subsequent solubilization in 30 μl deionized water. The bacterial DNA was used as a template to isolate the GAF subunit of the NorR transcription factor in a PCR with the following primers: forward 5′-GGCATCGATATGAGTTTTTCCGTTGATGTGC-3′ that adds a ClaI restriction site and reverse 5′-GGCAAGCTTAAGGGGACAAGCCAATCATCT-3′ including a stop codon and a HindIII site. To obtain various single FP-based geNOps, the PCR product of the GAF domain was C terminally fused to a super ECFP, a blue-green emitting FP (GEM) 20 , an EGFP, a circularly permuted Venus or a mKO k via ClaI and HindIII in a mammalian expression vector pcDNA3.1(-) (Invitrogen, Austria). To construct the -insensitive probes (C-geNOp mut and G-geNOp mut ), the two argingines at positions 75 and 81 of the GAF domain were mutated by a two-step PCR protocol using two additional primers forward 5′-AGCGCTGGAAGCGATTGCCGCCG-3′ and reverse 5′-CCGGCGGCGGCAATCGCTTCCAGCGCT-3′. For targeting geNOps into mitochondria, two COX VIII mitochondria-targeting sequences were added to the N terminus of respective constructs. To target C-geNOp to the outer surface of the plasma membrane, a membrane leading sequence of the human cadherin 13 (24 amino acids) was added to the N terminus and the GPI-anchor sequence of cadherin 13 (coding for 26 amino acids) were fused to the C terminus of C-geNOp, respectively.
Show full methods section
Cloning of geNOps Briefly, cloning was performed according to standard procedures and all products were verified by sequencing. Genomic DNA of E. Coli DH10α was isolated by a DNA extraction protocol using phenol/chloroform extraction followed by ethanol precipitation and subsequent solubilization in 30 μl deionized water. The bacterial DNA was used as a template to isolate the GAF subunit of the NorR transcription factor in a PCR with the following primers: forward 5′-GGCATCGATATGAGTTTTTCCGTTGATGTGC-3′ that adds a ClaI restriction site and reverse 5′-GGCAAGCTTAAGGGGACAAGCCAATCATCT-3′ including a stop codon and a HindIII site. To obtain various single FP-based geNOps, the PCR product of the GAF domain was C terminally fused to a super ECFP, a blue-green emitting FP (GEM) 20 , an EGFP, a circularly permuted Venus or a mKO k via ClaI and HindIII in a mammalian expression vector pcDNA3.1(-) (Invitrogen, Austria). To construct the -insensitive probes (C-geNOp mut and G-geNOp mut ), the two argingines at positions 75 and 81 of the GAF domain were mutated by a two-step PCR protocol using two additional primers forward 5′-AGCGCTGGAAGCGATTGCCGCCG-3′ and reverse 5′-CCGGCGGCGGCAATCGCTTCCAGCGCT-3′. For targeting geNOps into mitochondria, two COX VIII mitochondria-targeting sequences were added to the N terminus of respective constructs. To target C-geNOp to the outer surface of the plasma membrane, a membrane leading sequence of the human cadherin 13 (24 amino acids) was added to the N terminus and the GPI-anchor sequence of cadherin 13 (coding for 26 amino acids) were fused to the C terminus of C-geNOp, respectively.
Chemicals and buffer solutions
Cell culture materials were obtained from PAA laboratories (Pasching, Austria). Histamine hydrochloride, Iron(II)fumarate, 2,5-Di-t-butyl-1,4-benzohydroquinone, ethylene glycol tetraacetic acid (EGTA), Tris-HCl, monensin, nigericin, CORM-3, L-NAME and potassium superoxide were purchased from Sigma Aldrich (Vienna, Austria). NOC-7 and PROLI NONOate were from Santa Cruz (San Diego, USA). ATP was obtained from Roth (Graz, Austria). Peroxynitrite was from Cayman Chemical (Michigan, USA). SNP was purchased from Gatt-Koller (Absam, Austria). Ionomycin was obtained from Abcam (Cambridge, UK). Before the experiments, cells were washed and maintained for 20 min in a HEPES-buffered solution (storage buffer) containing 138 mM NaCl, 5 mM KCl, 2 mM CaCl 2 , 1 mM MgCl 2 , 1 mM HEPES, 2.6 mM NaHCO 3 , 0.44 mM KH 2 PO 4 , 0.34 mM Na 2 HPO 4 , 10 mM D -glucose, 0.1% vitamins, 0.2% essential amino acids and 1% penicillin–streptomycin, the pH was adjusted to 7.4 with NaOH. During the experiments, cells were perfused in a physiological Ca 2+ -containing buffer (Ca 2+ buffer), which consisted of 140 mM NaCl, 5 mM KCl, 2 mM CaCl 2 , 1 mM MgCl 2 , 10 mM D -glucose and 1 mM HEPES, the pH was adjusted to 7.4 with NaOH. For Ca 2+ -free experiments 1 mM EGTA was added to the perfusion buffer instead of 2 mM Ca 2+ . Preparation of iron(II) fumarate solution was performed in the Ca 2+ buffer by adding 1 mM iron(II) fumarate and 1 mM ascorbic acid and stirring at room temperature in the dark. During the experiments, various NO donors or other pharmacological compounds were applied to the cells using a gravity-based perfusion system connected with a conventional vacuum pump (Chemistry diaphragm pump ME 1C, Vacuubrand, Wertheim, Germany).
Measurement of release using a poryphyrinic nanosensor
For estimation of concentrations, release of from S-NO-HSA dissolved in physiological saline was measured with a poryphyrinic nanosensor in a tissue culture bath at identical concentrations as used for geNOp signal imaging. The nanosensor was operated in a three-electrode system, consisting of the sensor working electrode, a platinum wire (0.1 mm) counter electrode, and a standard calomel reference electrode. The current proportional to concentration was measured by the nanosensor operated in an amperometric mode at a constant potential of 0.65 V. The response time of the nanosensors was 0.1 ms. The nanosensor was calibrated for the range 1 μmol·L −1 using aliquots of a standard-saturated aqueous solution (1.76 mmol l −1 ). The amperometric signals for NO were recorded with a computer-based Gamry VF600 voltametric analyser. Equation for [ ] cyto from respective changes in fluorescence intensities of C-geNOps (Δ F ) was obtained by plotting the respective concentrations (obtained with the poryphyrinic nanosensor) against Δ F Intensity values and fitting the data with a saturation kinetic: where K is the concentration of S-NO-HSA at half maximal response (4.50) and Δ F max is the maximal geNOp response (19.16). Cell culture, transfection and fura-2/AM loading HeLa cells were grown in DMEM (Sigma Aldrich) containing 10% fetal bovine serum, 100 U ml −1 penicillin and 100 μg ml −1 streptomycin. Culture medium of EA.hy926 cells contained additionally 1% HAT (5 mM hypoxanthin, 20 μM aminopterin and 0.8 mM thymidine). Human glioblastoma U87-MG cells were cultured in DMEM supplemented with 10% fetal bovine serum, 4 mM glutamine, 50 U ml −1 penicillin and 50 mg ml −1 streptomycin. At 60–80% confluence, cells in 30-mm imaging dishes were transfected with 1 ml of serum- and antibiotic-free medium that had been mixed with 1.5 μg of the approprioate plasmid DNA and 3 μg of TransFast transfection reagent (Promega). Cells were maintained in a humidified incubator (37 °C, 5% CO 2 , 95% air) for 16–20 h before changing back to the respective culture medium. All experiments were performed either 24 or 48 h after transfection. For dual recordings using fura-2, cells were incubated in storage buffer containing 3.3 μM fura-2/AM for 40 min. Before the experiments, cells were incubated 10 min in the iron(II) fumarate solution. Culturing embryonic chicken ventricular cardiomyocytes Ventricular myocytes were isolated from embryonic chick hearts. The hearts of 7-day embryos were removed, and the ventricles were chopped off, minced and transferred to a nominally Ca 2+ - and Mg 2+ -free Hanks' balanced salt solution (HBSS; in mM: 137 NaCl, 5.4 KCl, 0.34 Na 2 HPO 4 , 0.44 KH 2 PO 4 , 4.2 NaHCO 3 and 5 glucose, pH 7.4) containing 0.25% trypsin (bovine pancreas, Sigma-Aldrich). The suspension was transferred to a shaker bath at 37 °C for 7 min, afterwards cells were released with mechanical disruption (pipetting) and filtered through a 100-μm mesh. HBSS, supplemented with fetal calf serum (5% final concentration), was added to stop trypsin activity. The cell suspension was centrifuged at 100 g for 5 min at 4 °C, the supernatant was discarded and the cell pellet was resuspended in fresh trypsin-free HBSS. The centrifugation and resuspension processes were then repeated. After the third time cells were resuspended in M199 cell culture medium (Sigma-Aldrich, supplemented with 4% fetal calf serum, 2% horse serum and 0.7 mM glutamine, pH 7.4) to yield a density of 3.5 × 10 5 cells per ml.
Live-cell imaging of concentrations with geNOps
Measurements were performed on two different wide-field imaging systems: an inverted and advanced fluorescent microscope with a motorized sample stage (Till Photonics, Graefling, Germany) was used. The probes were excited via a polychrome V (Till Photonics), and emission was visualized using a × 40 objective (alpha Plan Fluar 40 ×, Zeiss, Göttingen, Germany), and a charge-coupled device camera (AVT Stringray F145B, Allied Vision Technologies, Stadtroda, Germany). C-geNOp and M-geNOp were excited at 430 nm, G-geNOp and Y-geNOp at 480 nm, and O-geNOp at 515 nm. Emitted light was collected with emission filters CFP emitter 482/18 nm, yellow fluorescent protein emitter 514/3 nm or orange fluorescent protein-emitting filter (560dcxr), respectively. In addition, for simultaneous measurements of cytosolic Ca 2+ , Fura-2 was alternately excited at 340 and 380 nm, and emissions were captured at 515 nm (515dcxr). For control and acquisition, the Live acquisition 2.0.0.12 software (Till Photonics) was used. Alternatively, geNOps were visualized on a Nikon eclipse TE300 inverted microscope (Tokyo, Japan) using a × 40 objective (Plan Fluor, Nikon, Vienna or Fluor, Zeiss, Jena, Germany) and fluorescence was recorded with a Spot pursuit charge-coupled device camera (Visitron Systems, Puchheim, Germany). Fura-2 and geNOps were excited as described above, and emissions were collected using emission filter 510WB40 or XF56 (Omega Opticals, Brattleboro, VT, USA). Data acquisition and control were done using the VisiView Premier Acquisition software (Visitron Systems).
Characterization of the pH sensitivity of geNOps
To characterize the pH sensitivity, HeLa cells expressing C-geNOp were treated using a series of buffers with various pH values ranging from 5 to 9. Cells were prepared with 10 μM nigericin and 10 μM monensin, and 20 mM MES (for pH 5–6.5), 20 mM HEPES (for pH 7–7.5) or 20 mM Tris-HCl (for pH 8–9) containing buffer. Cells were additionally stimulated with 10 μM NOC-7 at respective pH values.
Construction of structural models of geNOps
Models of all geNOps were constructed with the online tool Phyre2 (Protein Homology/analogy Recognition Engine V 2.0). Analyses of the predicted proteins were performed with the software DeepView/Swiss Pdb viewer V4.1.0 observed from ExPASy.
Cell velocity measurements
Centre of mass was determined for cells over the whole stack after binearization with an Otzu auto threshold in ImageJ. To determine the cell velocity between consecutive positions, following equation was used: ( x ) and ( y ) are the localization coordinates of the centre of mass at consecutive time points ( t 1 ) and ( t 2 ).
Statistical analysis
Statistical analysis was performed using the GraphPad Prism software version 5.04 (GraphPad Software, San Diego, CA, USA). Analysis of variance and t -test were used for evaluation of the statistical significance. P
📊 Figures
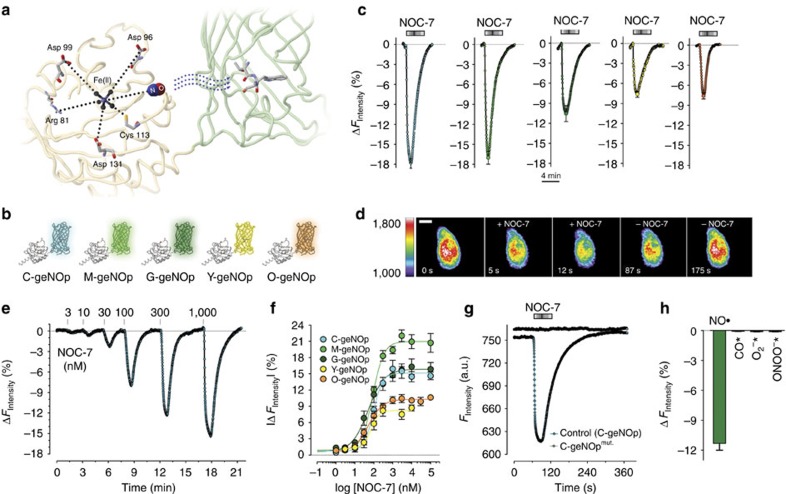
Figure 1
Fusion of the bacterial -binding GAF domain to fluorescent proteins, resulting in differently coloured fluorescent quenching-based probes, the geNOps.
( a ) Predicted three-dimensional structure of geNOps. ( b ) Schematic overview of differently coloured geNOps. ( c ) Average curves (meanu00b1s.e.m.) over time of normalized delta fluorescence signal...
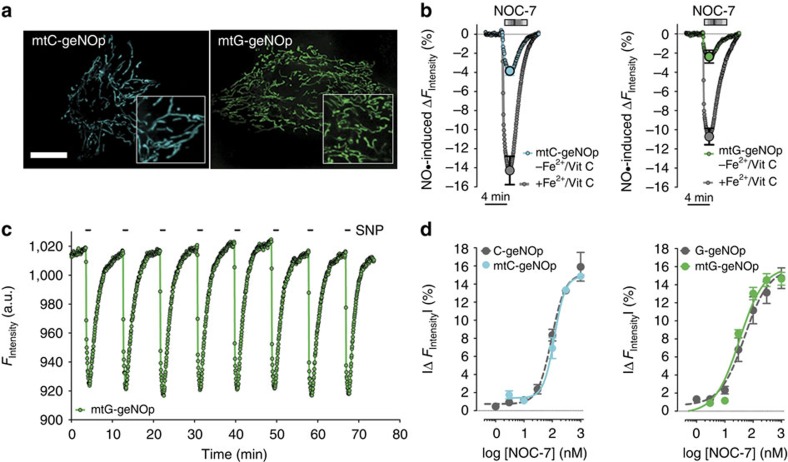
Figure 2
The properties of geNOps remain unaffected upon mitochondria targeting.
( a ) Confocal images of HeLa cells expressing either mtC-geNOp (left image) or mtG-geNOp (right image). Scale bar, 10u2009u03bcm. ( b ) Normalized average curvesu00b1s.e.m. of mtC-geNOp (left panel) ...
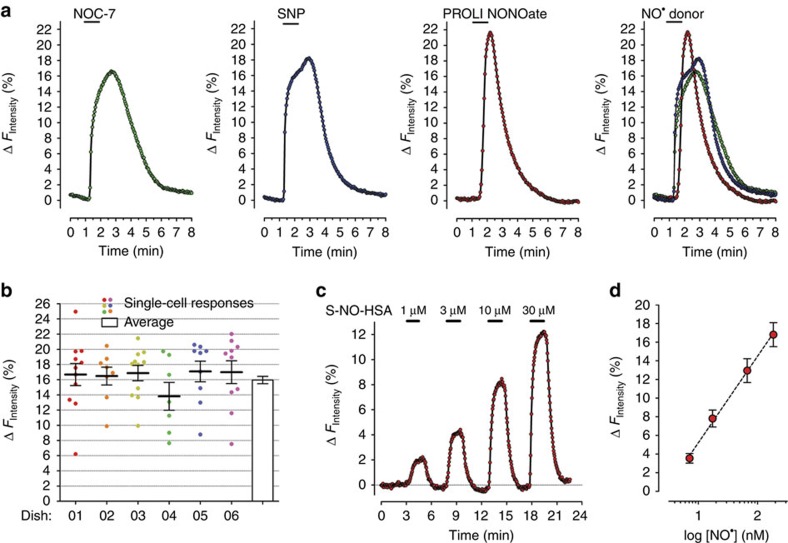
Figure 3
Imaging of cellular dynamics with geNOps in response to different -liberating molecules.
( a ) Representative single HeLa cell dynamics in response to 1u2009u03bcM NOC-7, 1u2009mM SNP or 1u2009u03bcM PROLI NONOate. Cells expressing C-geNOp were imaged. Inverted curves (1u2212 F / F 0 in %...
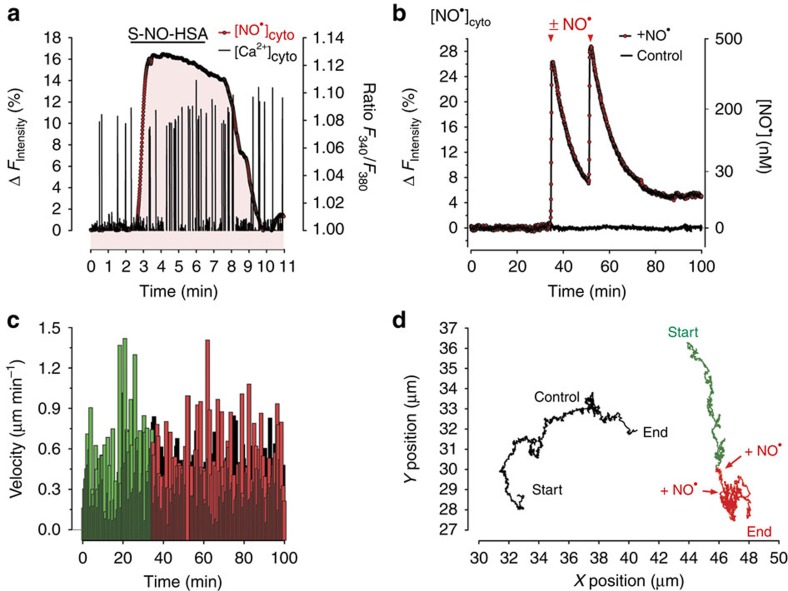
Figure 4
Live-cell imaging of signals and cell functions in primary cardiomyocytes and glioblastoma cells using geNOps.
( a ) Curves represent representative simultaneous recordings of cellular Ca 2+ (black ratio curve) and (red inverted curve) signals over time of a single fura-2/am-loaded embryonic ventricular cardio...
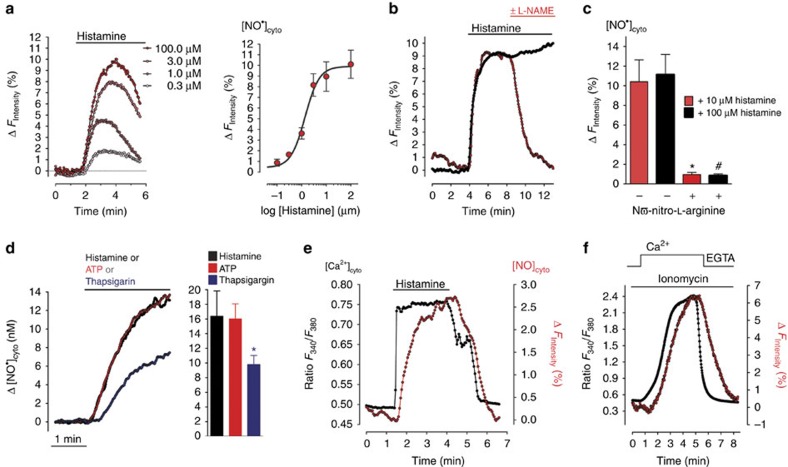
Figure 5
Live-cell imaging of Ca 2+ -triggered production in signals endothelial cells.
( a ) Single endothelial cell (EA.hy926 cells) responses upon cell treatment with different concentrations of histamine (right panel, 0.3u2009u03bcM; 1.0u2009u03bcM; 3.0u2009u03bcM; 100u2009u03bcM his...
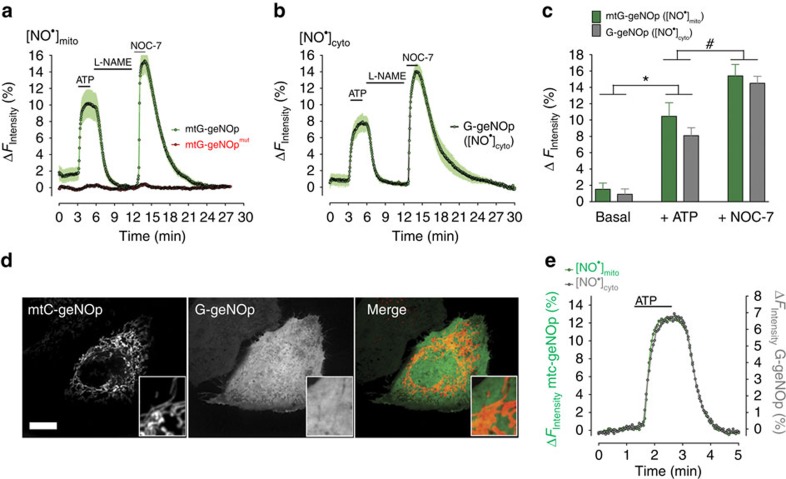
Figure 6
Visualization of signals within mitochondria of signals endothelial cells.
( a ) Average curvesu00b1s.e.m. showing mitochondrial signals measured with mtG-geNOp expressed in EA.hy926 cells (green curve, n =7) and respective signals obtained with mtG-geNOp mut (red curve, n =...
Figure images are served from the NIH/NLM PubMed Central Open Access Subset or Europe PMC; copyright remains with the publishers and authors.
💬 Discussion
0 commentsNo comments yet. Be the first to start a discussion!
Leave a Comment