Abstract
Electropermeabilization/electroporation (EP) provides a tool for the introduction of molecules into cells and tissues. In electrochemotherapy (ECT), cytotoxic drugs are introduced into cells in tumors, and nucleic acids are introduced into cells in gene electrotransfer. The normal and tumor tissue blood flow modifying effects of EP and the vascular disrupting effect of ECT in tumors have already been determined. However, differential effects between normal vs. tumor vessels, to ensure safety in the clinical application of ECT, have not been determined yet. Therefore, the aim of our study was to determine the effects of EP and ECT with bleomycin on the HT-29 human colon carcinoma tumor model and its surrounding blood vessels. The response of blood vessels to EP and ECT was monitored in real time, directly at the single blood vessel level, by in vivo optical imaging in a dorsal window chamber in SCID mice with 70 kDa fluorescently labeled dextrans. The response of tumor blood vessels to EP and ECT started to differ within the first hour. Both therapies induced a vascular lock, decreased functional vascular density (FVD) and increased the diameter of functional blood vessels within the tumor. The effects were more pronounced for ECT, which destroyed the tumor blood vessels within 24 h. Although the vasculature surrounding the tumor was affected by EP and ECT, it remained functional. The study confirms the current model of tumor blood flow modifying effects of EP and provides conclusive evidence that ECT is a vascular disrupting therapy with a specific effect on the tumor blood vessels.
🔬 Techniques
💻 Software
✨ Fluorophores
🧪 Sample Preparation
🔬 Cell Lines
🏭 Microscope Brands
🧪 Reagent Suppliers
💻 Software Details
🏛️ Research Organizations (ROR)
Affiliated research institutions:
📋 Methods
Reagents The 70-kDa fluorescein isothiocyanate-labeled dextran (FD) (Sigma-Aldrich) and a 70-kDa Rhodamine-B-labeled dextran (RhD) were resuspended in phosphate-buffered saline (PBS). To remove any free fluorochromes or low molecular contaminants, the dextrans were washed two times for 3 h through 30-kDa Vivaspin ultrafiltration spin columns (Sartorius Stedim Biotech GmbH). The high molecular weight component was then resuspended in PBS to a final concentration of 37.5 mg/ml. Bleomycin (Pharmachemie B.V.) was resuspended in sterile distilled H 2 O to a working concentration of 3 mg/ml.
Tumor Cells and Mice HT-29 human colorectal adenocarcinoma cells
(ATCC) were cultured in Advanced MEM (Gibco, Life Technologies) supplemented with 5% fetal bovine serum (Nalgene), 10 mM L-glutamine (Gibco), 50 µg/ml gentamicin (Krka) and 100 IU/l crystacillin (Pliva) in a 5% CO 2 humidified incubator at 37°C. The cells were tested negative for mycoplasma using MycoFluor™ (Life Technologies).
SCID mice
(C.B-17/IcrHanHsd-Prkdc scid , Harlan) were held in a specific pathogen-free animal colony at controlled temperature and humidity with 12-h light/dark cycles. Food and water were provided ad libitum . Before the experiments, the mice were subjected to an adaptation period of 14 days. Experiments were performed on female mice, 12–14 weeks old and weighing 20–25 g. All animal experiments were conducted in accordance with the guidelines for animal experiments of the EU Directives and the permission obtained from the Ministry of Agriculture and the Environment of the Republic of Slovenia (Permission No. 34401-12/2009/6). For each experimental condition, 3–5 mice were randomly assigned. Only one experiment was performed on each mouse.
Show full methods section
Reagents The 70-kDa fluorescein isothiocyanate-labeled dextran (FD) (Sigma-Aldrich) and a 70-kDa Rhodamine-B-labeled dextran (RhD) were resuspended in phosphate-buffered saline (PBS). To remove any free fluorochromes or low molecular contaminants, the dextrans were washed two times for 3 h through 30-kDa Vivaspin ultrafiltration spin columns (Sartorius Stedim Biotech GmbH). The high molecular weight component was then resuspended in PBS to a final concentration of 37.5 mg/ml. Bleomycin (Pharmachemie B.V.) was resuspended in sterile distilled H 2 O to a working concentration of 3 mg/ml.
Tumor Cells and Mice HT-29 human colorectal adenocarcinoma cells
(ATCC) were cultured in Advanced MEM (Gibco, Life Technologies) supplemented with 5% fetal bovine serum (Nalgene), 10 mM L-glutamine (Gibco), 50 µg/ml gentamicin (Krka) and 100 IU/l crystacillin (Pliva) in a 5% CO 2 humidified incubator at 37°C. The cells were tested negative for mycoplasma using MycoFluor™ (Life Technologies).
SCID mice
(C.B-17/IcrHanHsd-Prkdc scid , Harlan) were held in a specific pathogen-free animal colony at controlled temperature and humidity with 12-h light/dark cycles. Food and water were provided ad libitum . Before the experiments, the mice were subjected to an adaptation period of 14 days. Experiments were performed on female mice, 12–14 weeks old and weighing 20–25 g. All animal experiments were conducted in accordance with the guidelines for animal experiments of the EU Directives and the permission obtained from the Ministry of Agriculture and the Environment of the Republic of Slovenia (Permission No. 34401-12/2009/6). For each experimental condition, 3–5 mice were randomly assigned. Only one experiment was performed on each mouse.
Preparation of the Dorsal Window Chamber
(DWC) and Tumor Induction in Mice For DWC implantation, mice were first anesthetized with an intraperitoneal injection of ketamine (1 mg/ml, Narketan®, Vetoquinol AG), xylazine (5 mg/ml, Chanazine, Chanelle Pharmaceuticals Manufacturing Ltd.) and acepromazyne (0.4 mg/ml, Promace, Fort Dodge Animal Health). Then, the back of the mouse was depilated (Veet, Reckitt Benckiser Group). The DWC (APJ Trading Co.), consisting of two titanium frames, was surgically implanted onto the extended double layer of the skin, as described previously [14] , [16] , [33] . After the surgery and for the following 2 days, butorphanol (0.3 mg/kg, Torbugesic, Fort Dodge Animal Health) was injected intramuscularly. Tumors were induced 3 days after the surgery by injecting 5 µl of a dense cell suspension (10 8 cells/ml of 0.9% NaCl) with a 29G needle into the dermis in the region of the DWC preparation, as described previously [34] . Electropermeabilization (EP) and Electrochemotherapy (ECT) EP or ECT was performed 6–10 days after the implantation, when the longest diameter of the tumors measured ∼2.5 mm. The pulsing parameters used were standard ECT parameters used in clinics [35] ; 8 square-wave electric pulses with the voltage-to-distance ratio of 1300 V/cm, duration of 100 µs and frequency of 1 Hz. Pulses were generated by Cliniporator™ (IGEA S.r.l.) and delivered by two parallel stainless steel plate electrodes (30 mm long, 6 mm wide) placed 6 mm apart. The electrodes were placed on the skin on the opposite side of the cover glass, where the epidermis was intact, in a way so that the whole tumor and ∼1–2 mm of the surrounding normal tissue were encompassed between the electrodes. Good contact between the electrodes and the skin was ensured by means of a conductive gel (P. J. Dahlhausen & Co. GmbH). When ECT was performed, bleomycin (100 µg/mouse) was injected into the retro-orbital plexus ( i.o. ) 3 min before EP. To determine the extravasation of FD from the vessels, EP was performed 2 min after the i.o. injection of FD, when the vessels were ∼80% filled ( Fig. 1A ), or at different times before the FD i.o. injection to determine the duration of the “vascular lock”, the functional vascular density (FVD) and the average diameter of perfused tumor blood vessels (D V ). The RhD-labeled dextran was injected i.o. only 4, 8 or 24 h after the therapy to visualize the perfused tumor blood vessels. A schematic of the protocol is presented in Fig. 1B . 10.1371/journal.pone.0059557.g001 Figure 1 Characterization of the DWC model. ( A ) Filling of tumor blood vessels after i.o. injection of FD and increase of fluorescence intensity in the tumor tissue in control mice. Mean fluorescence intensities were expressed as a percentage of the maximum mean fluorescence intensity (Imax) reached in the observation period. The first image in the series was acquired ∼10 s after the i.o. injection of FD. ( B ) The timeline of the protocol used in the experiments.
Intravital Microscopy and Image Acquisition
Intravital microscopy was carried out using a Carl Zeiss SteREO Lumar.V12 (Carl Zeiss) fluorescence stereomicroscope equipped with a NeoLumar S 0.8×objective (Carl Zeiss) and an MRc5 digital camera (Carl Zeiss). The animals were anesthetized by inhalation anesthesia (Isofluran, Nicholas Piramal India Ltd.) and placed on a custom-designed holder. Immediately (10 s) after the injection of 100 µl of FD or RhD, the image acquisition sequence was as follows: first, two identical series of images were taken, where images were acquired every 20 s for 2 min. In between both series, there was a 20-s pause when EP was performed, where applicable. Immediately afterwards, a third series of images was taken, where images were acquired every 2 min for 58 min. When FD or RhD were injected after EP, only the second and the third series of images were taken. The images were analyzed off-line with image analysis software (AxioVision, Carl Zeiss).
Data Analysis
To determine the increase in fluorescence intensity inside and outside the vessels, indicating the extent of extravasation, image analysis was performed on the images of tumor blood vessels acquired at 80×magnification with a resolution of 1292×968 pixels and a 16-bit depth. Image analysis was performed as described previously [14] , [16] , with minor modifications: 1) on the aligned images, a region of interest (ROI) was determined from the entire field of view, which represented the tumor area; 2) the obtained mask was corrected, by hand with a graphic tablet (Genius, Taiwan), for the discrepancies between the mask and actual tumor blood vessels; 3), the corrected mask represented the tumor blood vessels network (intravascular space), and the inverted image of this mask represented the tumor tissue (extravascular space). After combining the masks with all of the aligned images of the acquired stacks, the variation in fluorescence intensity in the intravascular and extravascular spaces after EP or ECT was determined at all-time points. To determine D V and FVD, which describes the functional blood vessel density in a given ROI [36] , the masks of the tumor blood vessels network were created on the image series, when FD was injected at different times after EP or ECT. The determined ROI represented the tumor area (A T ), and the obtained masks of the tumor blood vessels network (intravascular space) represented the vascular area (A V ). The tumor blood vessels in which FD was detected were considered perfused. From each created mask, vascular length (L V ) was determined by measuring the length of the tumor blood vessels network skeleton. From the obtained parameters, FVD (FVD = L V /A T ) and D V (D V = A V /L V ) were calculated.
Statistical Analysis
All data were tested for normality of distribution using the Shapiro-Wilk test. The differences between the experimental groups were evaluated by a Student’s t-test or one-way analysis of variance followed by a Holm-Sidak test for multiple comparisons. A p-value of less than 0.05 was considered to be statistically significant. SigmaPlot Software (Systat Software, Chicago, USA) was used for the statistical analysis and graphical representation.
Supporting Information Movie S1 The filing kinetics of the tumor blood vessels after i.o. injection of FD in control mice. Tumor blood vessels were visualized by fluorescence microscopy at 80×magnification. Scale bar 500 µm. Time in the movie is expressed in relation to FD injection. (AVI) Click here for additional data file. Movie S2 Imaging of perfusion changes of tumor blood vessels and leakage of FD after ECT. Bleomycin (100 µg/mouse) was injected i.o. 3 min before EP (8 square wave electric pulses, voltage-to-distance ratio 1300 V/cm, duration 100 µs, repetition frequency 1 Hz) and the FD was injected i.o. 1 min after EP. Tumor blood vessels were visualized by fluorescence microscopy at 80×magnification. Scale bar 500 µm. Time in the movie is expressed in relation to EP. (AVI) Click here for additional data file. Movie S3 Imaging of the induced vascular lock and subsequent re-perfusion of tumor blood vessels after EP. FD was injected i.o. 1 min after the application of electric pulses (8 square wave electric pulses, voltage-to-distance ratio 1300 V/cm, duration 100 µs, repetition frequency 1 Hz). Tumor blood vessels were visualized by fluorescence microscopy at 80×magnification. Scale bar 500 µm. Time in the movie is expressed in relation to EP. (AVI) Click here for additional data file. Movie S4 Imaging of the induced vascular lock and subsequent re-perfusion of tumor blood vessels after ECT . Bleomycin (100 µg/mouse) was injected i.o. 3 min before EP (8 square wave electric pulses, voltage-to-distance ratio 1300 V/cm, duration 100 µs, repetition frequency 1 Hz) and the FD was injected i.o. 1 min after EP. Tumor blood vessels were visualized by fluorescence microscopy at 80×magnification. Scale bar 500 µm. Time in the movie is expressed in relation to EP. (AVI) Click here for additional data file. Movie S5 The filing kinetics of the blood vessels surrounding the tumor after i.o. injection of FD in control mice. Blood vessels were visualized by fluorescence microscopy at 20×magnification. Scale bar 2 mm. Time in the movie is expressed in relation to FD injection. (AVI) Click here for additional data file. Movie S6 Imaging of the induced vascular lock and subsequent re-perfusion of blood vessels surrounding the tumor after EP. FD was injected i.o. 1 min after the application of electric pulses (8 square wave electric pulses, voltage-to-distance ratio 1300 V/cm, duration 100 µs, repetition frequency 1 Hz). Blood vessels were visualized by fluorescence microscopy at 20×magnification. Scale bar 2 mm. Time in the movie is expressed in relation to EP. (AVI) Click here for additional data file. Movie S7 Imaging of the induced vascular lock and subsequent re-perfusion of blood vessels surrounding the tumor after ECT. Bleomycin (100 µg/mouse) was injected i.o. 3 min before EP (8 square wave electric pulses, voltage-to-distance ratio 1300 V/cm, duration 100 µs, repetition frequency 1 Hz) and the FD was injected i.o. 1 min after EP. Blood vessels were visualized by fluorescence microscopy at 20×magnification. Scale bar 2 mm. Time in the movie is expressed in relation to EP. (AVI) Click here for additional data file.
📊 Figures
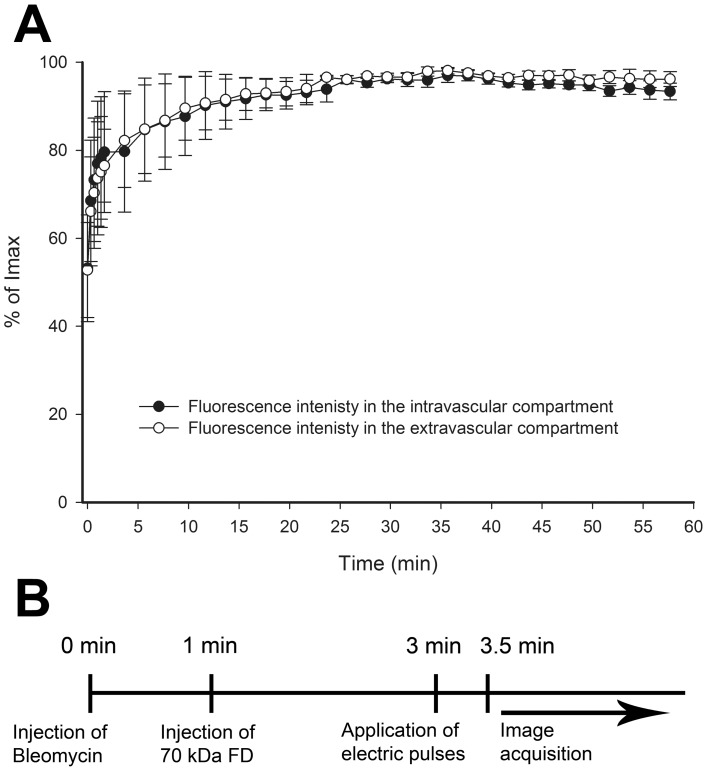
Figure 1
Characterization of the DWC model.
( A ) Filling of tumor blood vessels after i.o. injection of FD and increase of fluorescence intensity in the tumor tissue in control mice. Mean fluorescence intensities were expressed as a percentage...
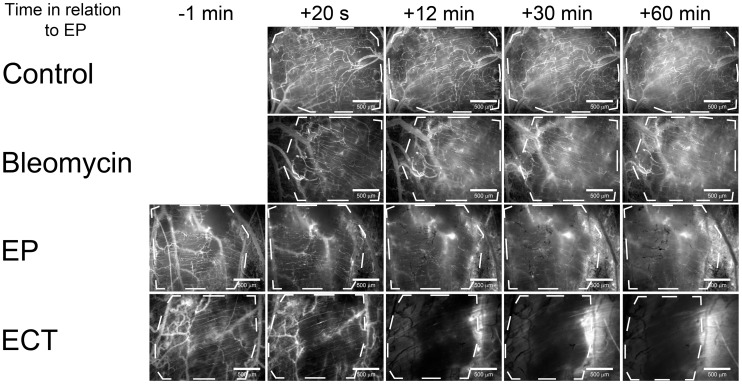
Figure 2
Imaging of the leakage of FD from tumor blood vessels into the tumor tissue.
Tumor blood vessels were visualized by fluorescence microscopy at 80u00d7magnification. Control u2013 mice without treatment, Bleomycin u2013 mice treated with bleomycin only, EP u2013 mice treated wi...
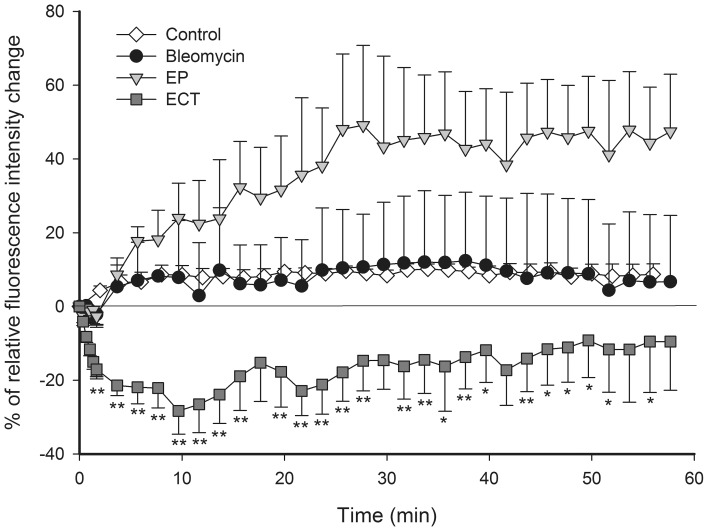
Figure 3
Quantification of FD leakage kinetics from tumor blood vessels.
Relative mean fluorescence intensity changes as a function of time in the tumor tissue, outside the tumor blood vessels. Control u2013 mice without treatment, Bleomycin u2013 mice treated with bleomyc...
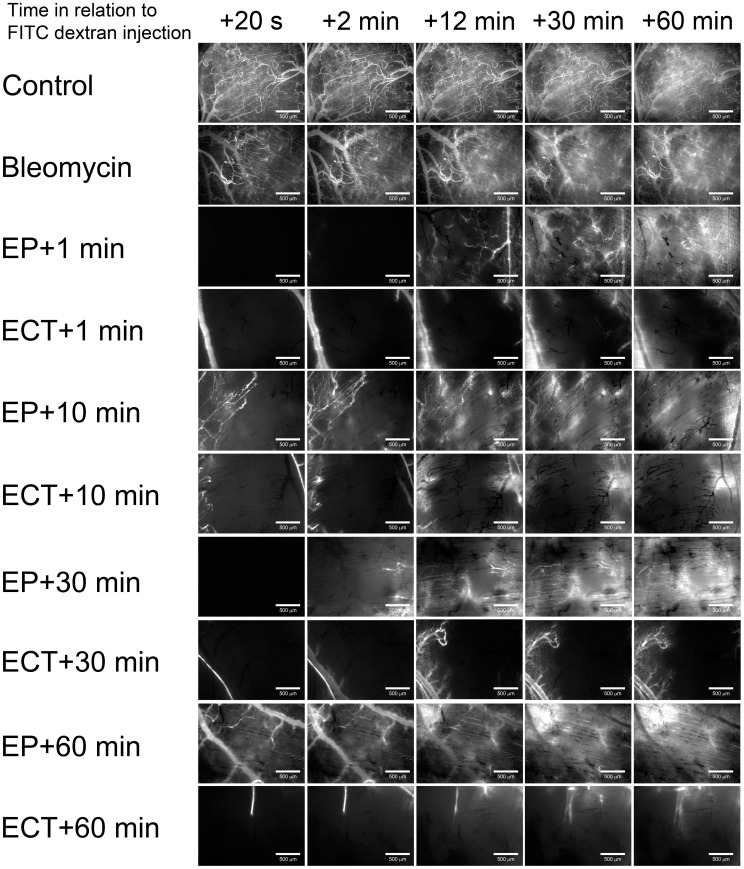
Figure 4
Illustration of a u201cvascular locku201d and re-perfusion of tumor blood vessels after EP and ECT.
Tumor blood vessels were visualized by fluorescence microscopy at 80u00d7magnification. Control u2013 mice without treatment, Bleomycin u2013 mice treated with bleomycin only, EP u2013 mice treated wi...
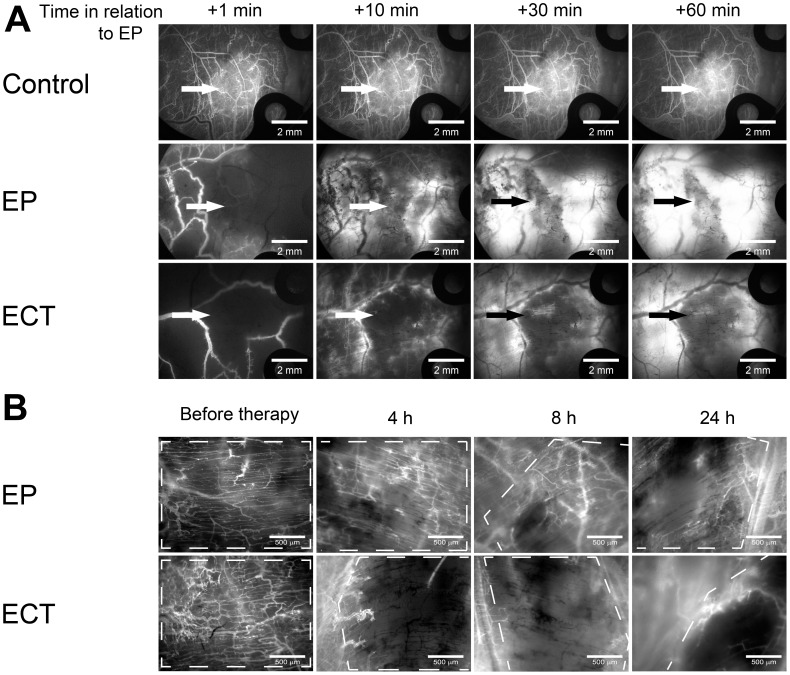
Figure 5
Illustration of a u201cvascular locku201d and re-perfusion of tumor blood vessels in the first hour and 4u201324 h after EP and ECT.
Tumor blood vessels were visualized by fluorescence microscopy. Control u2013 mice without treatment, EP u2013 mice treated with EP, ECT u2013 mice treated with ECT. ( A ) FD was injected i.o. 1 min a...
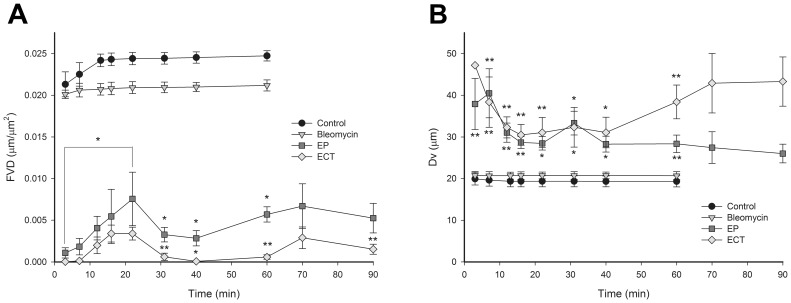
Figure 6
Timeline of the decrease in FVD and increase in D V after EP and ECT.
Control u2013 mice without treatment, Bleomycin u2013 mice treated with bleomycin only, EP u2013 mice treated with EP, ECT u2013 mice treated with ECT. ( A ) The changes in FVD within the tumors are p...
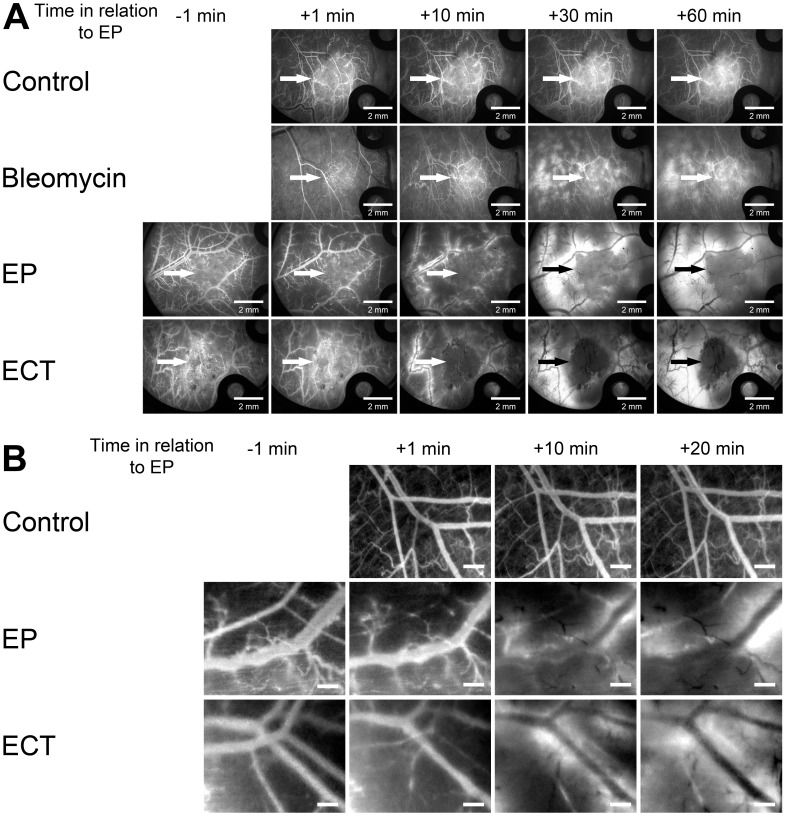
Figure 7
Illustration of FD leakage from blood vessels surrounding the tumor and their constriction after EP and ECT.
Images were acquired at 20u00d7magnification. Control u2013 mice without treatment, Bleomycin u2013 mice treated with bleomycin only, EP u2013 mice treated with EP, ECT u2013 mice treated with ECT. ( ...
Figure images are served from the NIH/NLM PubMed Central Open Access Subset or Europe PMC; copyright remains with the publishers and authors.
💬 Discussion
0 commentsNo comments yet. Be the first to start a discussion!
Leave a Comment