Abstract
Endocytosis in yeast requires actin and clathrin. Live cell imaging has previously shown that massive actin polymerization occurs concomitant with a slow 200-nm inward movement of the endocytic coat (Kaksonen, M., Y. Sun, and D.G. Drubin. 2003. Cell. 115:475-487). However, the nature of the primary endocytic profile in yeast and how clathrin and actin cooperate to generate an endocytic vesicle is unknown. In this study, we analyze the distribution of nine different proteins involved in endocytic uptake along plasma membrane invaginations using immunoelectron microscopy. We find that the primary endocytic profiles are tubular invaginations of up to 50 nm in diameter and 180 nm in length, which accumulate the endocytic coat components at the tip. Interestingly, significant actin labeling is only observed on invaginations longer than 50 nm, suggesting that initial membrane bending occurs before initiation of the slow inward movement. We also find that in the longest profiles, actin and the myosin-I Myo5p form two distinct structures that might be implicated in vesicle fission.
🔬 Techniques
🧬 Organisms
💻 Software
🧪 Sample Preparation
🏭 Microscope Brands
🧪 Reagent Suppliers
📷 Detectors
💻 Software Details
💾 Data Repositories
🏛️ Research Organizations (ROR)
Affiliated research institutions:
📋 Methods
Yeast strains and plasmid construction
The yeast strains used are listed in Table V . HA tag was fused at the C terminus of each protein by homologous recombination in the gene as described previously ( Wach et al., 1997 ). PCRs were performed using a DNA polymerase with proof reading activity (Vent polymerase; New England Biolabs, Inc.). Oligonucleotides were synthesized by MWG-Biotech AG. pMIG692 is a centromeric shuttle vector based on pYCplac111 containing a C-terminal HA-tagged SLA1 gene under its own promoter and the selectable marker HIS3MX. It was constructed by homologous recombination in yeast. Unless otherwise mentioned, strains without plasmid were grown in complete yeast peptone dextrose medium, and strains with plasmid were grown on synthetic dextrose complete medium without leucin at 26°C ( Guthrie and Fink, 1991 ). Transformation of yeast was accomplished by the lithium acetate method ( Ito et al., 1983 ). Table V. Saccharomyces cerevisiae strains used in this study Strain Genotype Source RH2881 MAT a his3 leu2 ura3 trp1 bar1-1 H. Riezman a RH2634 MAT a his3 leu2 ura3 bar1-1 sla1Δ∷URA3 H. Riezman a ScMIG516 MAT a his3 leu2 ura3 trp1 bar1-1 LAS17-3HA∷TRP1 This study ScMIG946 MAT a his3 leu2 ura3 trp1 bar1-1 PAN1-3HA∷TRP1 This study ScMIG903 MAT a his3Δ1 ura3Δ0 leu2Δ10 met15Δ0 bar1Δ∷URA3 BBC1-3HA∷HIS3MX This study ScMIG100 MAT a his3Δ1 ura3Δ0 leu2Δ10 met15Δ0 bar1Δ∷URA3 This study ScMIG723 MAT a his3Δ1 ura3Δ0 leu2Δ10 met15Δ0 bar1Δ∷URA3 ABP1-3HA∷HIS3MX This study ScMIG994 MAT a his3Δ1 ura3Δ0 leu2Δ10 met15Δ0 bar1Δ∷URA3 MYO5-3HA∷HIS3MX This study ScMIG995 MAT a his3Δ1 ura3Δ0 leu2Δ10 met15Δ0 bar1Δ∷URA3 RVS167-3HA∷HIS3MX This study a University of Geneva, Geneva, Switzerland.
Show full methods section
Yeast strains and plasmid construction
The yeast strains used are listed in Table V . HA tag was fused at the C terminus of each protein by homologous recombination in the gene as described previously ( Wach et al., 1997 ). PCRs were performed using a DNA polymerase with proof reading activity (Vent polymerase; New England Biolabs, Inc.). Oligonucleotides were synthesized by MWG-Biotech AG. pMIG692 is a centromeric shuttle vector based on pYCplac111 containing a C-terminal HA-tagged SLA1 gene under its own promoter and the selectable marker HIS3MX. It was constructed by homologous recombination in yeast. Unless otherwise mentioned, strains without plasmid were grown in complete yeast peptone dextrose medium, and strains with plasmid were grown on synthetic dextrose complete medium without leucin at 26°C ( Guthrie and Fink, 1991 ). Transformation of yeast was accomplished by the lithium acetate method ( Ito et al., 1983 ). Table V. Saccharomyces cerevisiae strains used in this study Strain Genotype Source RH2881 MAT a his3 leu2 ura3 trp1 bar1-1 H. Riezman a RH2634 MAT a his3 leu2 ura3 bar1-1 sla1Δ∷URA3 H. Riezman a ScMIG516 MAT a his3 leu2 ura3 trp1 bar1-1 LAS17-3HA∷TRP1 This study ScMIG946 MAT a his3 leu2 ura3 trp1 bar1-1 PAN1-3HA∷TRP1 This study ScMIG903 MAT a his3Δ1 ura3Δ0 leu2Δ10 met15Δ0 bar1Δ∷URA3 BBC1-3HA∷HIS3MX This study ScMIG100 MAT a his3Δ1 ura3Δ0 leu2Δ10 met15Δ0 bar1Δ∷URA3 This study ScMIG723 MAT a his3Δ1 ura3Δ0 leu2Δ10 met15Δ0 bar1Δ∷URA3 ABP1-3HA∷HIS3MX This study ScMIG994 MAT a his3Δ1 ura3Δ0 leu2Δ10 met15Δ0 bar1Δ∷URA3 MYO5-3HA∷HIS3MX This study ScMIG995 MAT a his3Δ1 ura3Δ0 leu2Δ10 met15Δ0 bar1Δ∷URA3 RVS167-3HA∷HIS3MX This study a University of Geneva, Geneva, Switzerland.
Preparation of yeast ultrathin sections and immunolabeling
Cells were grown in yeast peptone dextrose medium to 4–5 × 10 6 cells/ml and harvested over a disposable Stericup 0.22-μm filter unit with a vacuum of −20 to −15 Hg, leaving behind 5 ml of media. 25 ml of 1.2× fixative solution was immediately added to obtain final concentrations of 0.04 M KPO 4 , pH 6.6, 0.6 M sorbitol, 4% formaldehyde (from a 16% ethanol-free ultrapure electron microscopy–grade solution; Polysciences, Inc.), 0.4% glutaraldehyde (25% electron microscopy–grade solution; Fluka), 1 mM MgCl 2 , 0.5 mM EGTA (glycol-bis[2-aminoethylether]- N , N , N ′, N ′–tetraacetic acid), 10 mM NaF, and 10 mM KF. Cells were then transferred to a 50-ml Falcon tube (BD Biosciences), and fixation was continued overnight at 4°C with rolling. Subsequent steps (metaperiodate and ammonium chloride treatments, dehydration, infiltration, embedding, and sectioning) were performed as described previously ( Mulholland et al., 1994 ) without further modifications. For immunolabeling, ultrathin sections were incubated for 15 min in blocking buffer (10 mM KPO 4 , pH 7.5, 150 mM NaCl, 2% BSA, and 0.05% Tween 20), transferred to a 25-μl drop of primary antibody in blocking buffer for 3 h, and washed over 30 min in washing buffer (10 mM KPO 4 buffer, pH 7.5, 150 mM NaCl, and 0.05% Tween 20). After blocking for 15 min, grids were incubated with the corresponding gold-conjugated secondary antibody for 60 min and were washed first for 30 min in washing buffer and then for a further 30 min in washing buffer without Tween 20. All steps of immunolabeling were performed at room temperature. Grids were then washed in double-distilled water and poststained with uranyl acetate (2% in water) over 60 min and lead citrate for 30 s as described previously ( Reynolds, 1963 ). For double immunolabeling, ultrathin sections were incubated with a mixture of the two first antibodies for 3 h, washed as described for the single immunolabeling, incubated with a mixture of the corresponding 1:50 diluted secondary antibodies, and conjugated to gold particles of different sizes. 8 μg/ml anti-HA rat monoclonal antibody (3F10; Roche), 200 μg/ml mouse anti-actin monoclonal antibody (C4; Chemicon International), and a mixture of six mouse anti-Chc1p monoclonal antibodies diluted 1:5 ( Lemmon et al., 1988 ) were used as primary antibodies for the detection of HA-tagged proteins, actin, and clathrin, respectively (the antibodies against clathrin were gifts from S.K. Lemmon, University of Miami, Miami, FL). 20-nm gold-conjugated goat anti–mouse IgG (EM.GMHL20) and 10-nm gold-conjugated anti–rat IgG (EM.GAT10; BB International) were used as secondary antibodies (diluted 1:50). Ultrathin sections were examined using a transmission electron microscope (model 1010; JEOL) at 50 Kv accelerating voltage. Micrographs of the yeast plasma membrane invaginations were acquired at 100,000× magnification with a CCD camera (MegaView III; Olympus) and image acquisition analySIS software (Olympus). Adjustments of image size, brightness, and contrast were performed on Photoshop 5.0 (Adobe). The IL was measured on immunoelectron micrographs as the distance from a reference line that defines the basal plasma membrane to the invagination tip. The GDPM was measured as the minimal distance from the basal plasma membrane to the center of the gold particle. The GDLB was measured as the minimal distance from the gold center to the lipid bilayer. The distance measurements on micrographs were performed by Photoshop 5.0.2 ruler. The specificity of the anti-HA labeling on plasma membrane invaginations was assessed for the less abundant endocytic protein Las17p at the endocytic patch and for the most transiently recruited one, Rvs167p ( Sun et al., 2006 ). 45% of the plasma membrane invaginations ( n i = 200) on ultrathin sections of the strain expressing HA-tagged Las17p (ScMIG516) were labeled with immunogold particles versus 12.5% of the plasma membrane invaginations ( n i = 200) on ultrathin sections of the isogenic wild type (ScMIG228). For Rvs167p, 61% of the plasma membrane invaginations ( n i = 200) on ultrathin sections of the strain expressing HA-tagged Rvs167p (ScMIG995) were labeled with immunogold particles versus 9.5% of the plasma membrane invaginations ( n i = 200) on ultrathin sections of the isogenic wild type (ScMIG100).
Statistical analysis of the immunogold distribution
All statistical analyses of the immunogold distributions were performed with a statistical package for Windows (version 15.0; SPSS). A nonparametric Kruskal-Wallis test ( Kruskal and Wallis, 1952 ) was used for comparison of the immunogold subpopulation associated with the intermediate (50 nm ≤ IL < 100 nm) and long (IL ≥ 100 nm) profiles within the same protein and for comparison of the Act1p and Myo5p distributions in short (IL ≤ 80 nm) and very long (IL ≥ 110 nm) profiles. A generalized linear model ( McCullagh and Nelder, 1989 ) was applied for comparison of proteins using the IL, GRP, GDPM, and GDIT parameters. A χ 2 test ( Cochran, 1954 ) was used to analyze the likelihood ratio between the frequencies of gold particles decorating Myo5p or actin on the invagination basal, intermediate, and apical regions. Online supplemental material Fig. S1 shows statistical analysis of the distribution of gold particles labeling actin and Myo5p on invaginations shorter than 80 nm or longer than 110 nm.
Table
S1 shows the descriptive statistics for the IL parameter.
Table
S2 shows the descriptive statistics for the GRP, GDIT, GDPM, and GDLB parameters. Online supplemental material is available at http://www.jcb.org/cgi/content/full/jcb.200708060/DC1 .
Online supplemental material Fig. S1 shows statistical analysis of the distribution of gold particles labeling actin and Myo5p on invaginations shorter than 80 nm or longer than 110 nm.
Table
S1 shows the descriptive statistics for the IL parameter.
Table
S2 shows the descriptive statistics for the GRP, GDIT, GDPM, and GDLB parameters. Online supplemental material is available at http://www.jcb.org/cgi/content/full/jcb.200708060/DC1 .
Supplemental Material [Supplemental Material Index]
📊 Figures
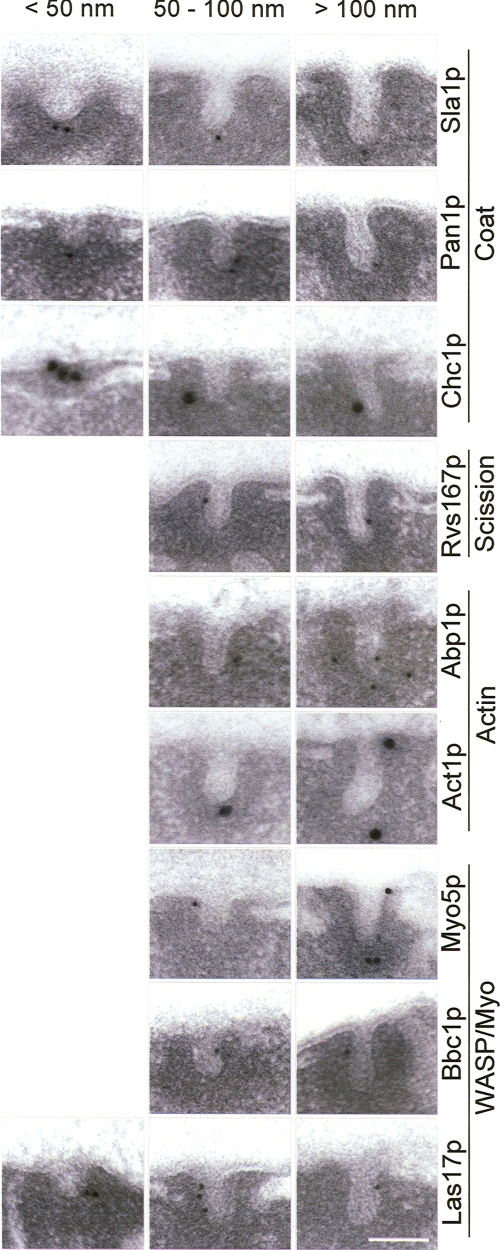
Figure 1.
Proteins involved in the endocytic uptake associate with plasma membrane invaginations of about 50 nm in diameter and up to 180 nm in length. Representative electron micrographs of ultrathin sections ...
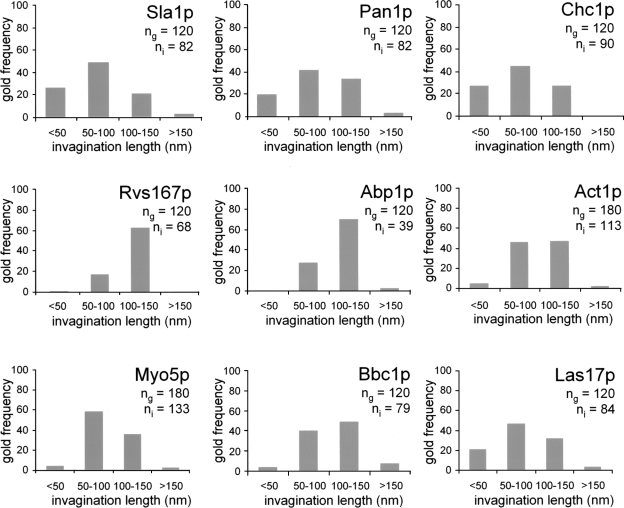
Figure 2.
Shallow plasma membrane invaginations are almost devoid of endocytic proteins recruited during the slow inward movement. Frequency of gold decorating the indicated proteins binned according to the len...
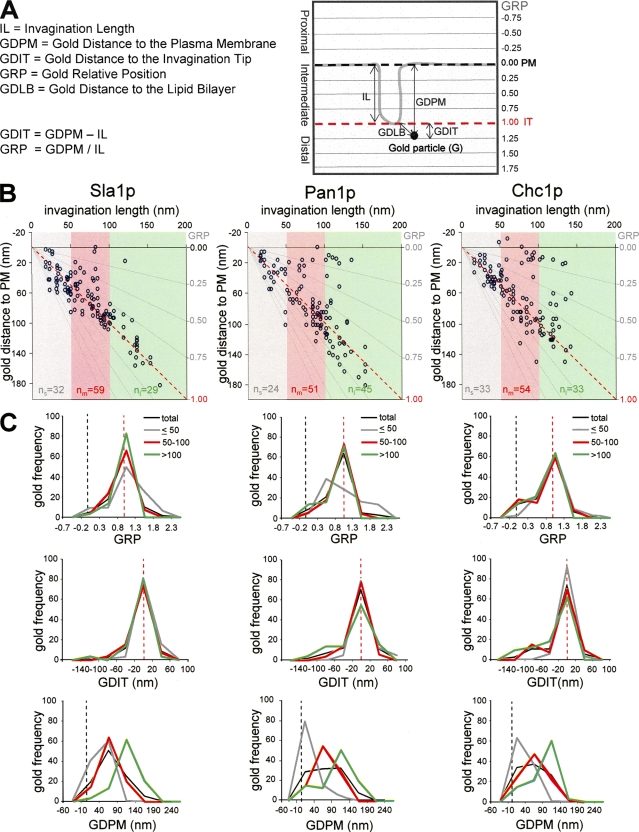
Figure 3.
Endocytic coat components accumulate at the tip of tubular invaginations. (A) Scheme of an immunogold-labeled invagination showing the parameters used to characterize the particle position: invaginati...
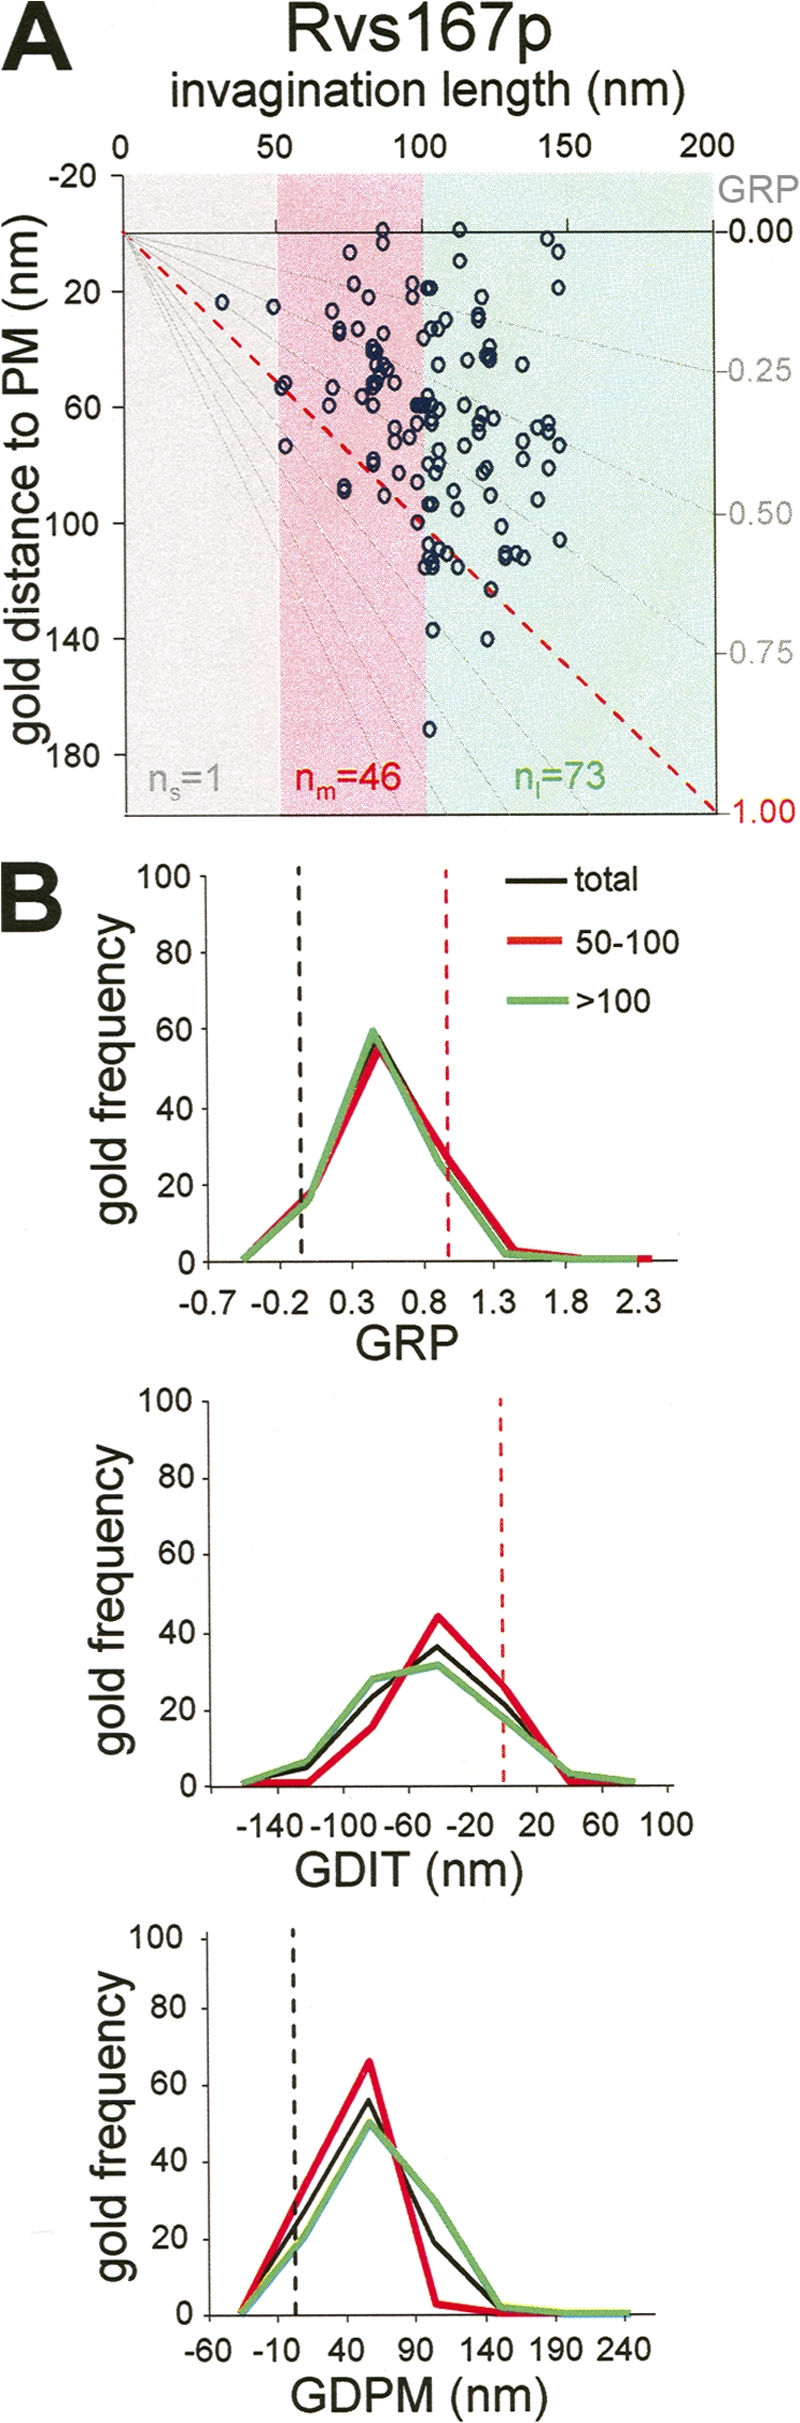
Figure 4.
The yeast amphiphysin Rvs167p occupies a subapical area on plasma membraneu2013associated invaginations. (A) Graph representing the GDPM for each recorded gold particle labeling Rvs167p versus the IL....
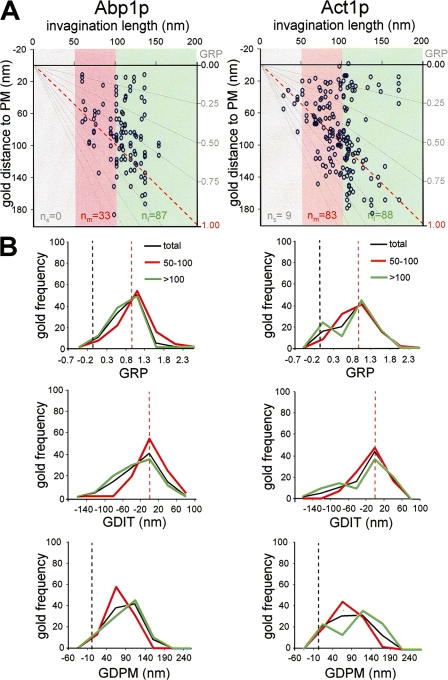
Figure 5.
Actin segregates into two distinct pools in long plasma membrane invaginations. (A) Graphs representing the GDPM for each recorded gold particle labeling Abp1p or actin (Act1p) versus the IL. The x ax...
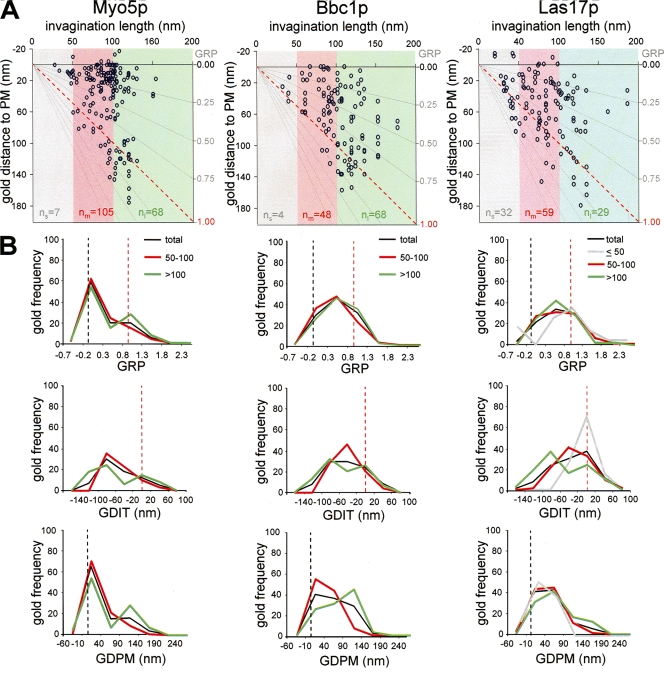
Figure 6.
Myo5p but not Las17p or Bbc1p mimics the distribution of actin in long profiles. (A) Graphs representing the GDPM for each recorded gold particle labeling Myo5p, Bbc1p, or Las17p versus the IL. The x ...
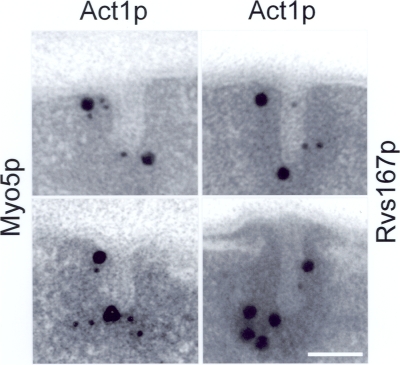
Figure 7.
Two distinct acto/myosin-I pools associate with deep plasma membrane invaginations. Representative electron micrographs of ultrathin sections showing the colocalization of either Myo5p and Act1p or Rv...
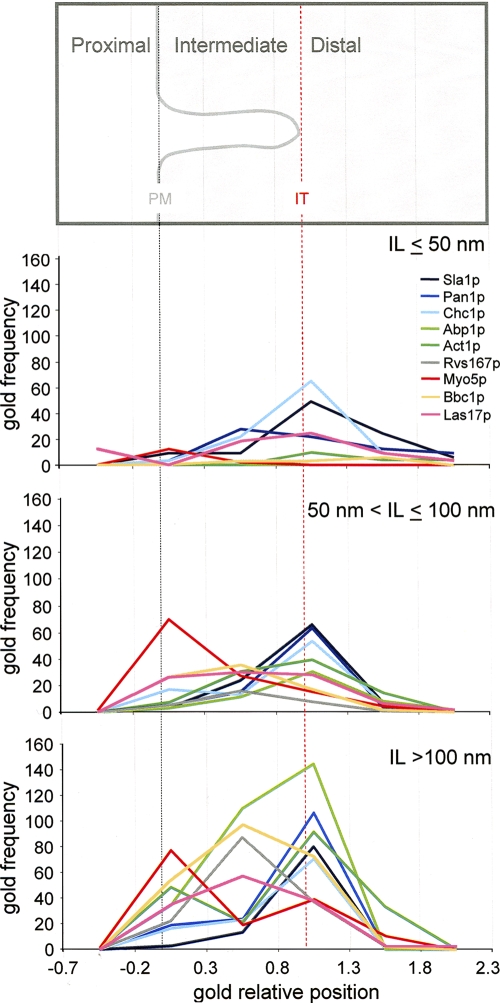
Figure 8.
Comparative distribution of endocytic proteins along short, intermediate, and long plasma membraneu2013associated invaginations. The graphs represent the relative frequency of immunogold associated wi...
Figure images are served from the NIH/NLM PubMed Central Open Access Subset or Europe PMC; copyright remains with the publishers and authors.
💬 Discussion
0 commentsNo comments yet. Be the first to start a discussion!
Leave a Comment