Abstract
Mammalian cells have a remarkable capacity to compensate for heterozygous gene loss or extra gene copies. One exception is Down syndrome (DS), where a third copy of chromosome 21 mediates neurogenesis defects and lowers the frequency of solid tumors. Here we combine live-cell imaging and single-cell analysis to show that increased dosage of chromosome 21-localized Dyrk1a steeply increases G1 cell cycle duration through direct phosphorylation and degradation of cyclin D1 (CycD1). DS-derived fibroblasts showed analogous cell cycle changes that were reversed by Dyrk1a inhibition. Furthermore, reducing Dyrk1a activity increased CycD1 expression to force a bifurcation, with one subpopulation of cells accelerating proliferation and the other arresting proliferation by costabilizing CycD1 and the CDK inhibitor p21. Thus, dosage of Dyrk1a repositions cells within a p21-CycD1 signaling map, directing each cell to either proliferate or to follow two distinct cell cycle exit pathways characterized by high or low CycD1 and p21 levels.
🔬 Techniques
🧬 Organisms
💻 Software
✨ Fluorophores
🧪 Sample Preparation
🔬 Cell Lines
🏭 Microscope Brands
🧪 Reagent Suppliers
💻 Software Details
🏛️ Research Organizations (ROR)
Affiliated research institutions:
📋 Methods
Cell culture, transfection, antibodies and plasmids BJ-5ta cells were obtained from ATCC and cultured in 4 parts DMEM (Invitrogen) and 1 part Medium 199 (Invitrogen) supplemented with 10% fetal bovine serum (FBS), penicillin-streptomycin-glutamine (PSG) (Invitrogen) and 0.01 mg/ml hygromycin B (Invitrogen) between passage number 6 and 15. Human trisomy 21 skin fibroblasts (AG5397, AG6692 and AG7438) and the age-matched normal skin fibroblasts (GM5659, GM5565 and GM5658) were obtained from the Coriell Institute for Medical Research and cultured in DMEM supplemented with 10% FBS, non-essential amino acids (Invitrogen), 55mM β-mercaptoethanol (Sigma) and PSG. Primary human fibroblasts were used for experiments up to passage 10 after receipt of the cells. Synthetic siRNAs used for this study were from Dharmacon and were used at 10-20 nM with Lipofectamine 2000 reagents (Invitrogen) according to the manufacturer's protocol. Harmine (EMD Biosciences) was used at 5μM for 6-8h unless otherwise noted. Nutlin-3 and MG132 were purchased from EMD Biosciences and were used at 10 and 50μM, respectively. Etoposide (Sigma) was used at 20μM. Sources for siRNAs, antibodies, reagents, and other constructs used in this study are provided in the Supplemental Methods .
Time-lapse microscopy
Cells were reversed transfected with indicated siRNAs for 48h prior to imaging in a 96-well dish (Costar) at a density of 4,000 cells per well. For Figure 1F , Harmine was applied immediately before imaging. Time-lapse imaging was performed in full growth media supplemented with 20mM Hepes (pH 7.4) and 1mM ascorbic acid. Images were taken in CFP and RFP channels every 12 min on an ImagExpress5000A microscope (Molecular Devices) with a 10× objective. Total light exposure time was kept under 380 msec for each time point. For tet-on experiments ( Figure 2 & Figure S2 ), images were taken in YFP channel at the end of imaging to obtain mCit-Dyrk1a intensity which remains mostly constant throughout the cell cycle. CycD1 intensity shown in Figure 2F was obtained by subsequent immunostaining and imaged in Far-Red channel following time-lapse imaging. Cells were imaged in a sealed plate at 37°C chamber.
Show full methods section
Cell culture, transfection, antibodies and plasmids BJ-5ta cells were obtained from ATCC and cultured in 4 parts DMEM (Invitrogen) and 1 part Medium 199 (Invitrogen) supplemented with 10% fetal bovine serum (FBS), penicillin-streptomycin-glutamine (PSG) (Invitrogen) and 0.01 mg/ml hygromycin B (Invitrogen) between passage number 6 and 15. Human trisomy 21 skin fibroblasts (AG5397, AG6692 and AG7438) and the age-matched normal skin fibroblasts (GM5659, GM5565 and GM5658) were obtained from the Coriell Institute for Medical Research and cultured in DMEM supplemented with 10% FBS, non-essential amino acids (Invitrogen), 55mM β-mercaptoethanol (Sigma) and PSG. Primary human fibroblasts were used for experiments up to passage 10 after receipt of the cells. Synthetic siRNAs used for this study were from Dharmacon and were used at 10-20 nM with Lipofectamine 2000 reagents (Invitrogen) according to the manufacturer's protocol. Harmine (EMD Biosciences) was used at 5μM for 6-8h unless otherwise noted. Nutlin-3 and MG132 were purchased from EMD Biosciences and were used at 10 and 50μM, respectively. Etoposide (Sigma) was used at 20μM. Sources for siRNAs, antibodies, reagents, and other constructs used in this study are provided in the Supplemental Methods .
Time-lapse microscopy
Cells were reversed transfected with indicated siRNAs for 48h prior to imaging in a 96-well dish (Costar) at a density of 4,000 cells per well. For Figure 1F , Harmine was applied immediately before imaging. Time-lapse imaging was performed in full growth media supplemented with 20mM Hepes (pH 7.4) and 1mM ascorbic acid. Images were taken in CFP and RFP channels every 12 min on an ImagExpress5000A microscope (Molecular Devices) with a 10× objective. Total light exposure time was kept under 380 msec for each time point. For tet-on experiments ( Figure 2 & Figure S2 ), images were taken in YFP channel at the end of imaging to obtain mCit-Dyrk1a intensity which remains mostly constant throughout the cell cycle. CycD1 intensity shown in Figure 2F was obtained by subsequent immunostaining and imaged in Far-Red channel following time-lapse imaging. Cells were imaged in a sealed plate at 37°C chamber.
Image Analysis
Images for the 2D signaling map experiments were analyzed using custom made MATLAB image analysis programs ( Salmeen et al., 2010 ). Briefly, nuclear centroids were identified in images of Hoechst staining. A nucleus mask was generated for each cell by expansion from the centroid to reach 30% of maximum intensity. After local background subtraction, the nuclear p21, CycD1 and phospho-Rb Serine 807/811 mean intensity were measured. The threshold level used to determine phospho-Rb positive cells was set using a k-means clustering algorithm on a well-to-well basis. Detailed analysis related to the 2D signaling map and imaging processing of the time-lapse microscopy is described in the Supplemental Methods .
Statistical analysis
Error bars represent the standard deviation, standard error of the mean or 95% bootstrap confidence interval as indicated in the legends. Statistical comparisons (p values) were obtained from two-sided t tests. The Pearson's correlation coefficients (R) were calculated as indicated.
Supplementary Material 01
📊 Figures
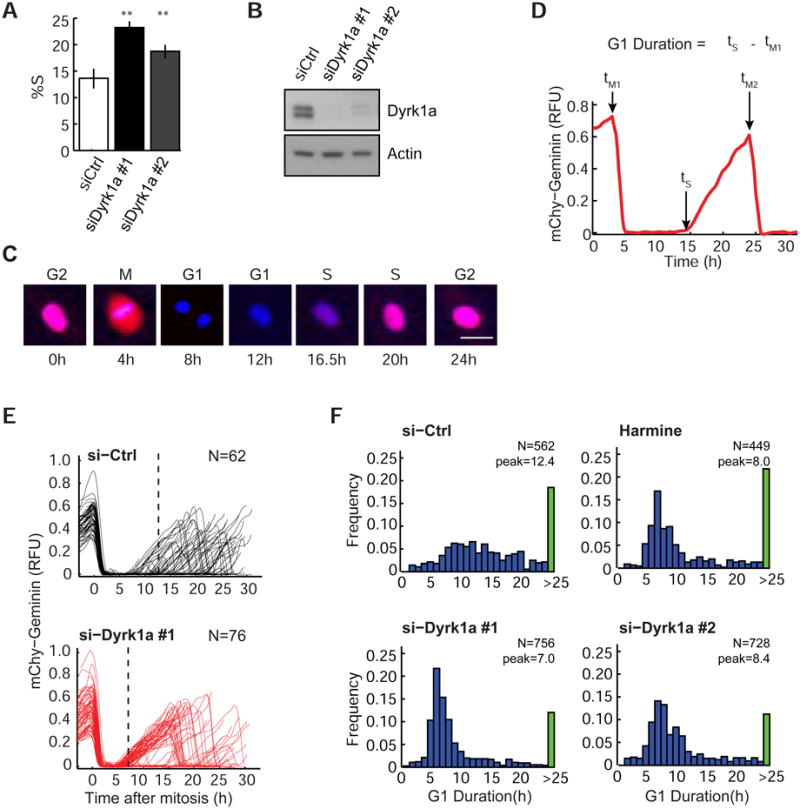
Figure 1
Loss of Dyrk1a leads to shortened G1 duration and reduced G1 variability
(A) Knockdown of Dyrk1a increases the percentage of cells in S-phase (%S) (mean u00b1 SD of 4 wells; **: p25h, green bar)) (F). Only cells with at least one mitosis during the imaging period were incl...

Figure 2
Dosage effect of Dyrk1a on G1 cell cycle progression
(A) Induction of siRNA-resistant mCit-Dyrk1a by doxycycline (DOX). DOX was used at 0.1u03bcg/ml. (B) Rescue of Dyrk1a knockdown by DOX-induced expression of WT but not kinase-dead (KR) mCit-Dyrk1a. G1...
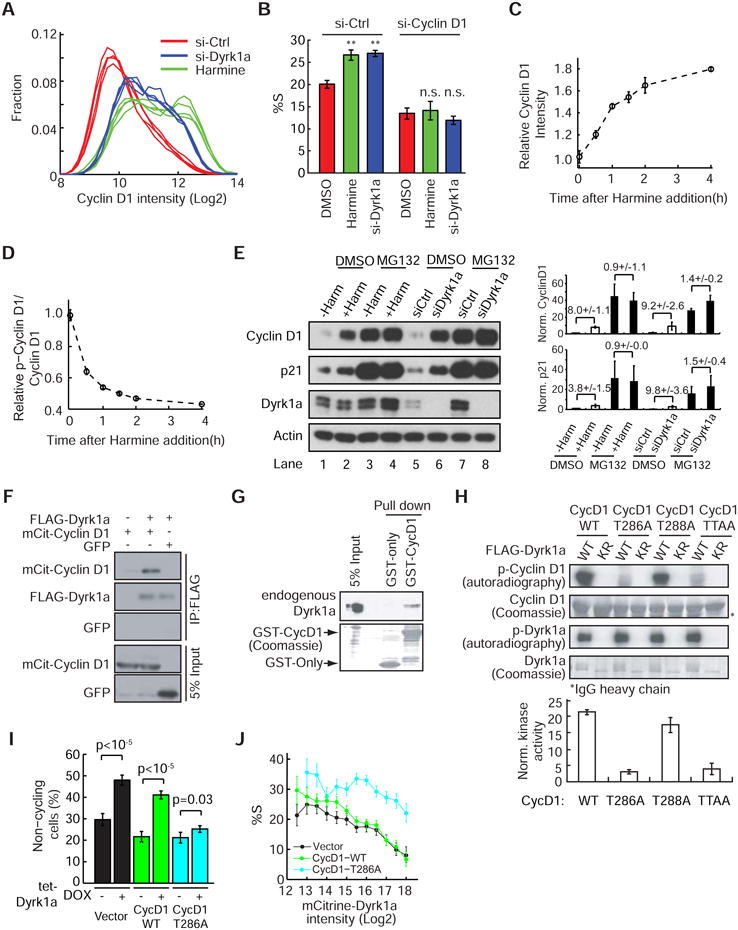
Figure 3
The cell cycle effect of Dyrk1a is mediated by direct phosphorylation and subsequent degradation of CycD1
(A) Frequency plot showing the increase of CycD1 in cells treated with Dyrk1a-siRNA or Harmine. Each line represents the average frequency data from one well as a function of CycD1 intensity (n>2000 c...
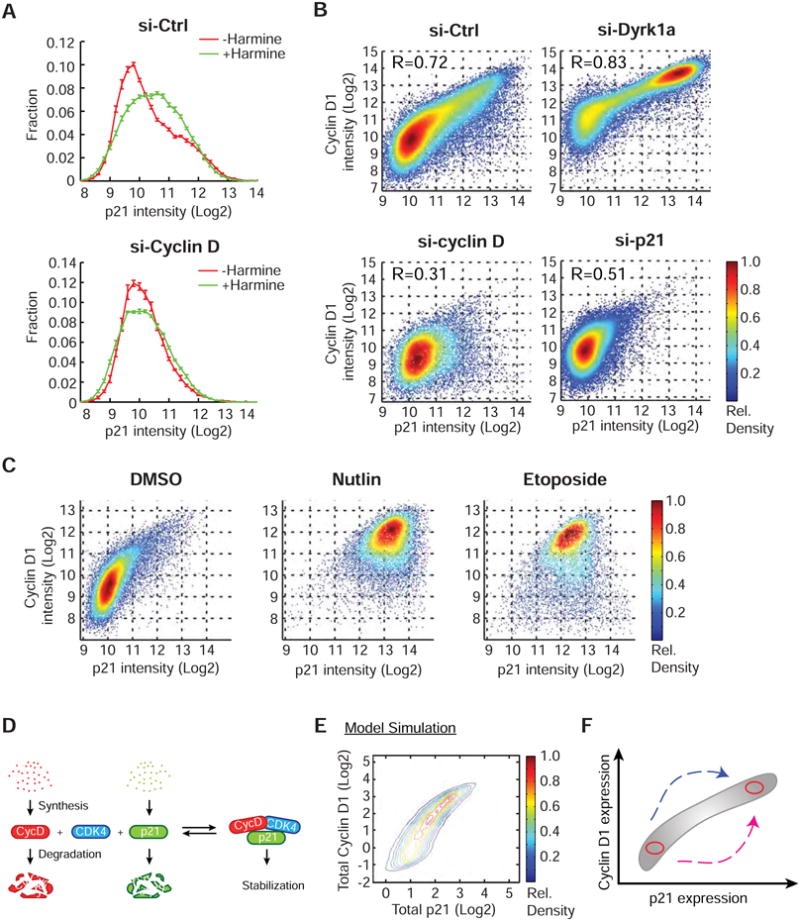
Figure 4
Co-dependent stabilization of CycD1 and p21
(A) Frequency plots showing that the increase of p21 after 6h of Harmine treatment is due to CycD (mean u00b1 SD of 4 replicate wells). (B) Density scatter plots of p21 versus CycD1 fluorescence inten...
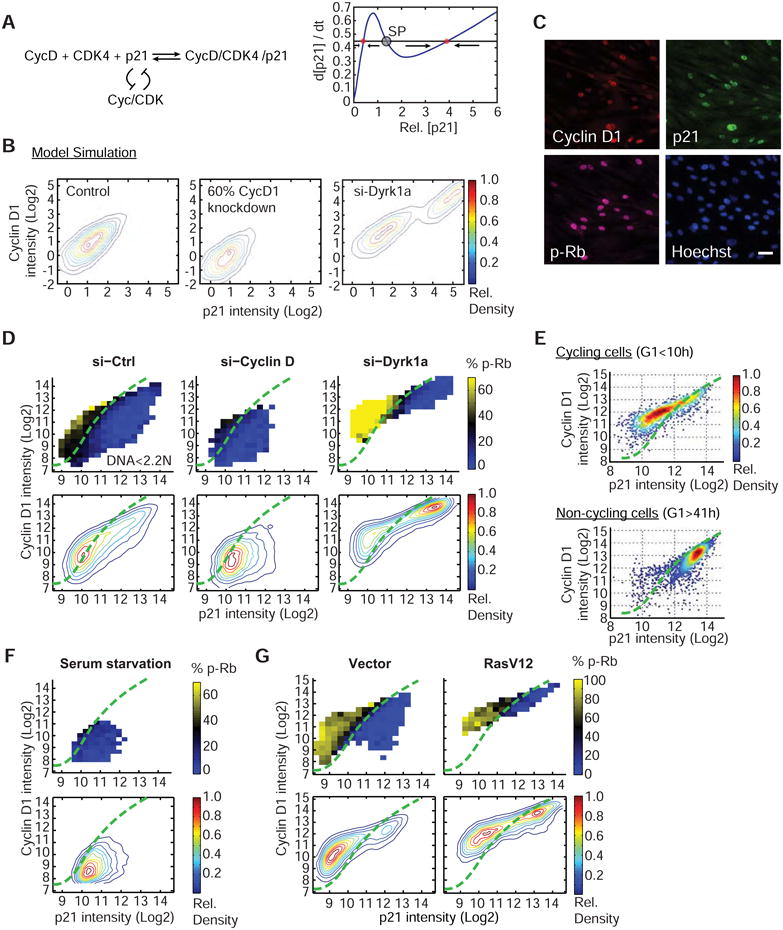
Figure 5
Dyrk1a generates a bimodal distribution in the p21-CycD1 map and forces a decision between cell cycle entry and two distinct cell cycle exit pathways
(A) Schematic showing that adding a p21-degradation based double negative feedback to the CycD1 and p21 co-stabilization scheme (left) creates a bifurcation in p21 levels (right). SP: saddle point. (B...
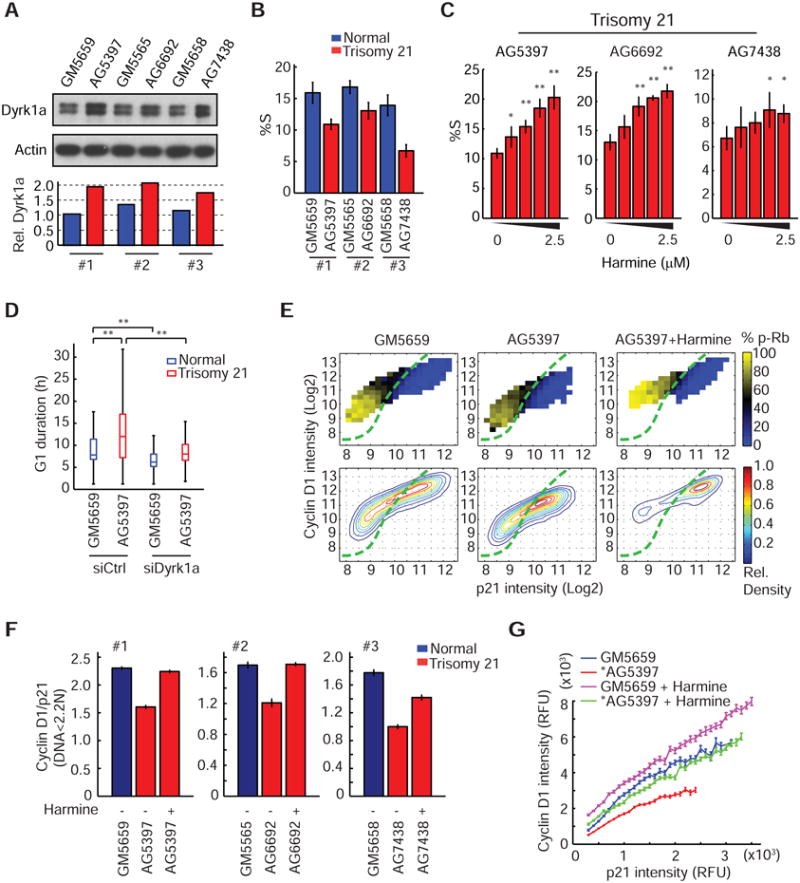
Figure 6
Extra-dosage of Dyrk1a in Down syndrome-derived fibroblasts contributes to G1 cell cycle changes
(A) An extra-copy of Dyrk1a gene in DS-derived fibroblasts increases Dyrk1 protein level by 1.6-fold. Representative western blot (top) and the quantification of band intensity (bottom) are shown. Thr...
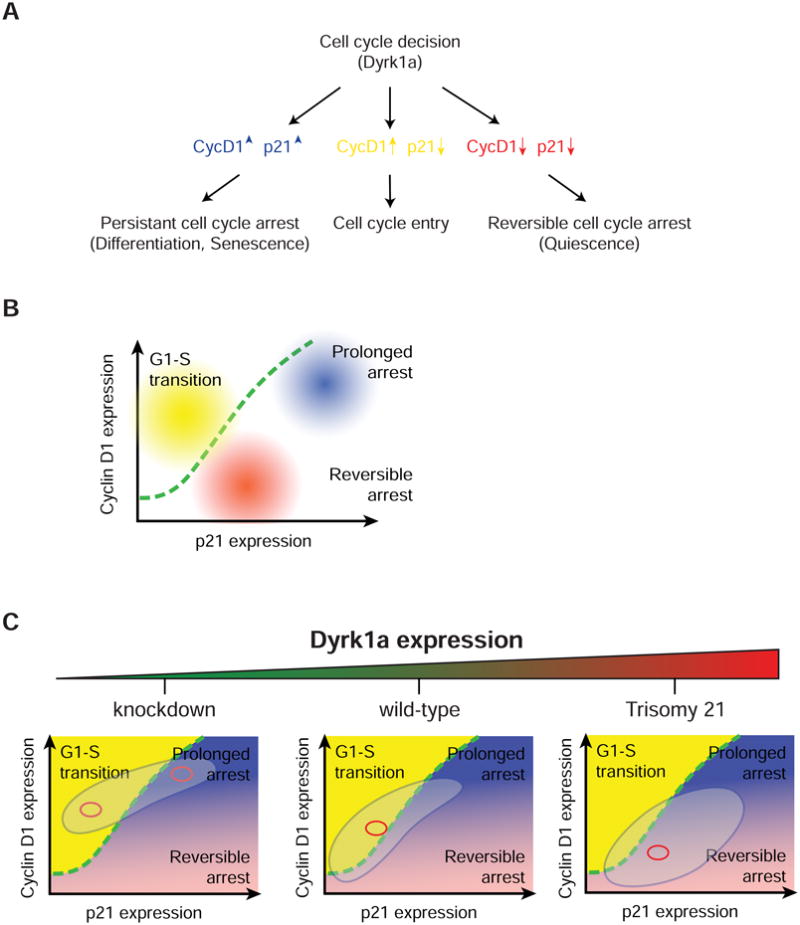
Figure 7
Dyrk1a-mediated shifts in the p21-CycD1 signaling map lead to cell cycle entry or one out of the two cell cycle exit decisions
(A & B) Schematic and graph representation showing that three cell fates including the G1-S transition (cycling state), reversible G1 arrest (non-cycling state) and prolonged arrest (non-cycling state...
Figure images are served from the NIH/NLM PubMed Central Open Access Subset or Europe PMC; copyright remains with the publishers and authors.
💬 Discussion
0 commentsNo comments yet. Be the first to start a discussion!
Leave a Comment