Abstract
BACKGROUND: Light microscopy is of central importance in cell biology. The recent introduction of automated high content screening has expanded this technology towards automation of experiments and performing large scale perturbation assays. Nevertheless, evaluation of microscopy data continues to be a bottleneck in many projects. Currently, among open source software, CellProfiler and its extension Analyst are widely used in automated image processing. Even though revolutionizing image analysis in current biology, some routine and many advanced tasks are either not supported or require programming skills of the researcher. This represents a significant obstacle in many biology laboratories. RESULTS: We have developed a tool, Enhanced CellClassifier, which circumvents this obstacle. Enhanced CellClassifier starts from images analyzed by CellProfiler, and allows multi-class classification using a Support Vector Machine algorithm. Training of objects can be done by clicking directly "on the microscopy image" in several intuitive training modes. Many routine tasks like out-of focus exclusion and well summary are also supported. Classification results can be integrated with other object measurements including inter-object relationships. This makes a detailed interpretation of the image possible, allowing the differentiation of many complex phenotypes. For the generation of the output, image, well and plate data are dynamically extracted and summarized. The output can be generated as graphs, Excel-files, images with projections of the final analysis and exported as variables. CONCLUSION: Here we describe Enhanced CellClassifier which allows multiple class classification, elucidating complex phenotypes. Our tool is designed for the biologist who wants both, simple and flexible analysis of images without requiring programming skills. This should facilitate the implementation of automated high-content screening.
🔬 Techniques
✨ Fluorophores
🧪 Sample Preparation
🔬 Cell Lines
💻 Software Details
🏛️ Research Organizations (ROR)
Affiliated research institutions:
📊 Figures
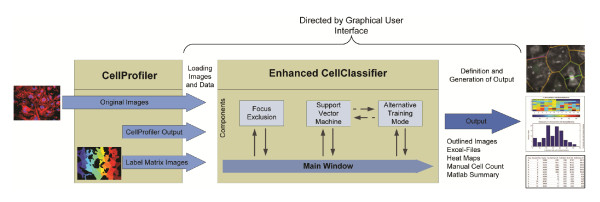
Figure 1
Schematic view of the workflow in CellClassifier . As an input, the tool needs the original microscopy images, as well as output files and label matrix images produced by CellProfiler. The interaction...
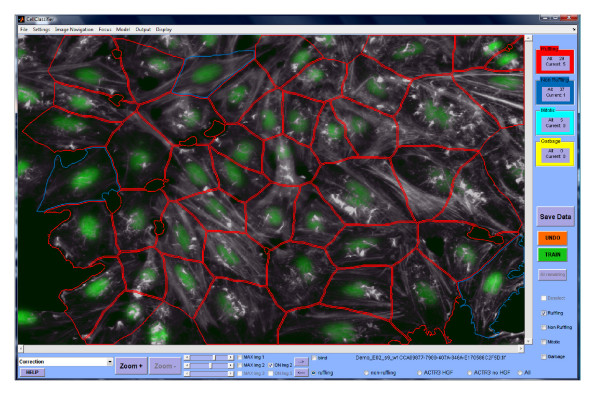
Figure 2
CellClassifier program: Screenshot of the main window . The program is currently in the correction mode, which shows the predictions of the current mode, allowing the user to correct. Red outlines: ru...
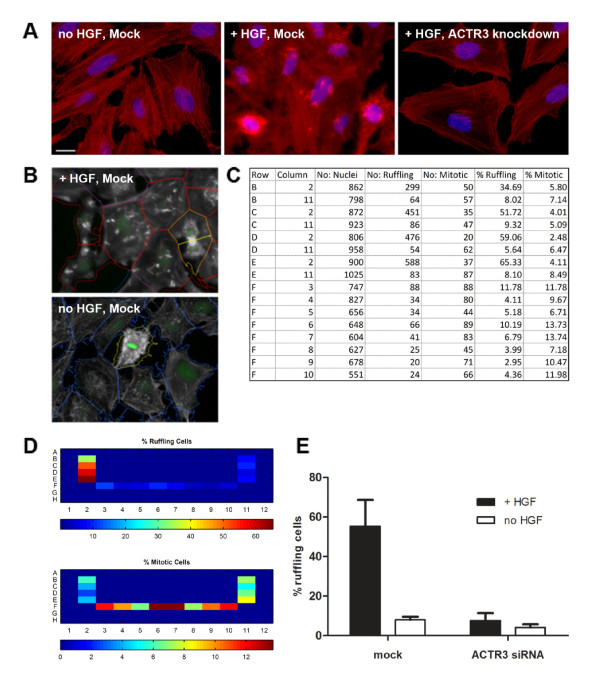
Figure 3
HGF-induced ruffling . A : HeLa-cells were pre-treated either under Mock-conditions or with an siRNA directed against the mRNA of the ACTR3 component of the Arp2/3 complex. Later, HGF was added, where...
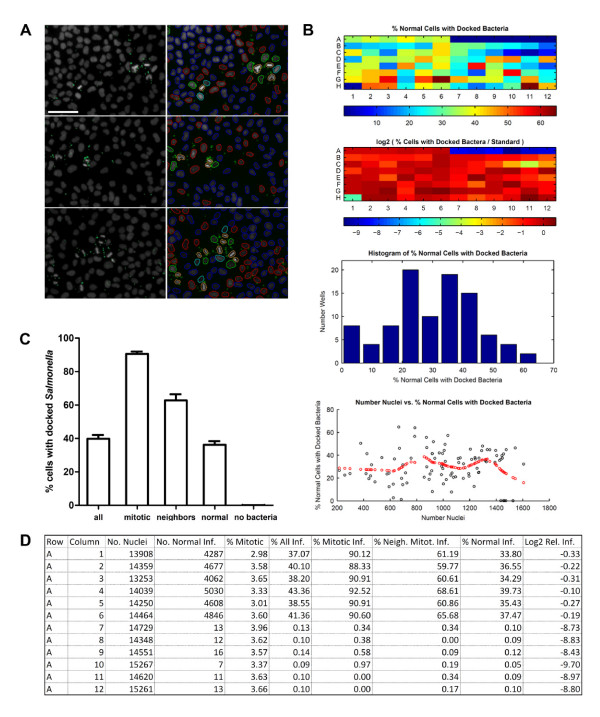
Figure 4
Feature integration by CellClassifier . A : Salmonella (shown in green) preferentially dock onto mitotic cells (nuclei shown in grey). Segmentation and measurements of image were done using CellProfil...
Figure images are served from the NIH/NLM PubMed Central Open Access Subset or Europe PMC; copyright remains with the publishers and authors.
💬 Discussion
0 commentsNo comments yet. Be the first to start a discussion!
Leave a Comment