Abstract
This study examines key elements of glutamatergic transmission within sensory ganglia of the rat. We show that the soma of primary sensory neurons release glutamate when depolarized. Using acute dissociated mixed neuronal/glia cultures of dorsal root ganglia (DRG) or trigeminal ganglia and a colorimetric assay, we show that when glutamate uptake by satellite glial cells (SGCs) is inhibited, KCl stimulation leads to simultaneous increase of glutamate in the culture medium. With calcium imaging we see that the soma of primary sensory neurons and SGCs respond to AMPA, NMDA, kainate and mGluR agonists, and selective antagonists block this response. Using whole cell patch-clamp technique, inward currents were recorded from small diameter (<30 µm) DRG neurons from intact DRGs (ex-vivo whole ganglion preparation) in response to local application of the above glutamate receptor agonists. Following a chronic constriction injury (CCI) of either the inferior orbital nerve or the sciatic nerve, glutamate expression increases in the trigeminal ganglia and DRG respectively. This increase occurs in neurons of all diameters and is present in the somata of neurons with injured axons as well as in somata of neighboring uninjured neurons. These data provides additional evidence that glutamate can be released within the sensory ganglion, and that the somata of primary sensory neurons as well as SGCs express functional glutamate receptors at their surface. These findings, together with our previous gene knockdown data, suggest that glutamatergic transmission within the ganglion could impact nociceptive threshold.
🔬 Techniques
✨ Fluorophores
🧪 Sample Preparation
🔬 Cell Lines
🏭 Microscope Brands
🧪 Reagent Suppliers
📷 Detectors
💻 Software Details
🏛️ Research Organizations (ROR)
Affiliated research institutions:
📋 Methods
Animals Adult male
Sprague-Dawley rats were used. For CCI-surgery the rats weighed 270–290 grams and for DRG culture 150–200 grams. All animals were housed on a 12-hour light–dark cycle and given food and water ad libitum .
Ethics
Procedures for the maintenance and use of the experimental animals conformed to the regulations of UCSF Committees on Animal Research and were carried out in accordance with the guidelines of the NIH regulations on animal use and care (Publication 85-23, Revised 1996). The UCSF Institutional Animal Care and Use Committee approved the protocols used in this study. Surgery Chronic Constriction Injury (CCI) of the INFRA-orbital NERVE (ION) The procedure for CCI of the ION has been described in detail previously [31] . Briefly, rats were anesthetized with a mixture of 90 mg/kg ketamine (Fort Dodge Animal Health, Overland Park, KS, USA) and 10 mg/kg xylazine (Akorn Inc., Gurnee, IL, USA) and placed in a stereotaxic head holder. Forty percent oxygen was delivered through a facemask. The skull and nasal bone were exposed through a 2 cm supra-orbital skin incision. The superficial muscle was detached from the superior edge of the orbit. Gentle retraction of the orbital contents exposed the ION. Two 5-0 chromic gut ligatures were loosely tied 2 mm apart around the exposed nerve using the operating microscope and microsurgical techniques. For sham-operated animals, the ION was exposed but no ligatures were placed. The skin incision was closed using interrupted 6-0 silk sutures. Chronic Constriction Injury (CCI) of the Sciatic Nerve (SN) We followed the procedure as originally described by Bennett [32] . Surgery was carried out on rats placed under anesthesia using 2% isoflurane (Solvay, Mendota Height, MN, USA) and 40% oxygen delivered through a facemask. The middle third of the left sciatic nerve was exposed through a 1.5 cm longitudinal skin incision. Four 4-0 chromic gut ligatures (Ethicon, Somerville, NJ, USA) were loosely tied around the sciatic nerve using the operating microscope and microsurgical techniques. The skin was then closed with interrupted 3-0 silk sutures. Tissue Processing Histology. Rats were perfused at 4, 7, and 14 days after CCI-ION and at 7 and 21 days after CCI-SN under pentobarbital anesthesia (100 mg/kg i.p.). Perfusions were performed transcardially with 400 mL Tyrode’s solution followed by 400 mL of 4% paraformaldehyde in phosphate buffer at pH 7.4. Both the ipsilateral and contralateral trigeminal ganglia or lumbar dorsal root ganglia, along with samples of brain and spinal cord, were removed and post-fixed in 4% paraformaldehyde for 3–5 hours, and then cryo-protected with 30% sucrose in PBS (pH = 7.4) for at least 48 hours. Ganglia from different rats were embedded in the same block and cut together to minimize processing variation for quantification. Ten microns (10 µm) longitudinal sections of ganglia were cut with a cryostat.
Show full methods section
Animals Adult male
Sprague-Dawley rats were used. For CCI-surgery the rats weighed 270–290 grams and for DRG culture 150–200 grams. All animals were housed on a 12-hour light–dark cycle and given food and water ad libitum .
Ethics
Procedures for the maintenance and use of the experimental animals conformed to the regulations of UCSF Committees on Animal Research and were carried out in accordance with the guidelines of the NIH regulations on animal use and care (Publication 85-23, Revised 1996). The UCSF Institutional Animal Care and Use Committee approved the protocols used in this study. Surgery Chronic Constriction Injury (CCI) of the INFRA-orbital NERVE (ION) The procedure for CCI of the ION has been described in detail previously [31] . Briefly, rats were anesthetized with a mixture of 90 mg/kg ketamine (Fort Dodge Animal Health, Overland Park, KS, USA) and 10 mg/kg xylazine (Akorn Inc., Gurnee, IL, USA) and placed in a stereotaxic head holder. Forty percent oxygen was delivered through a facemask. The skull and nasal bone were exposed through a 2 cm supra-orbital skin incision. The superficial muscle was detached from the superior edge of the orbit. Gentle retraction of the orbital contents exposed the ION. Two 5-0 chromic gut ligatures were loosely tied 2 mm apart around the exposed nerve using the operating microscope and microsurgical techniques. For sham-operated animals, the ION was exposed but no ligatures were placed. The skin incision was closed using interrupted 6-0 silk sutures. Chronic Constriction Injury (CCI) of the Sciatic Nerve (SN) We followed the procedure as originally described by Bennett [32] . Surgery was carried out on rats placed under anesthesia using 2% isoflurane (Solvay, Mendota Height, MN, USA) and 40% oxygen delivered through a facemask. The middle third of the left sciatic nerve was exposed through a 1.5 cm longitudinal skin incision. Four 4-0 chromic gut ligatures (Ethicon, Somerville, NJ, USA) were loosely tied around the sciatic nerve using the operating microscope and microsurgical techniques. The skin was then closed with interrupted 3-0 silk sutures. Tissue Processing Histology. Rats were perfused at 4, 7, and 14 days after CCI-ION and at 7 and 21 days after CCI-SN under pentobarbital anesthesia (100 mg/kg i.p.). Perfusions were performed transcardially with 400 mL Tyrode’s solution followed by 400 mL of 4% paraformaldehyde in phosphate buffer at pH 7.4. Both the ipsilateral and contralateral trigeminal ganglia or lumbar dorsal root ganglia, along with samples of brain and spinal cord, were removed and post-fixed in 4% paraformaldehyde for 3–5 hours, and then cryo-protected with 30% sucrose in PBS (pH = 7.4) for at least 48 hours. Ganglia from different rats were embedded in the same block and cut together to minimize processing variation for quantification. Ten microns (10 µm) longitudinal sections of ganglia were cut with a cryostat.
Immunohistochemistry
Optimal dilutions and incubation times for all primary and secondary antibodies were determined prior to use and control sections with the primary antibody omitted were used to test for antibody specificity. All slides to be compared for quantification were processed at the same time. The following primary antibodies were used at the corresponding dilutions: rabbit anti-glutamate 1∶8000 (#1766 Arnel Products Co., Inc, NY, USA); mouse anti-beta III tubulin, 1∶20,000 (#G7121, Promega, Madison, WI, USA); rabbit anti-activating transcription factor 3 (ATF3), 1∶800 (#sc-188, Santa Cruz, Dallas, TX, USA); rabbit anti-glutamine synthetase 1∶25000 (#G2781, Sigma, St. Louis, MO, USA); mouse anti-glutamine synthetase, 1∶1000 (#MAB302, Chemicon/Millipore, Billerica, MA, USA); rabbit anti-cellubrevin 1∶500, (#104103, Synaptic Systems, Goettingen, Germany); rabbit anti-SNAP25, 1∶500 (#111002 Synaptic system, Goettingen, Germany); guinea pig anti-synaptobrevin-2 1:200 (#104204, Synaptic Systems, Goettingen, Germany); rabbit anti-SCAMP1 1:400 (#121002, Synaptic Systems, Goettingen, Germany); rabbit anti-NMDA receptor-1 (NR2A) 1∶1000 (AB9864, Millipore, Billerica, MA, USA); rabbit anti-GluR6 (GluK2) 1∶5000 (ab124702, Abcam, Cambridge, MA); rabbit anti-GluR4 (GluA4) 1∶500 (#AB1508, Millipore, Billerica, MA, USA); guinea pig anti-mGluR8 1:2000 (#AB5362, Chemicon/Millipore, Billerica, MA, USA). The tissue was incubated in primary antibodies at room temperature overnight, then washed 3 4 times before being incubated for 30 minutes in a humidified chamber with species-specific secondary antibodies conjugated to FITC or CY3 and diluted 1∶500. The slides were then washed and cover-slipped with Vector shield mounting medium plus DAPI. Slides were analyzed on both a conventional fluorescence microscope and a confocal microscope.
Behavioral Testing
CCI of ION; von Frey Hair testing. Three von Frey hairs of increasing stiffness, 2, 10, and 50 g were used. Five or six consecutive applications were performed at 5 s intervals on different areas of the vibrissal pad and in the perioral and perinasal territory. The observer scored the behavioral response of the rats based on the method of Vos et al. [33] as follows: 0, no detection; 1, detection and exploration of the von Frey hair (sniffing, licking); 2, head withdrawal and/or single grabbing movement; 3, attack (includes biting) and/or escape (includes burrowing) and/or multiple grabbing movements; and 4, active asymmetrical grooming (at least three face wash strokes) directed toward the stimulated facial area. For each hair, the highest score was recorded and the results are presented as the average of the scores obtained from the three different hairs. The average value is presented because the analysis of scores from each hair separately gave the same results when compared between groups. CCI of the sciatic nerve SN; von Frey Hair testing Testing was done with a von Frey hair algometer [34] . Briefly, individual rats were placed in a Plexiglas enclosure (30×35×13.5 cm) equipped with a metal grid floor with openings of 0.6×0.6 cm. A hand-held transducer with a 1.0-mm nylon probe was gently applied through the metal grid to the plantar aspect of each hindpaw and progressively pushed vertically until a paw withdrawal occurred or cut-off was reached (100 g). The applied force was displayed on a meter attached to the transducer (IITC, Inc., model 1601, www.iitcinc.com ).
Cell Culture Male
Sprague-Dawley rats (150–200 grams) were anaesthetized with pentobarbital (40 mg/kg, i.p.) and lumbar levels of spinal cord dorsal root ganglia were dissected and placed into DMEM/10% FBS containing penicillin (100 U/ml) and streptomycin (100 µg/ml), followed by three-hour incubation at 37°C and 5% CO 2 with 0.125% collagenase B (Roche, Indianapolis, IN, USA), then 30 minutes additional incubation with 0.25% trypsin (Sigma, St. Louis, MO, USA). Afterward DNase I (90 µg/mL; Sigma, St. Louis, MO, USA) and soybean trypsin inhibitor (100 µg/mL; Sigma, St. Louis, MO, USA) were added, and the cells dispersed by trituration using a flame-polished salinized (4% dimethyl-dichlorosilane in toluene) Pasteur pipette. The resulting cell suspension was centrifuged 1200 rpm (96×g, 20°C) through a cushion of 15% bovine serum albumin (BSA) (Sigma, St. Louis, MO, USA) in order to eliminate most of the cellular debris. The cell pellet was re-suspended in DMEM and centrifuged to remove the BSA. Using a hemocytometer to determine neurons density, we seeded 5000 neurons per well onto glass 12 mm cover slips pre-coated with poly-DL-ornithine (500 µg/mL; Sigma, St. Louis, MO, USA) and laminin (5 µg/mL; Sigma, St. Louis, MO, USA) in 24-well tissue culture plates at 37°C and 5% CO 2 . Cells were fixed after 24 hours for immunocytochemistry staining. For the Ca 2+ imaging experiments, mixed cultures were plated on 35 mm diameter coverslips in 6-well culture plates and used for experiments within 24 to 48 hours.
Glutamate Measurement
Glutamate levels in culture were detected using an enzymatic assay similar to that described by Akagi and colleagues [35] . In the presence of glutamate, glutamate oxidase reduces NAD + to NADH and produces α-ketoglutarate, NH 4 + , and H 2 O 2 . The Amplex® UltraRed reagent (Invitrogen, Grand Island, NY, USA) reacts with H 2 O 2 in the presence of horseradish peroxidase to produce bright fluorescence with long-wavelength spectra (Ex. 568 nm, Em. 581 nm) [35] that can be measured in a spectrofluorometer. DRG mixed cultures described above were seeded in 96 well plates at a density of 30,000 neurons per well. Due to the high density of neurons in each well, the culture medium was changed every 6–8 hours for 3 days. To avoid glia over population, we used neurobasal and SM2 as the feeding medium to maintain healthy neurons and prevent overgrowth of the SGC population. Three different treatments were included in this study. Group 1 had no KCl stimulation to serve as a control. Group 2 received 100 µM KCl to activate neurons. Group 3 was pretreated with DL- threo -β-Benzyloxyaspartic acid (TBOA 100 µM, Tocris, Minneapolis, MN, USA) for 2 hours, which blocks glutamate uptake, followed by KCl stimulation. All reaction agents, excluding TBOA, were diluted in HEPES medium (mM: 129 NaCl, 5 KCl, 2 CaCl 2 , 1 MgCl 2 , 30 glucose, 25 HEPES) and pH-adjusted to 7.4 with NaOH. TBOA was incubated with culture medium for 2 hours in group 3 cells prior to KCl stimulation. Procedure: After 72 hours culture, the medium in all three groups was replaced with fresh incubation media containing glutamate oxidase (0.05 U/mL; Sigma, St. Louis, MO) and NAD + (1 mM; Sigma, St. Louis, MO, USA) with or without KCl (100 µM). Standard solutions of HEPES containing glutamate (0–80 µM) containing glutamate oxidase and NAD + were used to determine a concentration curve. Two minutes later, the incubation medium was collected from each well and 1 U/ml horseradish peroxidase (Sigma, St. Louis, MO, USA) and 50 µM Amplex® UltraRed (Molecular Probes Inc., Eugene, OR, USA) were added to each sample. Fluorescence intensity was measured by spectrofluorometry (FlexStation 3, Molecular Devices, LLC, Sunnyvale, CA, USA). Protein concentrations were measured with Pierce BCA Protein Assay Kit (Thermo Scientific, Rockford, IL, USA). One-way ANOVA was used to determine if there was significance between groups and Newman-Keuls post hoc test were carried out. Each column represents the mean ± S.E.M. of total 6 wells/condition, two different cultures from two different animals.
Calcium Imaging
All drugs used in the in vitro experiments, unless indicated otherwise, were purchased from Tocris (Tocris, Minneapolis, MN, USA). DRG mixed cultures (obtained as above) were loaded with 1 µM of Ca 2+ indicator Fura-2AM and 1 µM of Pluronic F-127 (Life Technologies, Carlsbad, CA, USA) and incubated at 37°C for one hour. After washing off excess dye, cells were allowed to complete de-esterfication for at least 30 minutes at 37°C. DRG mixed cultures were then placed in a recording chamber (POCmini Chamber system, PeCon, Erbach, Germany) and continuously perfused with normal bath solution (mM: 129 NaCl, 5 KCl, 2 CaCl 2 , 1 MgCl 2 , 30 glucose, 25 HEPES) and pH-adjusted to 7.4 with NaOH [36] using a perfusion system (AutoMate Scientific, Berkeley, CA, USA). Fluorescence data were acquired using Piper control software via a CCD camera at 3 frames/second (XR/MEGA-10, Stanford Photonics Inc., Palo Alto, CA, USA). The level of intracellular Ca 2+ ([Ca 2+ ] i ) elicited by stimuli were measured by the ratio of the emission (510 nm) from Fura-2 excitation at 340 nm and 380 nm. The [Ca 2+ ] i concentration induced by ionomycin at the end of each experiment was taken as the maximum 340/380 ratio and set as 1. All drugs to be tested were applied directly using a hand-held Eppendorf pipette. The chamber contained 1 ml of HEPES to which the drug was added diluted in 500 µl of HEPES to giving the target concentration indicated in Table 1 . Prior to drug application, 500 µl of HEPES buffer was infused to control for mechanical calcium transients. The target concentrations in the chamber for all agonists were: Glutamate (200 µM), AMPA (50 µM), NMDA (100 µM), DHPG (mGluR group I agonist, 100 µM), and kainic acid (KA) (30 µM). The concentrations of the respective antagonists were: CNQX (100 µM), APV (100 µM), AP3 (1 mM) and UBP310 (0.5 µM). Cells were recorded for baseline HEPES medium (prior to drug application) for at least 5 minutes, then the agonist applied and they were recorded for 10 minutes. After washing for 10 minutes, the antagonists CNQX, APV, AP3, UBP310 were then individually applied for 10 minutes prior to a second application of the appropriate agonist. Next, following a 10-minute wash, KCl (50 mM) was perfused for 2 minutes to identify the neuronal population. Lastly, ionomycin (20 µM) was added to the medium to verify the viability of cells. Cells that did not respond to ionomycin were excluded from the experiment. 10.1371/journal.pone.0068312.t001 Table 1 Agonists and antagonists used in calcium image and patch clamp experiments. Agonist Calcium Image Ex-vivo Patch Clamp Antagonist Calcium Image Ex-vivo Patch Clamp Glutamate 200 µM 1 mM APV+CNQX - 50 µM+10 µM NMDA 100 µM 100 µM APV 100 µM 50 µM AMPA 50 µM 100 µM CNQX 100 µM 10 µM KA 30 µM 100 µM UBP310 0.5 µM 0.5 µM DHPG 100 µM 1 mM AP3 1 mM 60 µM KA (kainic acid, kainate receptor agonist), DHPG (mGluR1/5 agonist), APV (NMDA antagonist), CNQX (AMPA/Kainate receptor antagonist), AP3 (mGluR1/5 antagonist), UBP310 (Kainate receptor specific antagonist). Baseline value were acquired by averaging the 340/380 ratio 10 seconds prior to drug application and compared to the peak value which is 10 seconds of the maximum peaks response following drug application. The equation to get the % increase response from baseline is: (peak value – baseline value)/baseline value x100. The ratio of 340/380 responses to drugs between neurons and glia was compared before and after glutamate was added using paired Student’s t - test. The same test was also used to determine the difference between agonist effect alone and agonist effect in the presence of the antagonist for the same cell. Intact Dorsal Root Ganglion (ex-vivo) Preparation and Whole Cell Patch Clamp Recording For collecting intact DRGs, rats were first deeply anaesthetized with pentobarbital (40 mg/kg, i.p.). The L4 and L5 DRG were removed and placed into artificial cerebral spinal fluid (aCSF). The aCSF contained (in mM): 124 NaCl, 2.5 KCl, 1.2 NaH 2 PO 4 , 1.0 MgCl 2 , 2.0 CaCl 2 , 25 NaHCO 3 and 10 glucose in sterile preservative free deionized water. The connective tissue surrounding the DRG was carefully removed under high magnification, and then the ganglia were incubated with a mixture of 0.4 mg/mL trypsin and 1.0 mg/mL type-A collagenase (Sigma, St. Louis, MO USA) for 40 minutes at 37°C to remove the remaining epineurium. The ganglia were then incubated in aCSF bubbled with 95% O 2 and 5% CO 2 at room temperature for at least 1 hour before being transferred to the recording chamber. Neurons were visualized with a 40X water-immersion objective using a microscope (FN-600, Nikon, Japan) equipped with infrared differential interference contrast optics. The image was detected with an infrared-sensitive CCD (IR-1000, Dage MTI, USA) and displayed on a monochrome video monitor. Whole-cell current recordings were acquired with an Axon200B amplifier (Molecular Devices, Sunnyvale, CA, USA). Patch pipettes were pulled from borosilicate glass capillaries (BF150-86-10, Sutter Instruments) on a puller (P97, Sutter Instruments, Novato, CA, USA). The resistance of the pipette was 4–5 MΩ when filled with the pipette solution which contained (in mM): 140 KCl, 2 MgCl 2 , 10 HEPES, 2 Mg-ATP, 0.5 Na 2 GTP, pH = 7.4. Osmolality was adjusted to 290–300 mOsm. After a giga seal was established, the membrane was broken and neurons with a resting membrane potential below −50 mV were selected for further study. The access resistance was 10–20 MΩ and continuously monitored and data were discarded if the access resistance changed more than 15% during an experiment. For all agonists induced currents, the neurons were clamped at −70 mV except for NMDA neurons, which were clamped at −40 mV. Data were acquired with a Digidata 1440 A acquisition system (Molecular Devices) and pCLAMP 10.2 software (Molecular Devices). Signals were low-pass filtered at 5 kHz, sampled at 10 kHz, and analyzed offline. Drug application All drugs used in the ex-vivo experiments were purchased from Tocris (Tocris, Minneapolis, MN, USA). Drugs were dissolved in ultra-pure deionized water as stock solutions and refrigerated for later use. All stock solutions were diluted with aCSF before use. Table 1 shows the target concentration of glutamate (1 mM), AMPA (100 µM), NMDA (100 µM), KA (100 µM) and DHPG (1 mM) were applied with focal pressure ejection via a puffer pipette controlled by a Picospitzer II (200 ms puff at 1–2 psi; General Valve Inc) to activate the receptors. The corresponding receptor antagonists ( Table 1 ), APV (50 µM)+CNQX (10 µM ), APV (50 µM), CNQX (10 µM), AP3 (60 µM) and UBP310 (0.5 µM) were bath-applied for at least 5 minutes to test the blocking effect. In order to test the blocking effect of receptor antagonists, the responses induced by each agonist before antagonist application were set as 100%, and the currents after antagonist application were expressed as the percentage of previous response. All results were presented as the mean ± SEM. The paired Student’s t - test was used to compare agonist induced inward currents and antagonists induced inward currents. Tau of decay is calculated as the time from 100% of peak value to 50% of peak value.
Quantification of Glutamate Expression
Quantification was done on images taken at the same magnification from glass slides that contained sections of the sensory ganglia ipsilateral and contralateral to the CCI. All images were acquired using the same microscope and camera setting. The Image J (version 1.44, rsbweb.NIH.gov/IJ/) software was used to determine a threshold (see Results) for which glutamate staining was considered to be above background. The same threshold was then used for all ganglia on the same slide that included both ipsilateral and contralateral ganglia from all time points. For each slide a new threshold was set in order to normalize for variation in tissue processing. The total number of pixels was determined for each section to quantify the glutamate staining (i.e. above threshold). For measuring changes in glutamate immunolabeling related to cell size, the area was calculated from the measured diameter of those cells above background in which the nucleus was visible. For quantification on the trigeminal ganglia we used 3 sections per rat (2 sham and 3 CCI-ION animals per group). For DRG glutamate expression quantification we used 3 sections at each spinal level from 3 animals at 7 and 21 days post CCI. Cells were characterized as small if their cross-sectional surface area was less than 800 µm 2 , medium if the area was 800–1800 µm 2 , and large if the area greater than 1800 µm 2 [37] . Percent changes in immunoreactive pixel area from paired ipsi/contralateral sides for each sensory ganglion were compared using individual Student’s t - test for each time point (4, 7 or 14 days).
Supporting Information Figure S1 Immunocytochemistry of some proteins associated with glutamate vesicle-packaging and release. Each row of images (A–D) show the vesicle associated protein, SGCs labeled with glutamine synthetase and the merged image. Some of these proteins are found only in neurons (SNAP25, A), some only in SGCs (Cellubrevin, C) and other occur in both cell types (synaptobrevin, B and secretory carrier-associated membrane protein 1 [SCAMP1], D). Scale bar: A, C, D = 10 µm, B = 30 µm. (TIF) Click here for additional data file. Figure S2 Immunocytochemistry of glutamate receptor expression in sensory ganglia. Some of the glutamate receptors are found in both neurons and SGCs (NR2A, A; GluA4, C3; mGluR8, D3). Subunit GluK2 of kainate receptors is found only in SGCs (B). Double label of glutamine synthetase (GS) a marker for SGCs and GluA4 or mGluR8 are shown from C1to C3 and D1 to D3 respectively. Arrows: SGCs, Arrow head: SGC nucleus. Scale bar: A = 30 µm, B = 25 µm, C, D = 30 µm. (TIF) Click here for additional data file.
📊 Figures
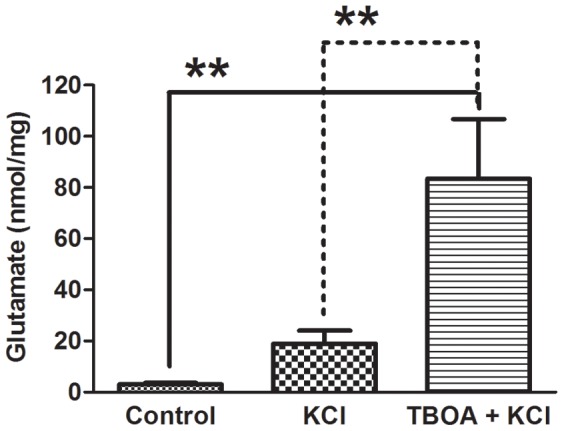
Figure 1
Glutamate assay of dissociated DRG cultures.
Colorimetric assay shows that following KCl (100 u00b5M) application to the culture medium there was an increase in glutamate release which did not reach significance compared to control (no stimulus/...
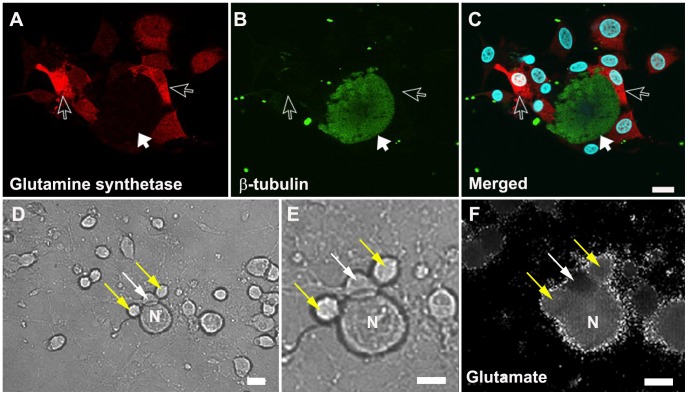
Figure 2
Confocal and calcium influx images of a 24-hour DRG primary mixed culture.
Au2013C confocal image showing SGCs (red: glutamine synthetase an SGC marker, open arrow), neuron (green: u03b2-tubulin, solid arrow) and nucleus (blue: DAPI). Du2013F representative pictures from a 2...
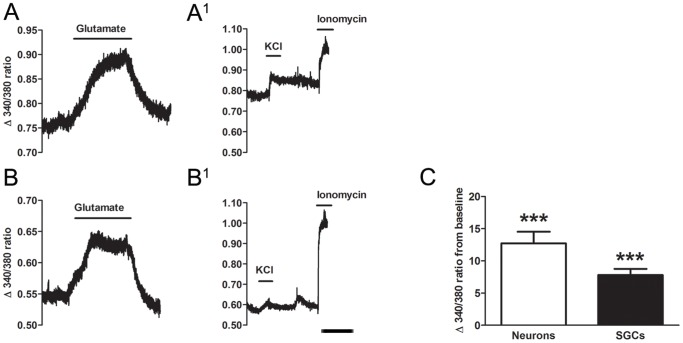
Figure 3
Representative calcium imaging fluorescent traces of a neuron and SGC.
A, B, following application of 200 u00b5M glutamate both neurons and SGCs showed an increased fluorescent ratio during the 10 minutes of recording. A 1 , B 1 after washing with HEPES buffer, KCl (50 m...
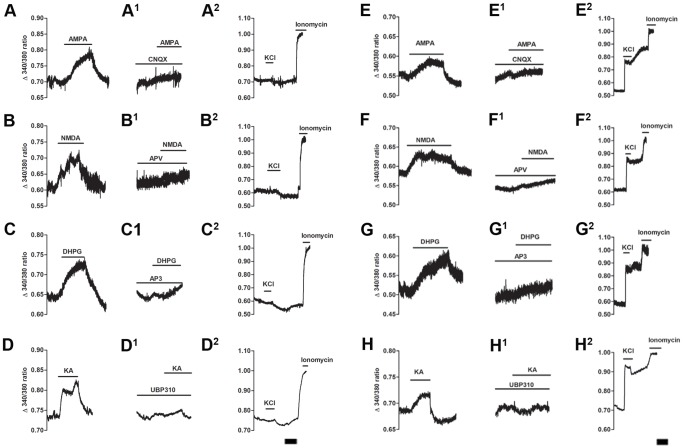
Figure 4
Representative calcium imaging traces of SGCs and neurons following application of glutamate agonists and antagonists.
Following direct application of A: AMPA (50 u00b5M), B: NMDA (100 u00b5M), C: DHPG (100 u00b5M) and D: KA (30 u00b5M) both neurons and SGCs responded to all three agonists. Following a HEPES buffer wa...
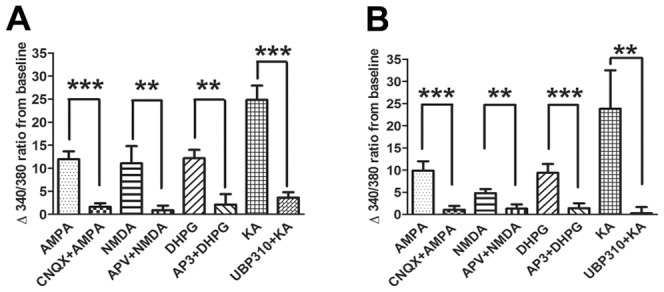
Figure 5
Summary data of calcium imaging experiment on glutamate receptor activation.
Effects of each agonist were significantly blocked in the presence of their respective antagonists (A, SGCs; B, neurons) in calcium imaging experiments. Pre-treatment of the selective appropriate anta...
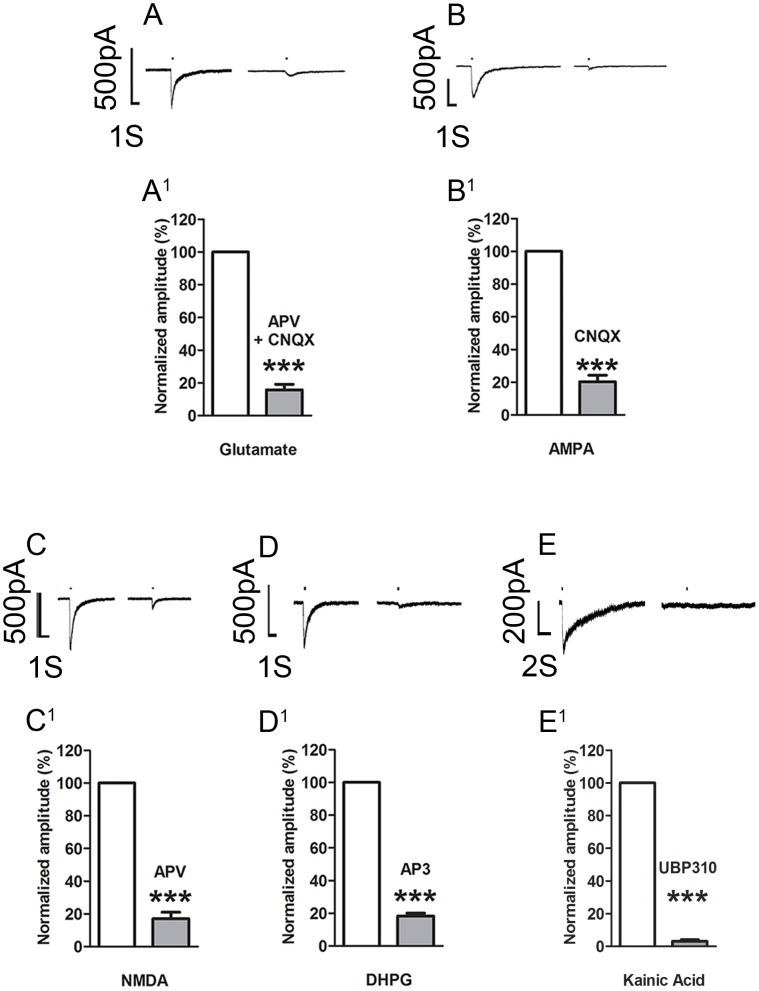
Figure 6
Whole cell patch recordings of small neurons from ex-vivo dorsal root ganglia.
Au2013E, puff application of glutamate or the receptor selective agonists induced inward currents which were blocked (right trace) by bath application of the appropriate selective antagonist(s). A 1 u...
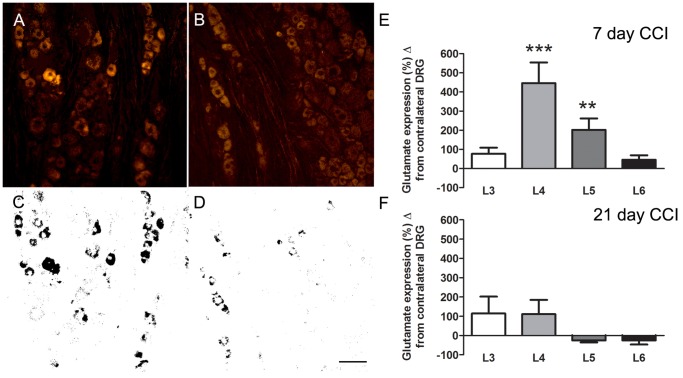
Figure 7
Representative images from an L4 DRG immunostained for glutamate following CCI of the sciatic nerve.
Increased glutamate immunolabeling is seen in the DRG ipsilateral to the sciatic CCI (A standard, C thresholded image) compared to the contralateral side (B standard, and D thresholded image). E, F sh...
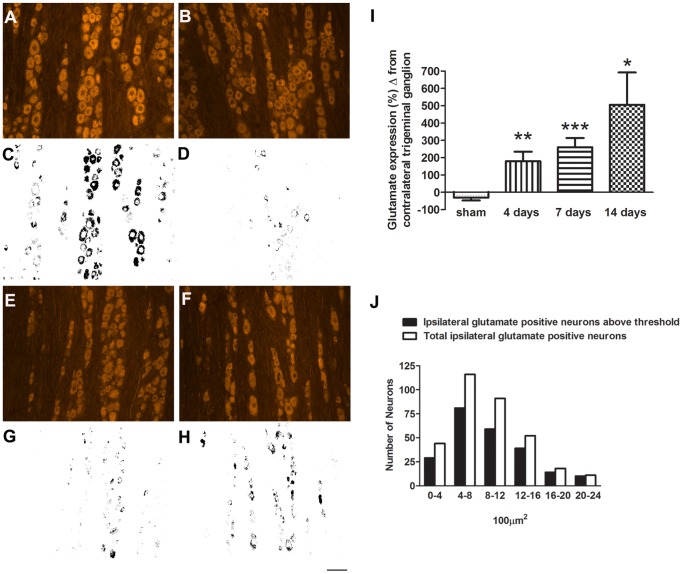
Figure 8
Representative images from a trigeminal ganglion immunostained for glutamate following CCI of the ION.
Increased glutamate immunolabeling is seen in the trigeminal ganglion ipsilateral to the CCI (A, standard, C, thresholded image) compared to the contralateral side (B, standard, D, thresholded image)....
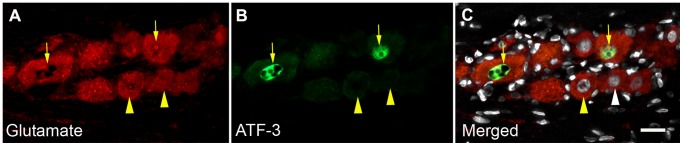
Figure 9
Relation between injured neurons and change in glutamate expression.
Seven days following CCI of the inferior orbital nerve many neurons show increased levels of glutamate immunosignal (A, arrows and see Figure 8 ). Not all these cells are double labeled for ATF3 (B, a...
Figure images are served from the NIH/NLM PubMed Central Open Access Subset or Europe PMC; copyright remains with the publishers and authors.
💬 Discussion
0 commentsNo comments yet. Be the first to start a discussion!
Leave a Comment