Abstract
Uropathogenic E. coli (UPEC), which cause urinary tract infections (UTI), utilize type 1 pili, a chaperone usher pathway (CUP) pilus, to cause UTI and colonize the gut. The pilus rod, comprised of repeating FimA subunits, provides a structural scaffold for displaying the tip adhesin, FimH. We solved the 4.2 Å resolution structure of the type 1 pilus rod using cryo-electron microscopy. Residues forming the interactive surfaces that determine the mechanical properties of the rod were maintained by selection based on a global alignment of fimA sequences. We identified mutations that did not alter pilus production in vitro but reduced the force required to unwind the rod. UPEC expressing these mutant pili were significantly attenuated in bladder infection and intestinal colonization in mice. This study elucidates an unappreciated functional role for the molecular spring-like property of type 1 pilus rods in host-pathogen interactions and carries important implications for other pilus-mediated diseases.
🔬 Techniques
🧬 Organisms
✨ Fluorophores
🧪 Sample Preparation
🏭 Microscope Brands
🧪 Reagent Suppliers
🔎 Objectives
💻 Software Details
💻 Code & Software
💾 Data Repositories
🏛️ Research Organizations (ROR)
Affiliated research institutions:
📋 Methods
Ethics statement The Washington University Animal Studies
Committee approved all procedures used for the mouse experiments described in the present study. Overall care of the animals was consistent with The Guide for the Care and Use of Laboratory Animals from the National Research Council and the USDA Animal Care Resource Guide . Bacteria, cloning, mutagenesis The BW25113 fimA gene sequence was cloned between the EcoRI and BamHI restriction sites in pTRC99A using standard PCR cloning techniques to create plasmid pTRC-fimA. Mutations were made within this plasmid using appropriate complementary primers to engineer codon changes in the template, pTRC-fimA, using Pfx polymerase and manufacturers instructions for PCR, followed by DpnI treatment of the resulting products to remove the methylated template before transformation into C600. Mutations were verified by sequencing. Mutant plasmids were transformed into UTI89-LON , ∆fimA for expression and functional studies as indicated. In order to construct point mutations in the fimA allele in the UTI89 chromosome, the UTI89 fimA gene was deleted using a previously published technique that allows for flawless integration ( Khetrapal et al., 2016 ). Briefly, fimA was deleted by homologous recombination using pSLC- 217 as a template and primers containing 50 bp of homology to flanking regions of fimA . A deletion was then constructed using the previously described Red Recombinase method that would allow for reinsertion of constructs into the fimA site. Concurrently, a copy of UTI89 fimA was cloned into pTRC99a. Point mutations were then introduced into this construct using site directed mutagenesis. PCR fragments from confirmed mutants, and the WT allele, were reintegrated into the UTI89-LON, ∆ fimA mutants constructed above at the original deletion site. Successful reintegration events were sequenced to confirm flawless integration and mutation presence. Mouse studies Animals were maintained in a single room in our vivarium. Prior to and after infection all animals received PicoLab Rodent Diet 20 (Purina) ad libitum . All animals were maintained under a strict light cycle (lights on at 0600 hr, off at 1800 hr). Mice were acquired from indicated vendors and randomly placed into cages (n = 5 mice/cage) by employees of Washington University’s Division of Comparative Medicine (DCM); no additional methods for randomization were used to determine how animals were allocated to experimental groups. Investigators were not blinded to group allocation during experiments. For bladder infections, 6 week old female C3H/HeN mice were obtained from Envigo and were maintained in our vivarium for one week prior to infection. Bladder infections were performed via transurethral inoculation ( Hung et al., 2009 ). UPEC strains were prepared for inoculation as described previously ( Hung et al., 2009 ). Briefly, a single UTI89 colony was inoculated in 20 mL of Luria Broth (LB) and incubated at 37°C under static conditions for 24 hr. Bacteria were then diluted (1:1000) into fresh LB and incubated at 37°C under static conditions for 18–24 hr. Bacteria were subsequently washed three times with PBS and then concentrated to ~1×10 8 CFU per 100 μL for intestinal infections and ~1×10 8 CFU per 50 μL for bladder infections. Bacteria were subsequently washed three times with PBS and then concentrated to ~1×10 8 CFU per 50 μL for bladder infections. For intestinal colonization experiments, 6 week old female C3H/HeN mice were obtained from Envigo and were maintained in our vivarium for no more than 2 days prior to intestinal colonization. Mice received a single dose of streptomycin (1000 mg/kg in 100 μL water by oral gavage (PO)) followed 24 hr later by an oral gavage of ∼10 8 CFU UPEC in 100 μL phosphate-buffered saline (PBS) ( Spaulding et al., 2017 ). Bacteria were subsequently washed three times with PBS and then concentrated to ~1×10 8 CFU per 100 μL for intestinal infections. In all cases, fecal and urine samples were collected directly from each animal at the indicated time points. Fecal samples were immediately weighed and homogenized in 1 mL PBS. Urine samples were immediately diluted 1:10 prior to plating. Mice were sacrificed via cervical dislocation under isofluorane anesthesia and their organs were removed and processed under aseptic conditions. Intestinal segments (cecum and colon) were weighed prior to homogenization and plating on LB supplemented with the appropriate antibiotic. Exclusion criteria for mice were pre-established; (i) both introduced strains in competitive infections became undetectable during the course of a 14 day experiment, and (ii) mice died or lost >20% of their body weight. No mice in this study met these criteria. Each experiment was conducted with both technical (i.e., a single inoculum of bacteria) and biological (i.e., separate bacterial cultures of the same strain) replicates. Enumeration of intracellular bacteria 6 week old female C3H/HeN mice were given a transurethral inoculation with WT UTI89 or a fimA mutant strain. To accurately count the number of IBCs, mice were sacrificed 6 or 12 hr after infection. Bladders were removed aseptically, bi-sected, splayed on silicone plates and fixed in 4% (v/v) paraformaldehyde. IBCs, readily discernable as punctate violet spots, were quantified by LacZ staining of bladder wholemounts ( Justice et al., 2006 ; Cusumano et al., 2011 ). Bacterial invasion assays were performed at 1, 3, and 6 hr post infection as previously described ( Mulvey et al., 1998 ). Hemagglutination assays (HA) Bacteria were grown under type 1 pilus-inducing conditions ( Greene et al., 2015 ), with appropriate antibiotics and. 01-.02mM IPTG induction, if indicated. Pilus expression was assessed by hemagglutination assays (HA) as previously described ( Greene et al., 2015 ) using bacterial cultures normalized to an optical density at 600 nm (OD 600 ) of 1 and guinea pig erythrocytes normalized to an OD 640 of 2. The experiment was conducted in parallel in PBS with 2% w/v methyl-α-D-mannopyranoside.
Show full methods section
Ethics statement The Washington University Animal Studies
Committee approved all procedures used for the mouse experiments described in the present study. Overall care of the animals was consistent with The Guide for the Care and Use of Laboratory Animals from the National Research Council and the USDA Animal Care Resource Guide . Bacteria, cloning, mutagenesis The BW25113 fimA gene sequence was cloned between the EcoRI and BamHI restriction sites in pTRC99A using standard PCR cloning techniques to create plasmid pTRC-fimA. Mutations were made within this plasmid using appropriate complementary primers to engineer codon changes in the template, pTRC-fimA, using Pfx polymerase and manufacturers instructions for PCR, followed by DpnI treatment of the resulting products to remove the methylated template before transformation into C600. Mutations were verified by sequencing. Mutant plasmids were transformed into UTI89-LON , ∆fimA for expression and functional studies as indicated. In order to construct point mutations in the fimA allele in the UTI89 chromosome, the UTI89 fimA gene was deleted using a previously published technique that allows for flawless integration ( Khetrapal et al., 2016 ). Briefly, fimA was deleted by homologous recombination using pSLC- 217 as a template and primers containing 50 bp of homology to flanking regions of fimA . A deletion was then constructed using the previously described Red Recombinase method that would allow for reinsertion of constructs into the fimA site. Concurrently, a copy of UTI89 fimA was cloned into pTRC99a. Point mutations were then introduced into this construct using site directed mutagenesis. PCR fragments from confirmed mutants, and the WT allele, were reintegrated into the UTI89-LON, ∆ fimA mutants constructed above at the original deletion site. Successful reintegration events were sequenced to confirm flawless integration and mutation presence. Mouse studies Animals were maintained in a single room in our vivarium. Prior to and after infection all animals received PicoLab Rodent Diet 20 (Purina) ad libitum . All animals were maintained under a strict light cycle (lights on at 0600 hr, off at 1800 hr). Mice were acquired from indicated vendors and randomly placed into cages (n = 5 mice/cage) by employees of Washington University’s Division of Comparative Medicine (DCM); no additional methods for randomization were used to determine how animals were allocated to experimental groups. Investigators were not blinded to group allocation during experiments. For bladder infections, 6 week old female C3H/HeN mice were obtained from Envigo and were maintained in our vivarium for one week prior to infection. Bladder infections were performed via transurethral inoculation ( Hung et al., 2009 ). UPEC strains were prepared for inoculation as described previously ( Hung et al., 2009 ). Briefly, a single UTI89 colony was inoculated in 20 mL of Luria Broth (LB) and incubated at 37°C under static conditions for 24 hr. Bacteria were then diluted (1:1000) into fresh LB and incubated at 37°C under static conditions for 18–24 hr. Bacteria were subsequently washed three times with PBS and then concentrated to ~1×10 8 CFU per 100 μL for intestinal infections and ~1×10 8 CFU per 50 μL for bladder infections. Bacteria were subsequently washed three times with PBS and then concentrated to ~1×10 8 CFU per 50 μL for bladder infections. For intestinal colonization experiments, 6 week old female C3H/HeN mice were obtained from Envigo and were maintained in our vivarium for no more than 2 days prior to intestinal colonization. Mice received a single dose of streptomycin (1000 mg/kg in 100 μL water by oral gavage (PO)) followed 24 hr later by an oral gavage of ∼10 8 CFU UPEC in 100 μL phosphate-buffered saline (PBS) ( Spaulding et al., 2017 ). Bacteria were subsequently washed three times with PBS and then concentrated to ~1×10 8 CFU per 100 μL for intestinal infections. In all cases, fecal and urine samples were collected directly from each animal at the indicated time points. Fecal samples were immediately weighed and homogenized in 1 mL PBS. Urine samples were immediately diluted 1:10 prior to plating. Mice were sacrificed via cervical dislocation under isofluorane anesthesia and their organs were removed and processed under aseptic conditions. Intestinal segments (cecum and colon) were weighed prior to homogenization and plating on LB supplemented with the appropriate antibiotic. Exclusion criteria for mice were pre-established; (i) both introduced strains in competitive infections became undetectable during the course of a 14 day experiment, and (ii) mice died or lost >20% of their body weight. No mice in this study met these criteria. Each experiment was conducted with both technical (i.e., a single inoculum of bacteria) and biological (i.e., separate bacterial cultures of the same strain) replicates. Enumeration of intracellular bacteria 6 week old female C3H/HeN mice were given a transurethral inoculation with WT UTI89 or a fimA mutant strain. To accurately count the number of IBCs, mice were sacrificed 6 or 12 hr after infection. Bladders were removed aseptically, bi-sected, splayed on silicone plates and fixed in 4% (v/v) paraformaldehyde. IBCs, readily discernable as punctate violet spots, were quantified by LacZ staining of bladder wholemounts ( Justice et al., 2006 ; Cusumano et al., 2011 ). Bacterial invasion assays were performed at 1, 3, and 6 hr post infection as previously described ( Mulvey et al., 1998 ). Hemagglutination assays (HA) Bacteria were grown under type 1 pilus-inducing conditions ( Greene et al., 2015 ), with appropriate antibiotics and. 01-.02mM IPTG induction, if indicated. Pilus expression was assessed by hemagglutination assays (HA) as previously described ( Greene et al., 2015 ) using bacterial cultures normalized to an optical density at 600 nm (OD 600 ) of 1 and guinea pig erythrocytes normalized to an OD 640 of 2. The experiment was conducted in parallel in PBS with 2% w/v methyl-α-D-mannopyranoside.
Electron microscopy
Electron micrographs (EM) were taken of UTI89 or UTI89 isogenic mutants after growth under type 1 pilus-inducing conditions. A total of 300 bacterial cells were counted for each condition, and piliation on those cells was classified as bald (no pili), low (1 to 20 pili/cell), moderate (20 to 200 pili/cell), or abundant (>200 pili/cell). Force extension experiments For expression of type 1 pili the strains were grown in Luria Broth (LB) supplemented with carbenicillin (100 µg/mL) and IPTG (50 µM), at 37°C overnight. The optical tweezers (OT) setup is built around an inverted microscope (Olympus IX71, Olympus, Japan) equipped with a high numerical aperture oil immersion objective (model: UplanFl 100X N.A. = 1.35; Olympus, Japan) and a 1292 × 964 pixel camera with a cell size of 3.75 × 3.75 μm (model: StingRay F-125, Allied Vision) ( Mortezaei et al., 2013 )( Figure 4—figure supplement 1 ). The OT stands in a temperature controlled room with computers and controllers isolated from the room to reduce noise and vibrations. We use a continuous wave Nd:YVO 4 laser (Millennia IR, Spectra Physics, Santa Clara, CA) operating at 1064 nm for trapping a single bacterium or microspheres. A probe laser (low power HeNe-laser operating at 632.8 nm) is merged with the trapping laser using a polarizing beam splitter cube (PBSC). The light from the probe laser is refracted by the trapped object and collected by the condenser and thereafter imaged onto a 2D position sensitive detector (PSD, L20 SU9, Sitek Electro Optics, Sweden). The PSD convert the incoming light to a photocurrent and thereafter to a voltage that is sent to a programmable low pass filter (SR640, Stanford research systems), later collected by a computer and processed with an in-house LabVIEW program. We minimized the amount of noise in the setup and optimized the measured time series using the Allan variance method described in ( Andersson et al., 2011 ). To prepare a sample we suspended bacteria in 1xPBS to a concentration (1:1000 of OD 600 = 1) suitable for single cell analysis using optical tweezers (OT). Surfactant-free 2.5 µm amidine polystyrene microspheres (product no. 3–2600, Invitrogen, Carlsbad, CA) were similarly suspended in Milli-Q water, these microspheres were trapped and used as force probes. To mount bacteria and reduce the influence of surface interactions we prepared a 1:500 suspension of 9.5 mm carboxylate-modified latex microspheres (product no.2–10000, Interfacial Dynamics, Portland, OR) in Milli-Q. We dropped ten microliters of the microsphere-water suspension onto 24 × 60 mm coverslips (no.1, Knittel Glass, Braunschweig, Germany) and placed these in an oven for 60 min at 60°C to immobilize the microspheres to the surface. To firmly adhere bacteria to the microspheres, we added a solution of 20 mL of 0.01% poly-L-lysine (catalog no. P4832, Sigma-Aldrich, St. Louis, MO) to the coverslips, which, after 45 min incubation at 60°C, were stored until use. A free-floating bacterium was trapped by the optical tweezers run at low power to avoid cell damage. The bacterium was thereafter mounted on a large 9.5 µm microsphere coated with poly-L-lysine. We trapped a small free-floating 2.5 µm microsphere by the optical tweezers with normal power (a few hundreds of mW) and brought it close to (within tens of µm) but not in direct contact with, the bacterium. To calibrate the trap stiffness we used the Power spectrum method by sampling the microspheres position at 131,072 Hz and average 32 consecutive data sets acquired for 0.25 s each ( Tolić-Nørrelykke et al., 2006 ). Typically, the trap constant was found to be ~140 pN/µm for an output laser power of 800 mW. After calibration, the small microsphere was gently brought close to the bacterium in order to attach a pilus with the microsphere ( Figure 4—figure supplement 1 ). To extend a single pilus ( Figure 4 ) the piezo stage was moved at a constant speed of 10 nm/s and the sampling frequency was set to 10,000 Hz that was downsampled by 800. Occasionally, we measured the responses of multiple pili attached to the bead resulting in a force-extension response as the sum of all attached pili. This was, however, not a problem in general since the shorter pili detached from the bead in a sequential order, leaving only the single, longest pili attached to the bead for measurement ( Figure 4—figure supplement 2 ). Finally, we controlled the piezo-stage and sampled the data using an in-house LabView program ( Andersson, 2018 ; copy archived at https://github.com/elifesciences-publications/ot-control ). To make a flow chamber, we added a ring of vacuum grease (Dow Corning, Midland, MI) around the area containing the poly-L-lysine-coated microspheres on one of the coverslips. Carefully, we dropped a 3 mL suspension of bacteria and a 3 mL suspension of probe microspheres (surfactant-free 2.5 mm white amidine polystyrene latex microsphere, product no. 3–2600, Invitrogen, Carlsbad, CA) onto the area and sealed the flow chamber by placing a 20 × 20 mm coverslip (no.1, Knittel Glass) on top. Thereafter, we mounted the sample in a sample holder that is fixed to a piezo-stage (Physik Instrument, P-561.3CD stage) in the OT instrumentation. To get a reliable OT calibration parameter values we measured the temperature using a thermocouple in the sample chamber, 23.0 ± 0.1°C and the suspension viscosity was assumed to only vary with temperature, thus, the viscosity was set to 0.932 mPas ± 0.002 mPas. Pilus preparation for structural determination To prepare the pilus extracts, bacteria of the E. coli strain BW25113 ( Datsenko and Wanner, 2000 ) were inoculated by dense streaking on eight M9 minimal agar plates containing 0.5% glycerol (vol/vol). After a 72 hr incubation at 30°C, bacteria were harvested in 30 mL of LB medium, vortexed vigorously for 5 min and passed eight times through a 26-Gauge needle, to detach pili from the cells. Bacteria were removed at 4°C by three successive 10 min centrifugation steps at 16,000 x g. To collect the pili, cleared supernatants were centrifuged for 1 hr at 100,000 g in a cold Beckman Ti60 ultracentrifuge rotor. Pellet containing the crude pilus fraction was taken up in 200 μL of 50 mM HEPES, 50 mM NaCl pH 7.4, and maintained at 4°C for further analysis. Cryo-EM data collection and image processing 3 μL of sample was applied to glow discharged lacey carbon grids (TED PELLA, Inc., 300 mesh). Then the grids were plunge-frozen using a Vitrobot Mark IV (FEI, Inc.), and subsequently imaged in a Titan Krios at 300keV with a Falcon II direct electron detector (pixel size 1.05 Å/pixel). A total of 6803 images, each of which was from a total exposure of 2 s dose-fractionated into seven chunks, were collected at a range of underfocus between 0.5 ~ 3 μm. Images were motion corrected using MotionCorr ( Li et al., 2013 ), and the program CTFFIND3 ( Mindell and Grigorieff, 2003 ) was used for determining the defocus and astigmatism. Images with poor CTF estimation as well as defocus >3 μm were discarded. The SPIDER software package ( Frank et al., 1996 ) was used for most other operations with the first two-chunk sums (containing a dose of ~20 electrons/ Å 2 ) of the motion-corrected image stacks. The CTF was corrected by multiplying the images from the first two-chunk sums with the theoretical CTF, which is a Wiener filter in the limit of a very poor signal-to-noise ratio (SNR). This both corrects the phases which need to be flipped and improves the SNR. The e2helixboxer routine within EMAN2 ( Tang et al., 2007 ) was used for boxing the filaments from the images. A total of 72,627 overlapping segments (384 px long), with a shift of 11 px between adjacent segments (~97% overlap), were used for the IHRSR ( Egelman, 2000 ) reconstruction. With a featureless cylinder as a starting reference, 72,627 segments were used in IHRSR cycles until the helical parameters (axial rise and rotation per subunit) converged. Analysis of the population suggested that the axial rise was fairly fixed, but that the twist was variable. Using a reference-based sorting with models having a fixed rise but a variable twist, approximately 55% of the segments were excluded, having a twist outside of the range 114.4° to 115.6°. A sub-set of 32,726 segments were used for a few more cycles of IHRSR. The resolution of the final reconstruction was determined by the FSC between two independent half maps, generated from two non-overlapping data sets, which was 4.2 Å at FSC = 0.143.
Model building and refinement
We used a previous FimA NMR model (PDB id: 2JTY, a single chain) as an initial template to dock into the cryo-EM map by rigid body fitting, and then manually edited the model in Chimera ( Pettersen et al., 2004 ) and Coot ( Emsley et al., 2010 ). We then used the combined model (1–19 and 21–159) as the starting template to re-build a single chain of the FimA protein using the RosettaCM protocol ( Wang et al., 2015 ). Next, the full length model of FimA missing the first two residues and the last residue was iteratively refined by Phenix real-space refine ( Adams et al., 2010 ) and manually adjusted in Coot. The refined single chain of the FimA model was then re-built by RosettaCM ( Wang et al., 2015 ) with helical symmetry and refined by Phenix to improve the stereochemistry as well as the model map coefficient correlation. The FimA model was validated with MolProbity ( Chen et al., 2010 ) and the coordinates deposited to the Protein Data Bank with the accession code 6C53 (atomic structure). The corresponding cryo-EM map was deposited in the EMDB with accession code EMD-7342. The refinement statistics are given in Supplementary file 1 .
Bioinformatic analyses
The protein sequences of closely-related homologs of E. coli FimA, FimC, and FimH were obtained by individual searches the Ensembl Bacteria Genome database ( Kersey et al., 2016 ) using the phmmer web-server ( Finn et al., 2015 ) with a BLOSUM62 (FimA) or a BLOSUM90 (FimC and FimH) scoring matrix using the full-length E. coli UTI89 protein sequences as queries. The sequence matches were then filtered to remove low scoring hits and non-functional sequences (i.e., those predicted to lack critical sequence features such as complete signal sequences and/or C-terminal tyrosine residues in FimA and FimH). The signal sequences were trimmed from the remaining homologs using Geneious v 6.1.7 ( Kearse et al., 2012 ) and the protein sequences were aligned with the MAFFT program using two iterations of the FFT-NS-i algorithm based on the PAM200 scoring matrix ( Katoh and Standley, 2013 ). Conservation at each amino acid position was calculated using custom Python scripts and a sequence logo was created using the ggseqlogo package in R ( R Core Team, 2017 ) using RStudio ( RStudio Team , 2015 ). To estimate selection pressures on each codon in fimA , we obtained all available gene sequences encoding the protein sequences described above from the Ensembl Bacteria Genomes database (n = 1,825, three were removed by submitter’s request) using custom bash scripts ( Supplementary file 3 ). A total of 191 unique sequences were identified using Geneious v 6.1.7 and trimmed to remove the signal sequence. Evolutionary model selection was performed using maximum likelihood ratio testing on the Datamonkey webserver ( Pond and Frost, 2005 ; Delport et al., 2010 ), which identified the TIM2 model (model 010232) as the most likely model of nucleotide substitution for the fimA homologs. These sequences were then were scanned for evidence of recombination using single breakpoint analysis ( Kosakovsky Pond et al., 2006 ) and phylogenetic trees with a correction for a breakpoint found in codon 107 (position 320) were generated. These phylogenetic trees and evolutionary model were then used to measure the ratio of the rates non-synonymous ( dN ) to synonymous ( dS ) mutation in each codon (i.e., a dN / dS ratio) using a fixed-effects likelihood test to identify statistical significance ( Kosakovsky Pond and Frost, 2005 ). Using a collection of 67 curated, reference genomes from a previous study ( Schreiber et al., 2017 ), we examined the carriage and phylogenetic context of fimA carriage using a BLAST-based search ( Camacho et al., 2009 ) with the UTI89 fimA gene as a query. Full-length sequences were extracted from the genomes using Geneious v 6.1.7, trimmed to remove signal sequences, and aligned using the MUSCLE program ( Edgar, 2004 ). A phylogenetic tree was estimated using the RAxML program ( Stamatakis, 2006 ) with the GTRCAT model and supported with 1000 bootstraps ( Stamatakis et al., 2008 ). Evidence for episodic, diversifying selection was then identified using a random effects likelihood ratio test for each branch of the fimA phylogenetic tree ( Kosakovsky Pond et al., 2011 ) using unique sequences from the genomes (32 duplicates removed, n = 25). Branches showing statistically significant evidence for episodic, diversifying selection, as measured by a chi-squared test were then indicated on the corresponding branches of the phylogenetic tree constructed using RAxML.
Additional files 10.7554/eLife.31662.019 Supplementary file 1. Validation statistics for FimA model 10.7554/eLife.31662.020 Supplementary file 2. Helical parameters comparison within FimA models 10.7554/eLife.31662.021 Supplementary file 3. FimA sequences used in analysis of conservation and selection 10.7554/eLife.31662.022 Supplementary file 4. List of FimC and FimH sequences 10.7554/eLife.31662.023 Supplementary file 5. Codon-by-codon selection analysis in fimA 10.7554/eLife.31662.024 Supplementary file 6. Reference and UPEC strains used in analysis of fimA carriage 10.7554/eLife.31662.025 Supplementary file 7. In vivo and in vitro phenotypes of fim A mutants 10.7554/eLife.31662.026 Transparent reporting form Major datasets The following previously published dataset was used: Schreiber IV HL Conover MS Chou WC M Hibbing E Manson AL Dodson KW Hannan TJ Roberts PL Stapleton AE Hooton TM Livny J Earl AM Hultgren SJ 2017 Bacteria Genome sequencing and assembly https://www.ncbi.nlm.nih.gov/bioproject/?term=PRJNA269984 Publicly available at the NCBI BioProject Database (accession no:PRJNA269984).
📊 Figures
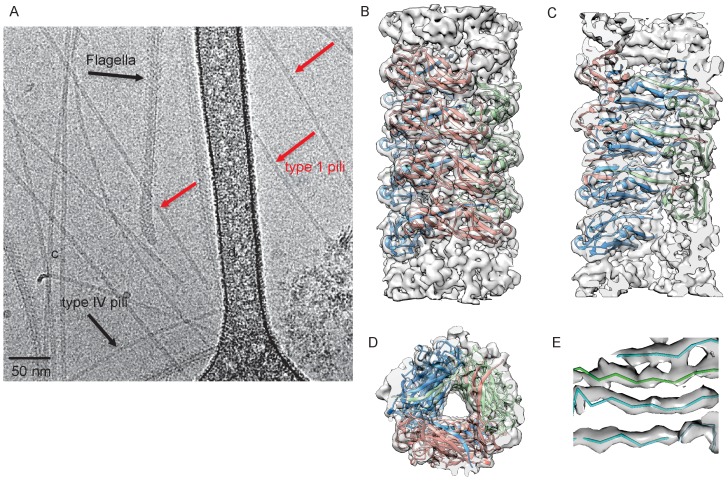
Figure 1.
Cryo-EM Structure of Type 1 pili.
( A ) An electron micrograph of type 1 pili in vitreous ice, surrounded by type 4 pili and flagellar filaments. ( B ) Side view, ( C ) interior view (the front half of the reconstruction has been remo...
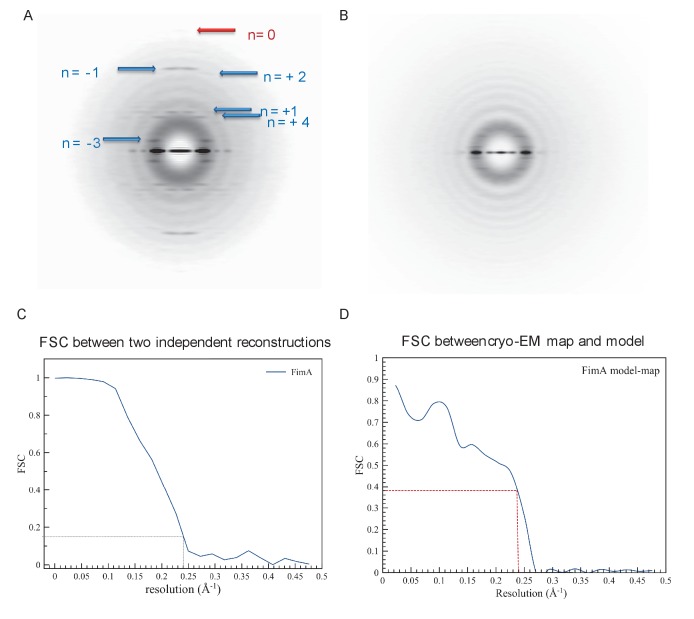
Figure 1u2014figure supplement 1.
Details of cryo-EM reconstruction of type 1 pili.
( A ) Averaged power spectrum from the segments of type 1 pili, which shows the meridional atu00a0~1/(7.5 u00c5) indicated by the red arrow. The blue arrow indicates layer lines containing Bessel orde...
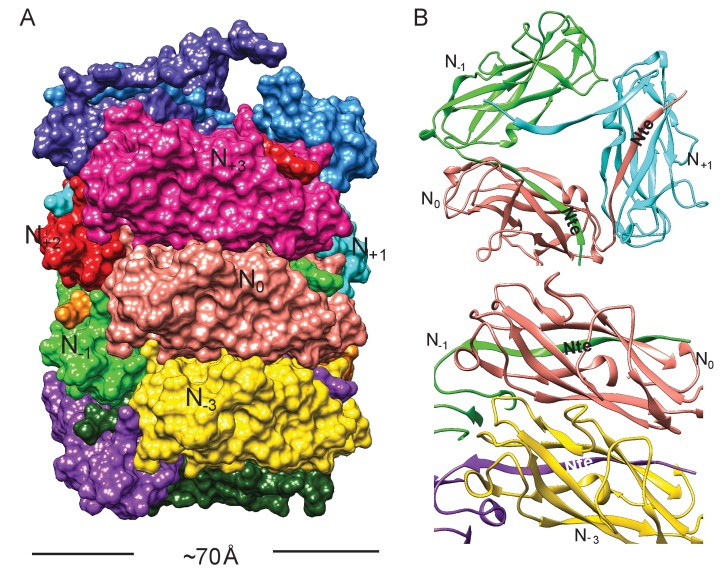
Figure 2.
Subunit interface of the FimA rod.
( A ) Surface view of FimA rod model with subunits numbered along the right-handed 1-start helix. Each subunit is in a different color. ( B ) Ribbon representation to illustrate the interface of subun...
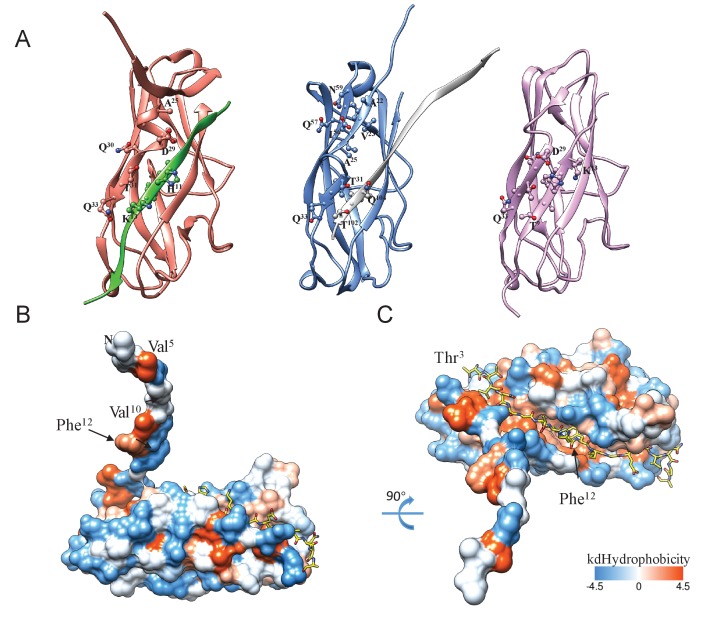
Figure 2u2014figure supplement 1.
Nte inserts into the hydrophobic groove of the neighboring subunit.
( A ) Comparison of the DSC within the helical rod, within the FimA:FimC complex (PDB ID:3SQB), and in the self-complemented FimA monomer (PDB ID:2M5G). FimA in the helical rod is shown in salmon and ...
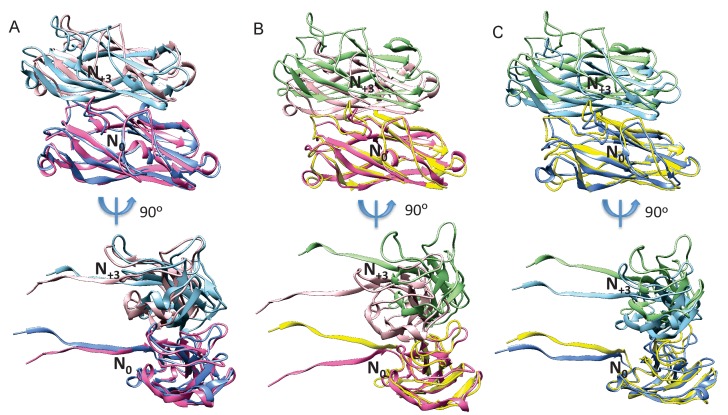
Figure 2u2014figure supplement 2.
Comparison of subunit N 0 and N +3 interfaces with previously deposited FimA pilus rod models.
( A ) Our FimA pilus rod model and the deposited solid-state NMR FimA model 2N7H, when aligned with their N 0 subunit have an overall RMSD of 5.7 u00c5 for subunits N +3 . ( B ) Our FimA pilus rod mod...
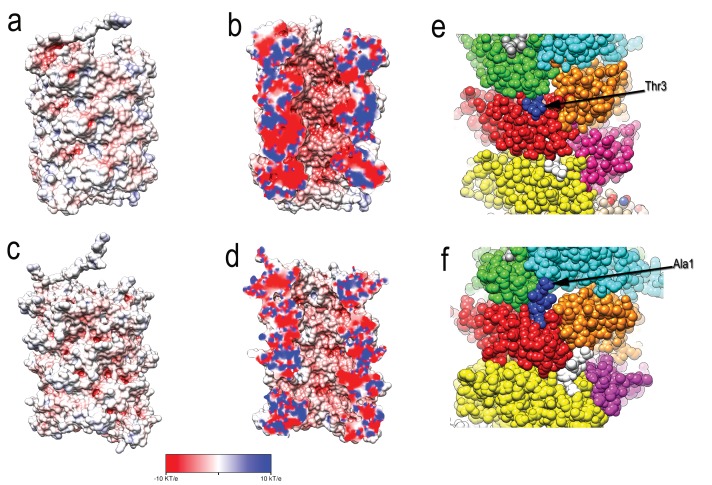
Figure 2u2014figure supplement 3.
Comparison of type 1 pili and P pili.
( A ) The exterior and ( B ) central lumen of type 1 pili colored according to the electrostatic potential. ( C ) The exterior and ( D ) central lumen of P pili (PDB ID: 5FLU) colored according to the...
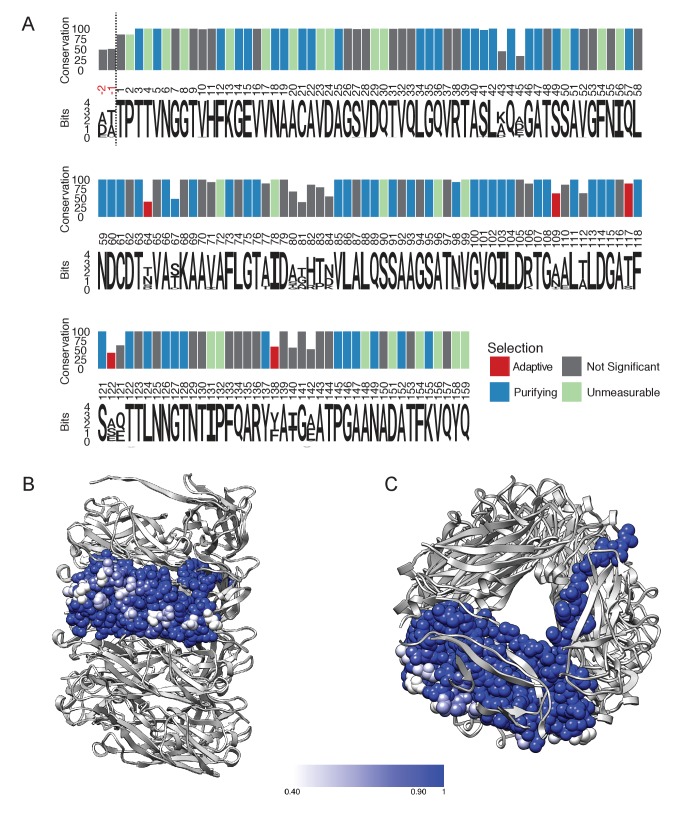
Figure 3.
FimA conservation and variability.
( A ) Conservation, consensus amino acid identity, and selection pressures on residues within the mature form of the FimA protein measured by alignment of 1,828 sequences. Numbering here is based on F...
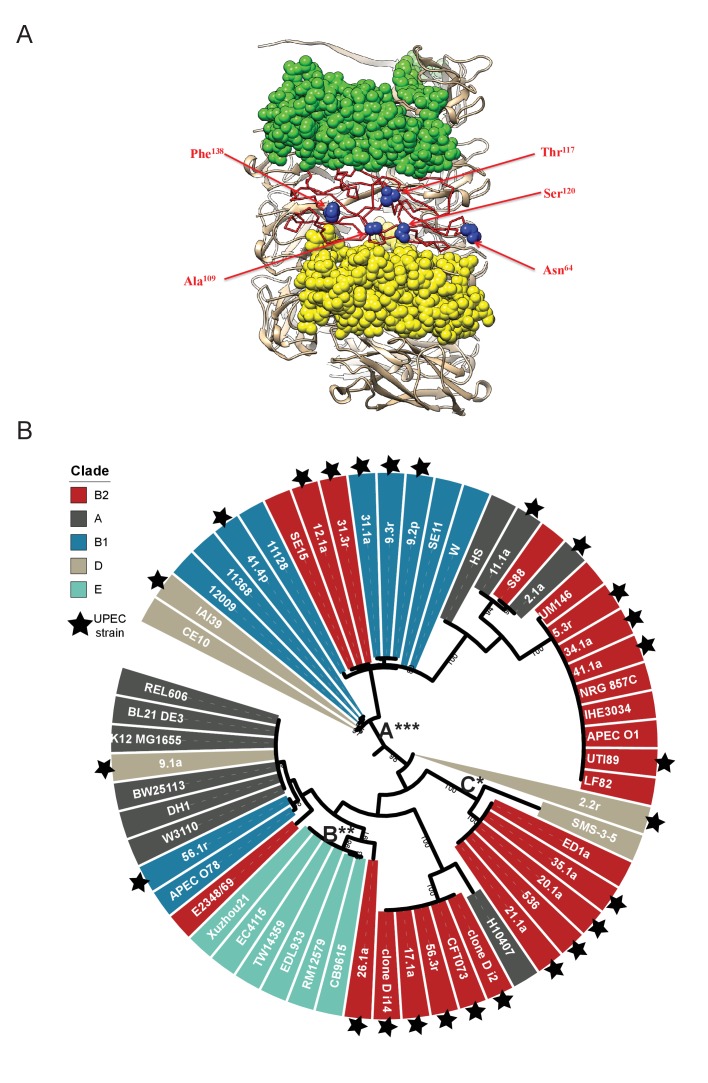
Figure 3u2014figure supplement 1.
Location of FimA residues under positive selection for change in the helical rod.
( A ) Five residues in FimA BW25113 , Asn64, Ala109, Thr117, Ser120 and Phe138, under adaptive selection are all located on the outside of the pilus rod and are shown in blue spheres. ( B ) Phylogenet...
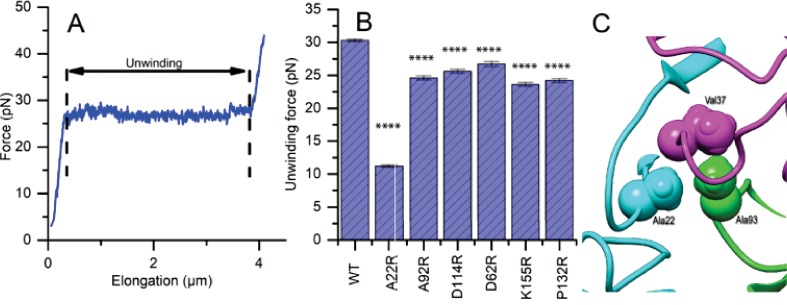
Figure 4.
Mutations to FimA alter the force required to unwind the pilus.
( A ) Force response of a single type 1 pilus. The force response is composed of three phases, elastic stretching of the shaft, unwinding of the shaft, and elastic stretching of individual subunits in...
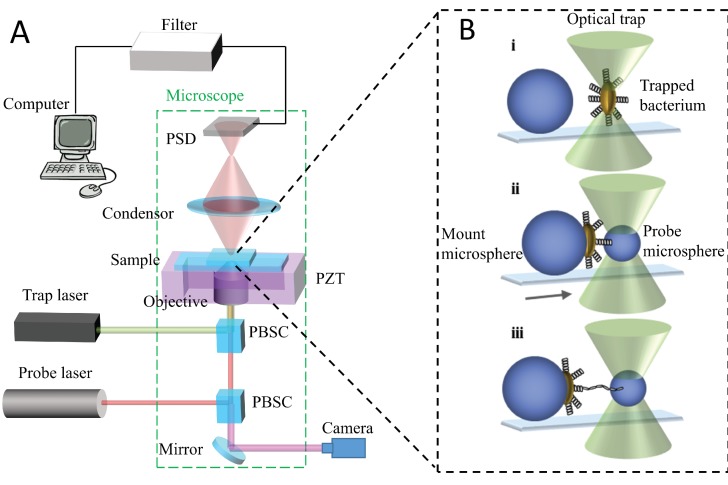
Figure 4u2014figure supplement 1.
Schematic illustration of the optical tweezer setup.
( A ) The trap and probe laser beams are merged using a polarizing beam splitter cube (PBSC) positioned inside the microscope. The two laser beams are thereafter focused by the objective inside the sa...
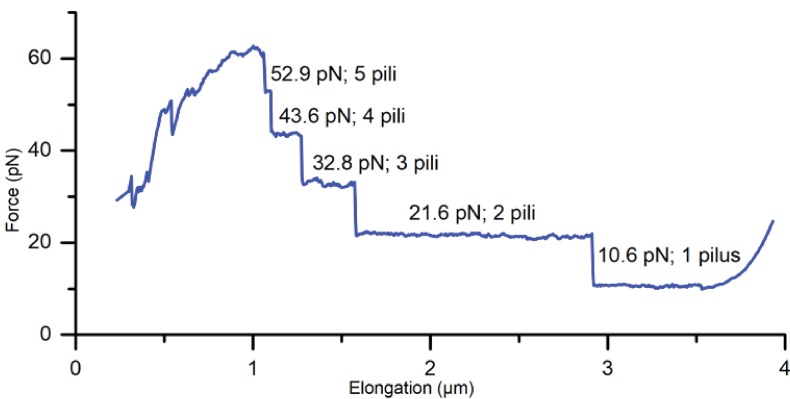
Figure 4u2014figure supplement 2.
Force spectroscopy measurement showing attachment of multiple pili (A22R).
Since the uncoiling force of a pilus being extended by a attached microsphere is constant, the measured force response of all attached pili is a multiple of the force required to uncoil a single pilus...
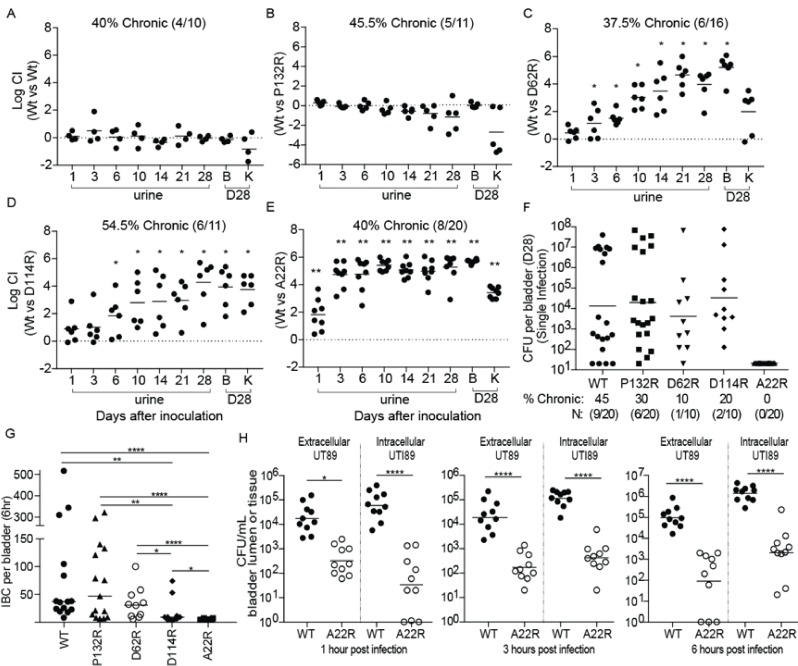
Figure 5.
Point mutations in FimA alter UPEC pathogenesis in the bladder.
C3H/HeN mice were concurrently transurethrally inoculated with 1 u00d7 10 8 CFU of wildtype (WT) UTI89 and one of four isogenic UTI89 strains containing point mutations in the fimA gene. ( Au2013E ) L...
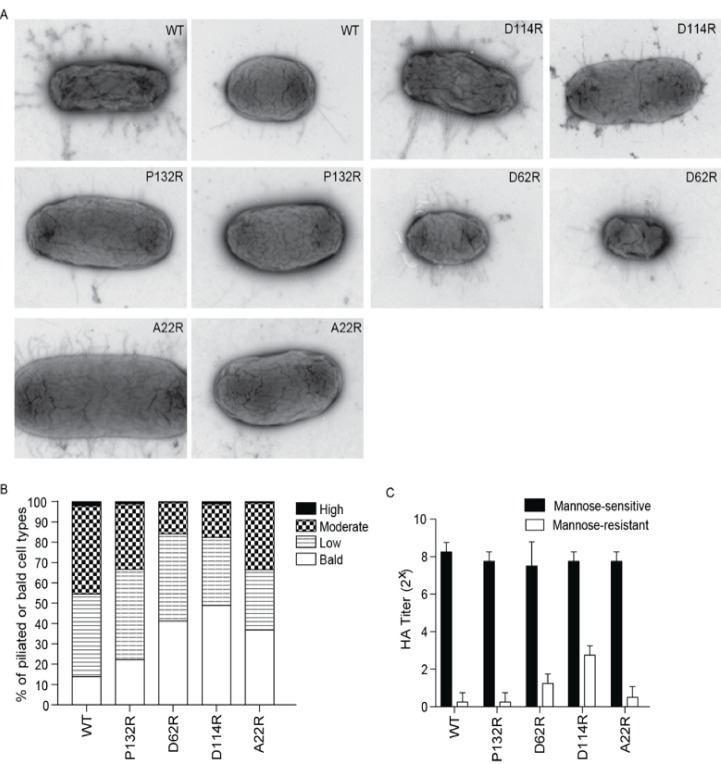
Figure 5u2014figure supplement 1.
Chromosomally integrated point mutations in fimA gene do not prevent the expression or function of type 1 pili in vitro.
( A ) Representative negative stain EM images of UTI89 strains producing WT FimA or one of the indicated mutant variants. ( B ) Percentage of bald, lowly-, moderately-, and highly-piliated cells in th...
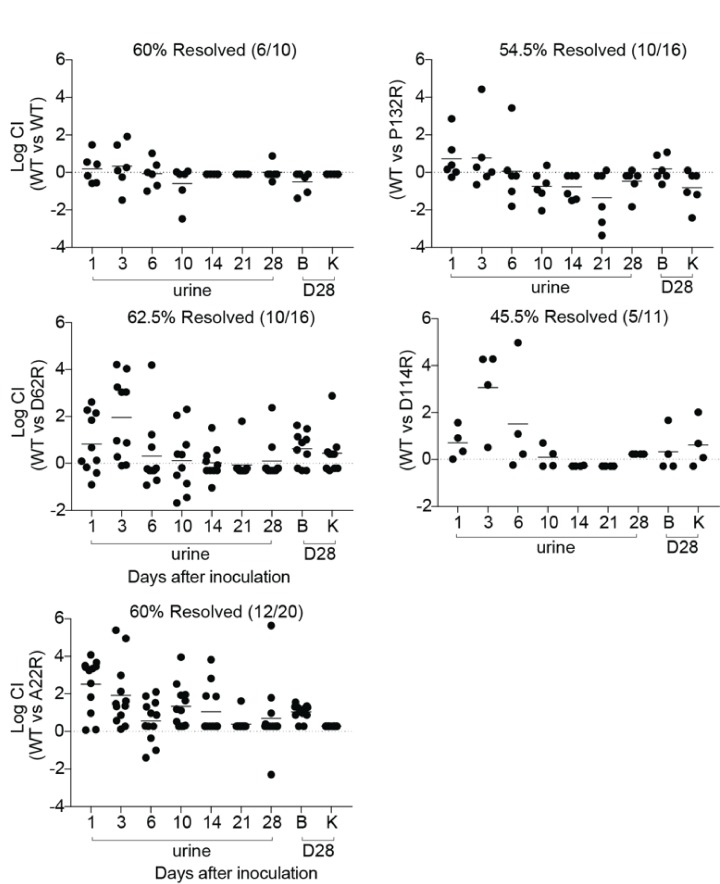
Figure 5u2014figure supplement 2.
CFU titers for mice that resolved competitive bladder infections shown in Figure 5 .
C3H/HeN mice were concurrently colonized, via transurethral inoculation, with 1 u00d7 10 8 CFU of wildtype (WT) UTI89 and one of 4 isogenic UTI89 strains containing point mutations in fimA . The resol...
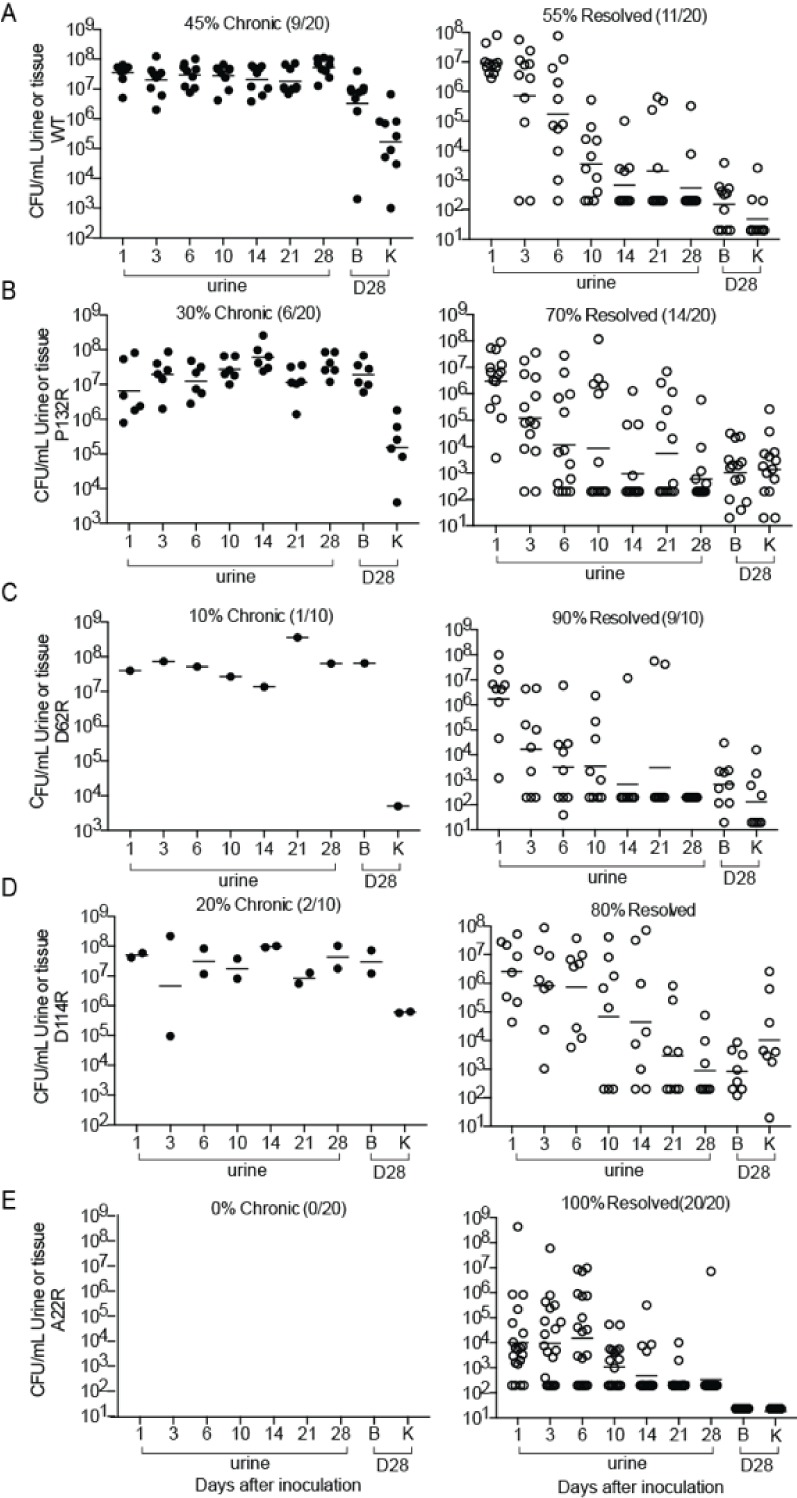
Figure 5u2014figure supplement 3.
CFU titers for mice that developed chronic UTI or resolved infection in single bladder infections shown in Figure 5.
( Au2013E ) C3H/HeN mice were singly colonized, via transurethal inoculation, with 1 u00d7 10 8 CFU of wildtype (WT) UTI89 or one of 4 isogenic UTI89 strains containing point mutations in fimA . The s...
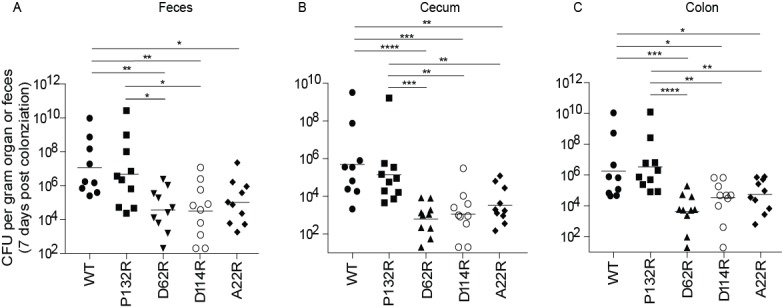
Figure 6.
Mutations in FimA alter the ability of UTI89 to colonize the intestine.
C3H/HeN mice were orally gavaged with streptomycin, to disrupt colonization resistance, and one day later orally gavaged with 1 u00d7 10 8 CFU of WT UTI89 or one of 4 isogenic UTI89 strains with point...
Figure images are served from the NIH/NLM PubMed Central Open Access Subset or Europe PMC; copyright remains with the publishers and authors.
💬 Discussion
0 commentsNo comments yet. Be the first to start a discussion!
Leave a Comment