Abstract
Alzheimer's disease (AD) is a progressive dementia disorder characterized by synaptic degeneration and amyloid-β (Aβ) accumulation in the brain. Through whole-genome sequencing of 1345 individuals from 410 families with late-onset AD (LOAD), we identified three highly penetrant variants in PRKCA, the gene that encodes protein kinase Cα (PKCα), in five of the families. All three variants linked with LOAD displayed increased catalytic activity relative to wild-type PKCα as assessed in live-cell imaging experiments using a genetically encoded PKC activity reporter. Deleting PRKCA in mice or adding PKC antagonists to mouse hippocampal slices infected with a virus expressing the Aβ precursor CT100 revealed that PKCα was required for the reduced synaptic activity caused by Aβ. In PRKCA(-/-) neurons expressing CT100, introduction of PKCα, but not PKCα lacking a PDZ interaction moiety, rescued synaptic depression, suggesting that a scaffolding interaction bringing PKCα to the synapse is required for its mediation of the effects of Aβ. Thus, enhanced PKCα activity may contribute to AD, possibly by mediating the actions of Aβ on synapses. In contrast, reduced PKCα activity is implicated in cancer. Hence, these findings reinforce the importance of maintaining a careful balance in the activity of this enzyme.
🔬 Techniques
✨ Fluorophores
🧪 Sample Preparation
🔬 Cell Lines
🏭 Microscope Brands
🧪 Reagent Suppliers
💻 Software Details
🏛️ Research Organizations (ROR)
Affiliated research institutions:
📋 Methods
Tissue preparation
Experiments were conducted in accordance with and received approval from the Institutional Animal Care and Use Committees at the University of California, San Diego. The experiments were carried out in accordance with guidelines laid down by the National Institutes of Health regarding the care and use of animals for experimental procedures.
Hippocampal slice cultures and Sindbis virus infection
Organotypic hippocampal slice cultures were made from postnatal day 6 or 7 rat pups as described ( 45 ). Slice cultures were maintained in culture for 6 to 8 days and then infected using a Sindbis virus (pSinRep5 dp APP-CT100 tdTomato). Cells were recorded 16 to 30 hours after infection. For Fig. 2 experiments, slices were made as described above, but from either wild-type or PRKCA −/− mouse pups and infected with the indicated Sindbis viruses.
Electrophysiology and pharmacological treatments
Slices were maintained in a solution of artificial cerebrospinal fluid containing the following: 119 mM NaCl, 26 mM NaHCO 3 , 1 mM NaH 2 PO 4 , 11 mM D-glucose, 2.5 mM KCl, 4 mM CaCl 2 , 4 mM MgCl 2 , and 1.25 mM NaHPO 4 and gassed with 95% O 2 5% CO 2 . In addition, the following drugs were included: 4 μM 2-chloroadenosine (to prevent stimulus induced bursting) and 100 μM picrotoxin (to block inhibitory transmission). For Figs. 1 and 2 , simultaneous whole-cell recordings were obtained from pairs of neighboring ( C or B > C is true (where caps indicate mean); for Fig. 2 , we bootstrap-resampled (100,000 times) data groups, measuring the frequency with which A > B or C > B or A > D is true. For Fig. 4 , we bootstrap-resampled (100,000 times) data groups, measuring the frequency with which (MV at t = 3 hours > wild-type at t = 3 hours) or (MV at t = 6 hours > wild-type at t = 6 hours) is true.
Show full methods section
Tissue preparation
Experiments were conducted in accordance with and received approval from the Institutional Animal Care and Use Committees at the University of California, San Diego. The experiments were carried out in accordance with guidelines laid down by the National Institutes of Health regarding the care and use of animals for experimental procedures.
Hippocampal slice cultures and Sindbis virus infection
Organotypic hippocampal slice cultures were made from postnatal day 6 or 7 rat pups as described ( 45 ). Slice cultures were maintained in culture for 6 to 8 days and then infected using a Sindbis virus (pSinRep5 dp APP-CT100 tdTomato). Cells were recorded 16 to 30 hours after infection. For Fig. 2 experiments, slices were made as described above, but from either wild-type or PRKCA −/− mouse pups and infected with the indicated Sindbis viruses.
Electrophysiology and pharmacological treatments
Slices were maintained in a solution of artificial cerebrospinal fluid containing the following: 119 mM NaCl, 26 mM NaHCO 3 , 1 mM NaH 2 PO 4 , 11 mM D-glucose, 2.5 mM KCl, 4 mM CaCl 2 , 4 mM MgCl 2 , and 1.25 mM NaHPO 4 and gassed with 95% O 2 5% CO 2 . In addition, the following drugs were included: 4 μM 2-chloroadenosine (to prevent stimulus induced bursting) and 100 μM picrotoxin (to block inhibitory transmission). For Figs. 1 and 2 , simultaneous whole-cell recordings were obtained from pairs of neighboring ( C or B > C is true (where caps indicate mean); for Fig. 2 , we bootstrap-resampled (100,000 times) data groups, measuring the frequency with which A > B or C > B or A > D is true. For Fig. 4 , we bootstrap-resampled (100,000 times) data groups, measuring the frequency with which (MV at t = 3 hours > wild-type at t = 3 hours) or (MV at t = 6 hours > wild-type at t = 6 hours) is true.
Plasmid constructs The CKAR and plasma membrane–localized
PKC reporter were described previously ( 22 ). The PSD95-specific PKC reporter (PSD95-CKAR) contains CKAR with PSD95 fused to its N terminus via a four–amino acid linker (EPGQ) in a pcDNA3 vector (Life Technologies). PKC constructs were prepared as described previously ( 16 ). For HA-PKCα, human PKCα was N-terminally HA-tagged via Gateway cloning into pDEST-HA generated from ligating the reading frame cassette C into the EcoRV site of pcDNA3-HA. All mutants were generated using QuikChange site-directed mutagenesis (Agilent Technologies).
Antibodies and reagents
The pan antibody against the phosphorylated PKC activation loop (pT497) was previously described ( 47 ). The antibody to phosphorylated PKCα/βII (pT638/641; 9375S) and pan antibody to the phosphorylated PKC hydrophobic motif (βII pS660; 9371S) were purchased from Cell Signaling Technology. The α-HA antibody (anti-HA; 11867423001, clone 3F10) was purchased from Roche. PDBu, UTP trisodium salt, Gö 6983, and Bis IV were obtained from Calbiochem. Cell culture, transfection, and immunoblotting All cells were maintained in Dulbecco’s modified Eagle’s medium (Corning) containing 10% fetal bovine serum (Atlanta Biologicals) and 1% penicillin/streptomycin (Corning) at 37°C, in 5% CO 2 . Transient transfection of COS7 was carried out using FuGENE 6 transfection reagent (Roche) for ~24 hours. Cells were lysed in 50 mM tris (pH7.4), 1% Triton X-100, 50mM NaF, 10 mM Na 4 P 2 O 7 , 100 mM NaCl, 5 mM EDTA, 1 mM Na 3 VO 4 , 1 mM phenylmethylsulfonyl fluoride, leupeptin (50 μg/ml), 1 μM microcystin, 1 mM dithiothreitol, and 2 mM benzamidine. For PKC immunoblotting, whole-cell lysates were analyzed by SDS–polyacrylamide gel electrophoresis (SDS-PAGE) and immunoblotting via chemiluminescence on a FluorChem Q imaging system (ProteinSimple). For cellular dephosphorylation experiments, cells were treated with 200 nM PDBu for the indicated times at 37°C before lysis. For Aβ immunoblotting, 10 μg of protein per sample was electrophoresed on 10 to 20% SDS–polyacrylamide tris-tricine gels (Bio-Rad). Proteins were transferred to nitrocellulose, and membranes were boiled in phosphate-buffered saline for 5 min. Membranes were blocked in TBST(tris-buffered saline– Tween 20) containing 5% bovine serum albumin (#A3803, Sigma; >98% grade) for 1 hour at room temperature and probed with biotinylated 6E10 (BioLegend; 1:2500) or APPCter (#A8717, Sigma; 1:5000) in blocking solution. Primary antibodies were detected using anti–immunoglobulin G conjugated with either biotin or infrared dyes (LI-COR Biosciences). When biotin-conjugated antibodies were used, DyLight 800–conjugated NeutrAvidin (#22853, Thermo Scientific) was added to amplify the signal. Blots were imaged with an Odyssey detection system (LI-COR Biosciences).
Immunoprecipitation
Protein extract (200 μg) was diluted to 1 ml with dilution buffer [50 mM tris-HCl (pH 7.4), 150 mM NaCl] and incubated with 25 μl of MagG beads (Roche) cross-linked with 5 μg of 4G8 overnight at 4°C. The following day, immune complexes were briefly washed with immunoprecipitation buffers A and B for 5 min ( 48 ). The beads were then washed twice in 1 ml of dilution buffer, and proteins were eluted by boiling in 20 μl of SDS-PAGE loading buffer.
FRET imaging and analysis
Cells were imaged as described previously ( 49 ). COS7 cells were cotransfected with the indicated mCherry-tagged PKC and either CKAR, plasma membrane–targeted CKAR, or PSD95-CKAR, as specified. Cells were rinsed once with and imaged in Hanks’ balanced salt solution containing 1 mM CaCl 2 . Images were acquired on a Zeiss Axiovert microscope (Carl Zeiss Microimaging Inc.) using a MicroMax digital camera (Roper-Princeton Instruments) controlled by MetaFluor software (Universal Imaging Corp.). Using a 10% neutral density filter, cyan fluorescent protein, yellow fluorescent protein (YFP), fluorescence resonance energy transfer (FRET), and mCherry images were obtained every 15 s. YFP emission was monitored as a control for photobleaching, and mCherry was measured to ensure that overexpressed PKC levels were equal in all experiments. Baseline images were acquired for ≥2 min before ligand addition, and data were normalized to the baseline FRET ratios. The normalized average FRET ratio is the average of these normalized values ± SE. Area under the curve from 3 to 6 min was quantified and plotted in the bar graph in Fig. 5 , and statistical significance was determined as indicated above. Three-dimensional PKC structure modeling: The PKCα structure was visualized using the PyMOL Molecular Graphics System (version 1.7.4.1, Schrödinger LLC.). Genetics, family cohort The NIMH Alzheimer’s Disease Genetics Initiative Study ( 50 ), originally ascertained for the study of genetic risk factors in AD with family-based methods, was used in the whole-genome shotgun (WGS) analyses in this study. The basis for ascertainment in the NIMH collection was the existence of at least two affected individuals within a family, typically siblings. The complete NIMH study cohort contains a total of 1536 subjects from 457 families. For the purpose of this analysis, only subjects of self-reported European ancestry were included, consisting of 1376 participants (941 definitely affected and 404 definitely unaffected, and the remainder could not be determined as definitely unaffected or definitely affected) from 410 families. To test the likelihood of finding the observed linkage in the mutant carrier families by chance, we conducted the following bootstrap analysis. We generated a “parent” set containing 941 ones (indicating affected) and 404 zeros (indicating unaffected), which is the nature of the definitely assessed population in this cohort. We wished to test the likelihood that choosing a set of 16 individuals (based on being in a family with a mutant protein) would show the observed linkage, that is, the likelihood that in choosing 10 individuals (variant carriers) all would have AD, and that in choosing 6 individuals (variant noncarriers) at least 2 would not have AD. We conducted the following sampling (allowing resampling) procedure: we chose 10 and 6 elements from the parent set to generate two subsets, y(1) and y(2). We then tested if all values in y(1) were 1 (test 1) and at least two values in y(2) were 0 (test2). If both tests were true, the result of the procedure was 1 (meaning chance could account for observed linkage); if any of the tests was false, the result of the procedure was 0. This procedure was conducted 100,000 times (run four times). The number of times the result of the procedure was 1 in the four runs was 2750, 2809, 2920, and 2861. Thus (dividing these values by 100,000), the likelihood of finding the observed linkage distribution by chance in this population is
📊 Figures
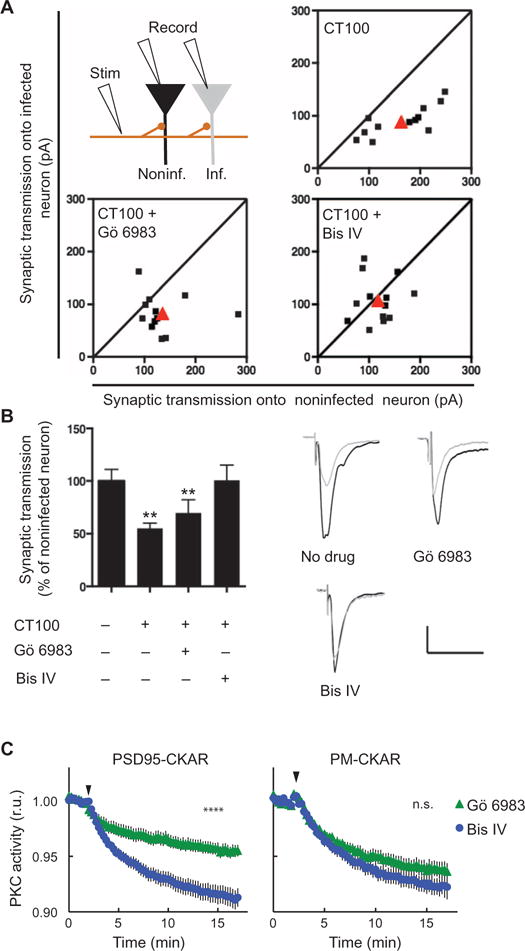
Fig. 1
Synaptic depression by Au03b2 blocked by uncompetitive PKC antagonist
( A and B ) Top left: Experimental design (see Materials and Methods). Plots (A) and bar graphs (B) of evoked synaptic response amplitudes recorded in CT100-infected versus noninfected neurons. Shown ...
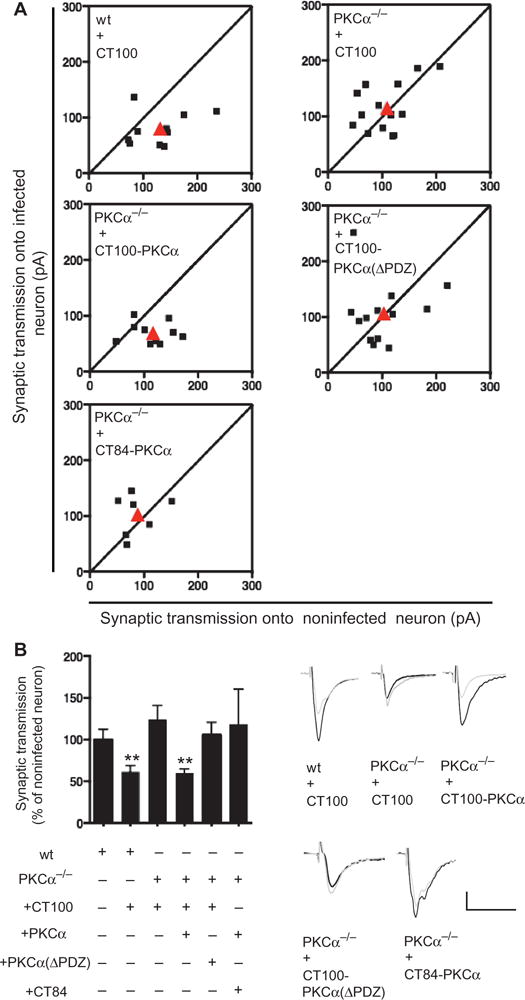
Fig. 2
PKCu03b1 is required for the effects of Au03b2 on synaptic transmission
( A and B ) Plot (A), and example traces (bottom right), of evoked synaptic response amplitudes recorded in infected versus noninfected neurons; genotype and infection indicated. Bar graph (B, left) o...

Fig. 3
Human genetics of rare PKCu03b1 variants
Diagrams indicating number of families, along with phenotype and genotype of individuals, carrying M489V, V636I, or R324W PKCu03b1 variants. All PKCu03b1 variant carriers (yellow) displayed AD, and bo...
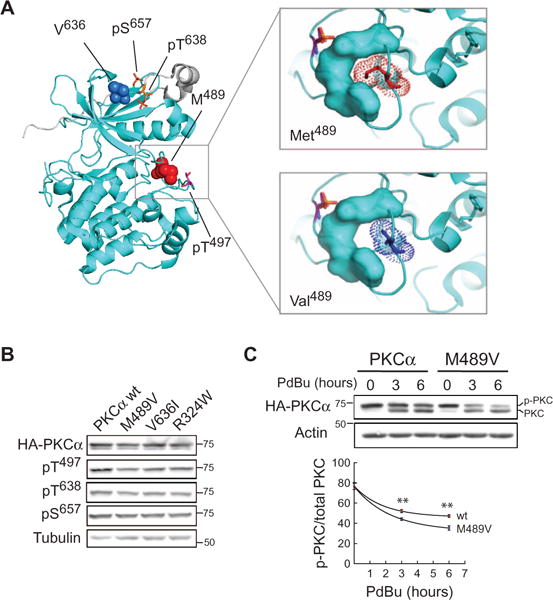
Fig. 4
AD-associated rare variants in PKCu03b1
( A ) PKCu03b1 kinase domain structure ( 53 ) showing two residues altered in AD:Met 489 and Val 636 . Both are near key regulatory phosphorylation sites (stick representation). Enlargement of activat...
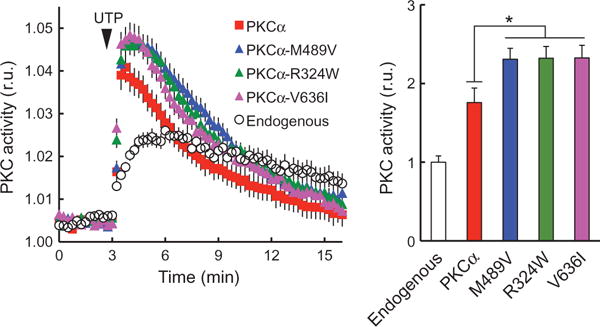
Fig. 5
Live-cell imaging reveals higher signaling output of all three AD-associated rare variants
Left: Normalized FRET ratios (mean u00b1 SEM) representing PKC activity in COS7 cells coexpressing PKC activity reporter, CKAR, ( 22 ) and indicated PKCu03b1. Addition of uridine 5u2032-triphosphate (...
Figure images are served from the NIH/NLM PubMed Central Open Access Subset or Europe PMC; copyright remains with the publishers and authors.
💬 Discussion
0 commentsNo comments yet. Be the first to start a discussion!
Leave a Comment