Abstract
AbstractLabel-free imaging of living cells below the optical diffraction limit poses great challenges for optical microscopy. Biologically relevant structural information remains below the Rayleigh limit and beyond the reach of conventional microscopes. Super-resolution techniques are typically based on the non-linear and stochastic response of fluorescent labels which can be toxic and interfere with cell function. In this paper we present, for the first time, imaging of live cells using sub-optical wavelength phonons. The axial imaging resolution of our system is determined by the acoustic wavelength (λa = λprobe/2n) and not on the NA of the optics allowing sub-optical wavelength acoustic sectioning of samples using the time of flight. The transverse resolution is currently limited to the optical spot size. The contrast mechanism is significantly determined by the mechanical properties of the cells and requires no additional contrast agent, stain or label to image the cell structure. The ability to breach the optical diffraction limit to image living cells acoustically promises to bring a new suite of imaging technologies to bear in answering exigent questions in cell biology and biomedicine.
🔬 Techniques
✨ Fluorophores
🧪 Sample Preparation
🔬 Cell Lines
🏭 Microscope Brands
🧪 Reagent Suppliers
📷 Detectors
🏛️ Research Organizations (ROR)
Affiliated research institutions:
📋 Methods
Experimental set-up The asynchronous optical sampling (ASOPS 27 ) pump probe system (see Fig. 2 ) controls two 150 femtosecond pulsed lasers with repetition rates of ~100 MHz and allows the delay between the lasers to be set and swept electronically without the need for a mechanical delay line 21 22 . In our system, the delay repetition rate between the probe and the pump is 10 kHz which means that a measurement (of the complete 10 ns delay sweep) is taken every 100 μ s. As seen in Fig. 2 , both beams ( λ probe = 780 nm, λ pump = 390 nm ) are combined and focused together through a 50x (NA = 0.55) long working distance objective. Adjustable mirrors allows coaligning of the pump spot to the probe spot. The probe beam is detected after being collected by an objective lens (20x, NA = 0.42) and focused to a photodiode. The sample is scanned by moving electromechanical stages with a minimum step motion of 100 nm. Typically 10000 averages are taken per point which takes ~2 s to acquire limited by data acquisition element. The system uses typical average powers of 1 mW (0.3 mW at cell) in the probe and 0.5 mW (0.05 mW at cell) in the pump corresponding to pulse energies of 10 pJ and 5 pJ and peak powers of ~60 W and ~30 W respectively. Optical imaging is performed with two cameras: one CCD is used for brightfield imaging (using the 50x objective lens) and the other (emCCD) for fluorescence (using the 20x objective lens). A spectrally-distinct LED source (530+/−25 nm) provides brightfield illumination of the sample as well as excitation for red-emitting fluorescence dyes. Epifluorescence was detected via a TRITC cube (Ex: 535/15, DCX: 565, Em: 615/35 nm). Cell methods 3T3 fibroblast cells were cultured on the EtOH-sterilised transducers for 24 hrs in standard culture medium. Living cells were kept in Hanks balanced salt solution (HBSS) buffered with 4-(2-hydroxyethyl)-1-piperazineethanesulfonic acid (HEPES, 25 mM) to maintain physiological pH (7.4) under ambient conditions during the experiments. Media was pumped at 0.05 μ Ls −1 using a syringe pump into a chamber (chamilde CF-T25 produced by Live Cell Instruments, Seoul) comprising a transducer substrate and a closing coverslip. Constant flow of media allowed specimens to remain alive for several hours at room temperature (21 °C). A fluorescence assay was used to confirm cell viability ( Fig. 6 ). Propidium iodide (PI, abs: 510–560 nm, em: 600–650 nm) binds to DNA in the nuclei of dead cells, and is non-fluorescent when excluded from entering living cells by the intact cell membrane. PI was added as a 1 mM EtOH stock to a concentration of 1 μ M in bathing medium. A fluorescence picture of the targeted region of cells was obtained before starting the ultrasonic imaging and another following the ultrasound imaging experiment (see supplementary Fig. 1 ). Finally, all cells were deliberately killed using a detergent (Triton X-100 in phosphate buffered saline (PBS) solution, Sigma-Aldrich). Cells which survived the ultrasound imaging experiments continued to exclude PI from their nuclei throughout and following the experiment, confirming that the cells remained viable (see supplementary information ).
Show full methods section
Experimental set-up The asynchronous optical sampling (ASOPS 27 ) pump probe system (see Fig. 2 ) controls two 150 femtosecond pulsed lasers with repetition rates of ~100 MHz and allows the delay between the lasers to be set and swept electronically without the need for a mechanical delay line 21 22 . In our system, the delay repetition rate between the probe and the pump is 10 kHz which means that a measurement (of the complete 10 ns delay sweep) is taken every 100 μ s. As seen in Fig. 2 , both beams ( λ probe = 780 nm, λ pump = 390 nm ) are combined and focused together through a 50x (NA = 0.55) long working distance objective. Adjustable mirrors allows coaligning of the pump spot to the probe spot. The probe beam is detected after being collected by an objective lens (20x, NA = 0.42) and focused to a photodiode. The sample is scanned by moving electromechanical stages with a minimum step motion of 100 nm. Typically 10000 averages are taken per point which takes ~2 s to acquire limited by data acquisition element. The system uses typical average powers of 1 mW (0.3 mW at cell) in the probe and 0.5 mW (0.05 mW at cell) in the pump corresponding to pulse energies of 10 pJ and 5 pJ and peak powers of ~60 W and ~30 W respectively. Optical imaging is performed with two cameras: one CCD is used for brightfield imaging (using the 50x objective lens) and the other (emCCD) for fluorescence (using the 20x objective lens). A spectrally-distinct LED source (530+/−25 nm) provides brightfield illumination of the sample as well as excitation for red-emitting fluorescence dyes. Epifluorescence was detected via a TRITC cube (Ex: 535/15, DCX: 565, Em: 615/35 nm). Cell methods 3T3 fibroblast cells were cultured on the EtOH-sterilised transducers for 24 hrs in standard culture medium. Living cells were kept in Hanks balanced salt solution (HBSS) buffered with 4-(2-hydroxyethyl)-1-piperazineethanesulfonic acid (HEPES, 25 mM) to maintain physiological pH (7.4) under ambient conditions during the experiments. Media was pumped at 0.05 μ Ls −1 using a syringe pump into a chamber (chamilde CF-T25 produced by Live Cell Instruments, Seoul) comprising a transducer substrate and a closing coverslip. Constant flow of media allowed specimens to remain alive for several hours at room temperature (21 °C). A fluorescence assay was used to confirm cell viability ( Fig. 6 ). Propidium iodide (PI, abs: 510–560 nm, em: 600–650 nm) binds to DNA in the nuclei of dead cells, and is non-fluorescent when excluded from entering living cells by the intact cell membrane. PI was added as a 1 mM EtOH stock to a concentration of 1 μ M in bathing medium. A fluorescence picture of the targeted region of cells was obtained before starting the ultrasonic imaging and another following the ultrasound imaging experiment (see supplementary Fig. 1 ). Finally, all cells were deliberately killed using a detergent (Triton X-100 in phosphate buffered saline (PBS) solution, Sigma-Aldrich). Cells which survived the ultrasound imaging experiments continued to exclude PI from their nuclei throughout and following the experiment, confirming that the cells remained viable (see supplementary information ).
Signal processing
Raw signals are composed of several parts: coincidence peak, thermal response and signals of interest - which were extracted by established signal processing 24 33 . A fast Fourier transform (FFT) is then performed on the resultant trace to measure the Brillouin frequency. Signal to noise ratio (SNR) was evaluated in the frequency domain by measuring the peak amplitude of the acoustic signal with the standard deviation of the noise background in the absence of signal (pump off) and in the same band. Because the acoustic waves are propagating axially through the sample, different moments in time represent different locations in space. Axial sectioning information was therefore obtained by resolving the Brillouin frequency in time. This was possible using the short time Fourier transform method (STFT) where a small time window (length: two acoustic cycles or more) is shifted in time. In this way, it is possible to section the optical volume. The resolution of this process was estimated by modelling and experimental measurements of an edge response revealing the axial resolution is approximately half of one measuring window when the window lasts for two cycles or more.
Experimental set-up The asynchronous optical sampling (ASOPS 27 ) pump probe system (see Fig. 2 ) controls two 150 femtosecond pulsed lasers with repetition rates of ~100 MHz and allows the delay between the lasers to be set and swept electronically without the need for a mechanical delay line 21 22 . In our system, the delay repetition rate between the probe and the pump is 10 kHz which means that a measurement (of the complete 10 ns delay sweep) is taken every 100 μ s. As seen in Fig. 2 , both beams ( λ probe = 780 nm, λ pump = 390 nm ) are combined and focused together through a 50x (NA = 0.55) long working distance objective. Adjustable mirrors allows coaligning of the pump spot to the probe spot. The probe beam is detected after being collected by an objective lens (20x, NA = 0.42) and focused to a photodiode. The sample is scanned by moving electromechanical stages with a minimum step motion of 100 nm. Typically 10000 averages are taken per point which takes ~2 s to acquire limited by data acquisition element. The system uses typical average powers of 1 mW (0.3 mW at cell) in the probe and 0.5 mW (0.05 mW at cell) in the pump corresponding to pulse energies of 10 pJ and 5 pJ and peak powers of ~60 W and ~30 W respectively. Optical imaging is performed with two cameras: one CCD is used for brightfield imaging (using the 50x objective lens) and the other (emCCD) for fluorescence (using the 20x objective lens). A spectrally-distinct LED source (530+/−25 nm) provides brightfield illumination of the sample as well as excitation for red-emitting fluorescence dyes. Epifluorescence was detected via a TRITC cube (Ex: 535/15, DCX: 565, Em: 615/35 nm).
Cell methods 3T3 fibroblast cells were cultured on the EtOH-sterilised transducers for 24 hrs in standard culture medium. Living cells were kept in Hanks balanced salt solution (HBSS) buffered with 4-(2-hydroxyethyl)-1-piperazineethanesulfonic acid (HEPES, 25 mM) to maintain physiological pH (7.4) under ambient conditions during the experiments. Media was pumped at 0.05 μ Ls −1 using a syringe pump into a chamber (chamilde CF-T25 produced by Live Cell Instruments, Seoul) comprising a transducer substrate and a closing coverslip. Constant flow of media allowed specimens to remain alive for several hours at room temperature (21 °C). A fluorescence assay was used to confirm cell viability ( Fig. 6 ). Propidium iodide (PI, abs: 510–560 nm, em: 600–650 nm) binds to DNA in the nuclei of dead cells, and is non-fluorescent when excluded from entering living cells by the intact cell membrane. PI was added as a 1 mM EtOH stock to a concentration of 1 μ M in bathing medium. A fluorescence picture of the targeted region of cells was obtained before starting the ultrasonic imaging and another following the ultrasound imaging experiment (see supplementary Fig. 1 ). Finally, all cells were deliberately killed using a detergent (Triton X-100 in phosphate buffered saline (PBS) solution, Sigma-Aldrich). Cells which survived the ultrasound imaging experiments continued to exclude PI from their nuclei throughout and following the experiment, confirming that the cells remained viable (see supplementary information ).
📊 Figures
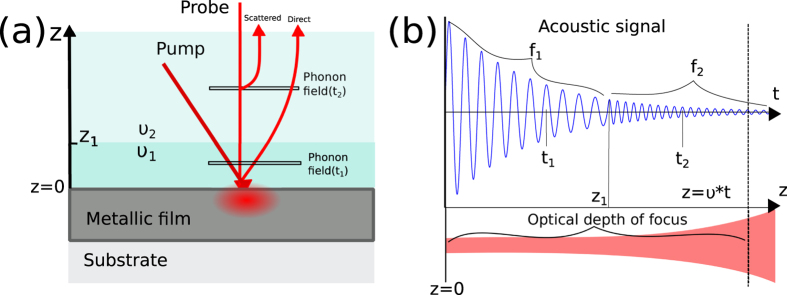
Figure 1
Phononic measurement of transparent materials.
In ( a ), a light pulse (pump) is used to thermoelastically generate a coherent phonon field in the metallic film. The phonon field (shown at two positions in time, t 1 and t 2 , by thin horizontal ba...
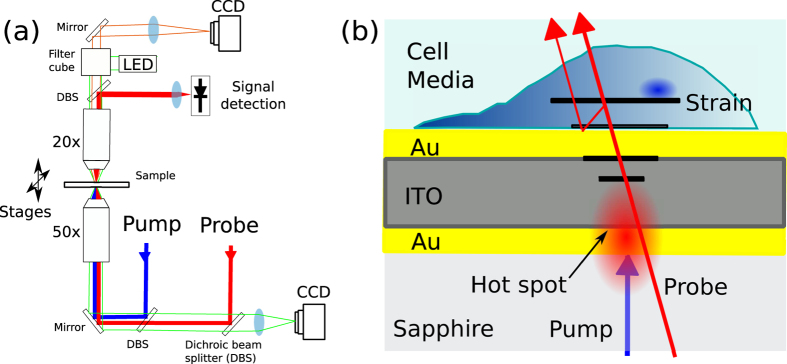
Figure 2
Experimental schematic.
( a ) Experimental setup. Two pulsed lasers in ASOPS pump-probe configuration are combined by an objective lens (0.55 NA) and focused into the transducer substrate interface where the probe beam is ca...
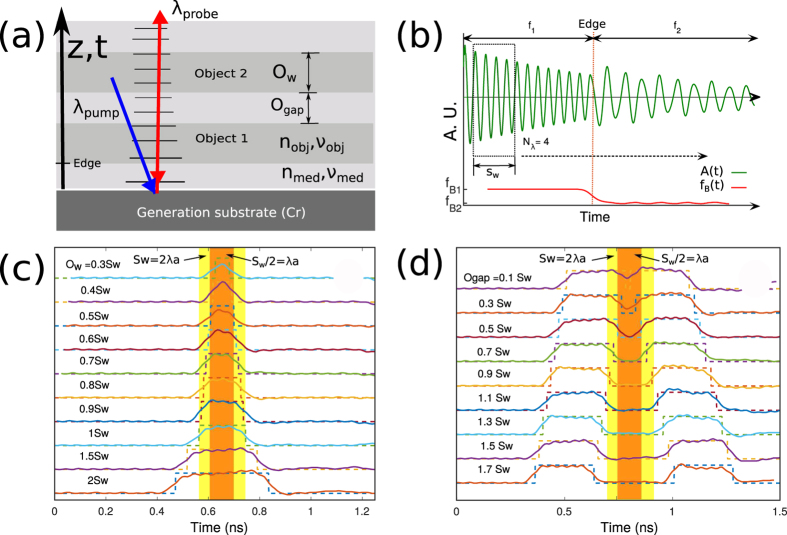
Figure 3
Simulated measurements and axial response upon stimulation.
( a ) Schematic of the simulated geometry. ( b ) Simulation of an edge response to represent sectioning. ( c ) Simulated response from a single object with various sizes for N u03bb =u20092. ( d ) Sim...
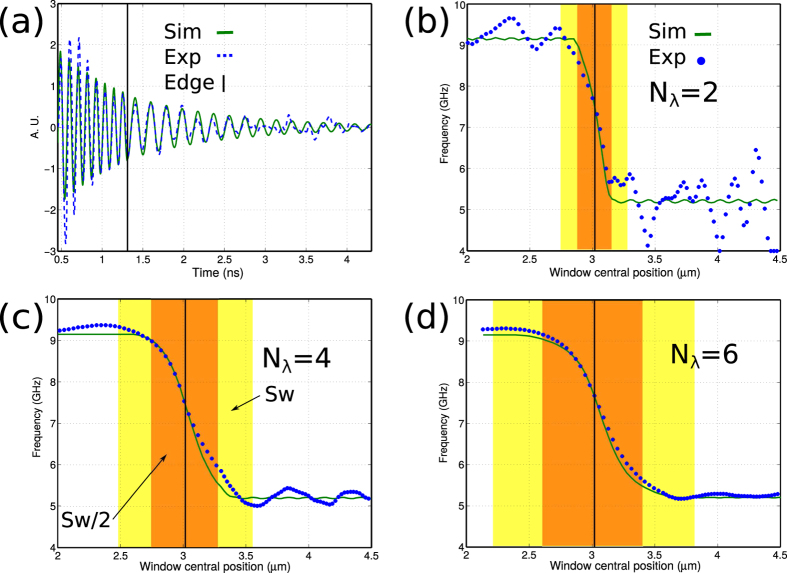
Figure 4
Experimental measurement of edge response between polystyrene and water.
( a ) Experimental and simulated (fitted) traces with a sharp edge made out of polystyrene-water transition. ( b ) Edge response with N u03bb =u20092. ( c ) Edge response with N u03bb =u20094. ( d ) E...
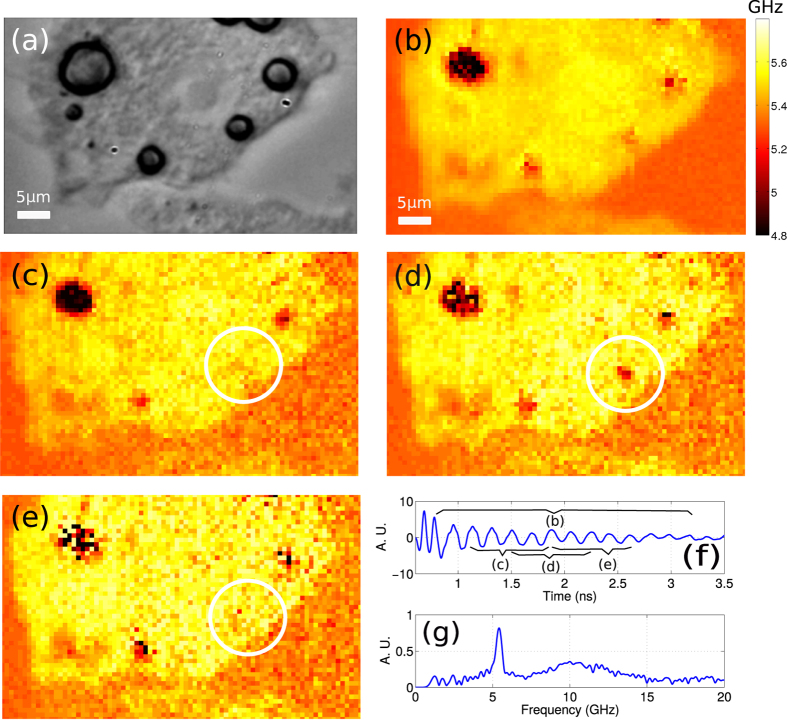
Figure 5
Imaging of an adipose cell using ~5u2009GHz phonons.
( a ) Optical picture taken with a conventional brightfield microscope showing an adipose cell. Fat droplets are clearly visible. ( b ) The Brillouin frequency map of the area shown in ( a ). This map...
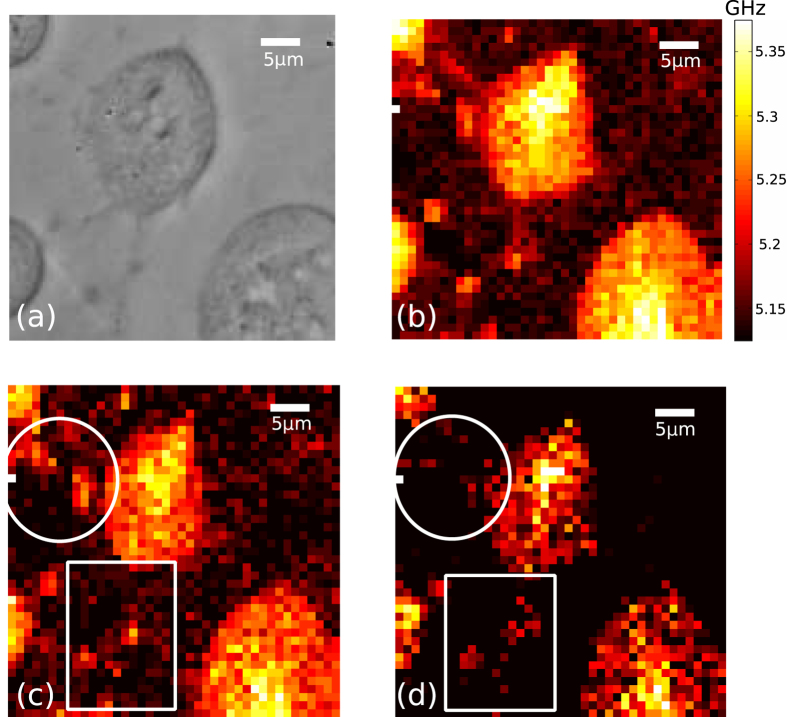
Figure 6
Imaging of live 3T3 cells with phonons.
( a ) Optical image of the scanned area. ( b ) Brillouin shift measured from ( a ) sampling every 1 u03bc m, taking ~1.5u2009s per point and a total of 38u2009minutes total acquisition time. ( c ) Sec...
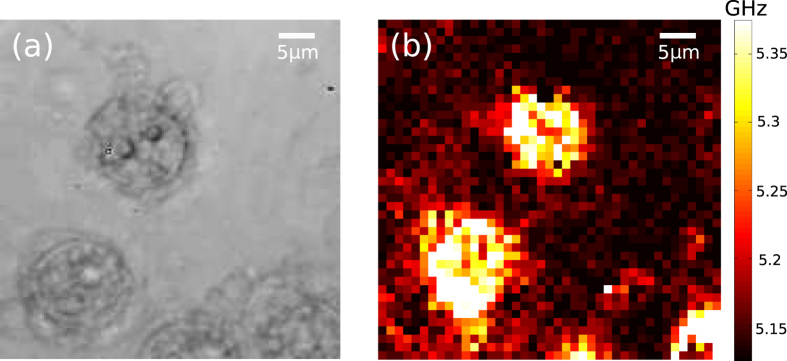
Figure 7
Imaging of delipidated cells using phonons.
( a ) Brightfield image of 3T3 fibroblast cells. ( b ) Map of the Brillouin shift obtained from the cell presented in ( a ). The appearance of the cells is considerable different than the living cells...
Figure images are served from the NIH/NLM PubMed Central Open Access Subset or Europe PMC; copyright remains with the publishers and authors.
💬 Discussion
0 commentsNo comments yet. Be the first to start a discussion!
Leave a Comment