Abstract
AbstractUnderstanding the structure and function of vasculature in the brain requires us to monitor distributed hemodynamics at high spatial and temporal resolution in three-dimensional (3D) volumes in vivo. Currently, a volumetric vasculature imaging method with sub-capillary spatial resolution and blood flow-resolving speed is lacking. Here, using two-photon laser scanning microscopy (TPLSM) with an axially extended Bessel focus, we capture volumetric hemodynamics in the awake mouse brain at a spatiotemporal resolution sufficient for measuring capillary size and blood flow. With Bessel TPLSM, the fluorescence signal of a vessel becomes proportional to its size, which enables convenient intensity-based analysis of vessel dilation and constriction dynamics in large volumes. We observe entrainment of vasodilation and vasoconstriction with pupil diameter and measure 3D blood flow at 99 volumes/second. Demonstrating high-throughput monitoring of hemodynamics in the awake brain, we expect Bessel TPLSM to make broad impacts on neurovasculature research.
🔬 Techniques
🔭 Microscopes
💻 Software
✨ Fluorophores
🧪 Sample Preparation
🏭 Microscope Brands
🧪 Reagent Suppliers
🔴 Lasers
📷 Detectors
🔎 Objectives
💻 Software Details
💾 Data Repositories
🏛️ Research Organizations (ROR)
Affiliated research institutions:
📋 Methods
Design and characterization of a commercial TPLSM with a Bessel focus module We designed and constructed a commercially available Thorlabs Bergamo® II multiphoton microscope with a Bessel focus module for high-speed volumetric imaging (Fig. 1a ). All hardware controls and data acquisition were performed using the ThorImage software. A titanium–sapphire laser (Chameleon Ultra II, Coherent Inc.) tuned to 920 nm was used as the two-photon excitation source for all experiments. A 16×/0.8-NA water-dipping objective lens (Nikon) was used for all characterization and imaging data in this study. Bessel and Gaussian beam paths were switchable using an integrated, software-controlled rotatable half-wave plate combined with a polarizing beamsplitter and a removable mirror. Compared to the Gaussian beam path, the Bessel beam path had an additional lens (focal length = 400 mm) with a liquid crystal SLM (ODPDM512-1064, Meadowlark Inc.) at its front focal plane and an annular aperture mask at its back focal plane. A 0-π concentric binary phase grating pattern was presented on the SLM so that its 1st order diffraction ring was focused on the annular mask by the lens. The annular mask was custom fabricated (chrome deposited on quartz, Photo Sciences Inc.) to block 0th and higher order diffractions and its parameters (inner diameter = 2.3 mm, outer diameter = 2.5 mm) were chosen to generate a Bessel focus with a theoretical axial full-width at half-maxima (FWHM) of 85 µm at the focal plane of the 16×/0.8-NA objective, as calculated following Lu et al. 31 . The annular mask was 4f-conjugated to the non-resonant galvo surface in the galvo-resonant galvo scanning system. Fluorescence emission was collected by two GaAsP photomultiplier tubes (PMTs) with emission filters for simultaneous 2-color imaging of green (525/50 nm) and red (607/70 nm) fluorescence (BDF25GR, Thorlabs). Post-objective laser power was measured with a power meter calibrated at 920 nm. The system was designed and built in collaboration with Thorlabs and is now a commercially available microscope system (Bergamo® II series). Then, 0.2-µm-diameter yellow-green fluorescent beads (FluoSpheres®, Thermo Fisher Scientific) attached to a glass slide were imaged using both the Gaussian and Bessel configurations of the microscope to measure the lateral and axial PSFs. 3D resolution was measured by taking the FWHM of the PSFs. The largest FOV achieved with the 16×/0.8 NA objective was 1.4 mm × 1.4 mm.
Show full methods section
Design and characterization of a commercial TPLSM with a Bessel focus module We designed and constructed a commercially available Thorlabs Bergamo® II multiphoton microscope with a Bessel focus module for high-speed volumetric imaging (Fig. 1a ). All hardware controls and data acquisition were performed using the ThorImage software. A titanium–sapphire laser (Chameleon Ultra II, Coherent Inc.) tuned to 920 nm was used as the two-photon excitation source for all experiments. A 16×/0.8-NA water-dipping objective lens (Nikon) was used for all characterization and imaging data in this study. Bessel and Gaussian beam paths were switchable using an integrated, software-controlled rotatable half-wave plate combined with a polarizing beamsplitter and a removable mirror. Compared to the Gaussian beam path, the Bessel beam path had an additional lens (focal length = 400 mm) with a liquid crystal SLM (ODPDM512-1064, Meadowlark Inc.) at its front focal plane and an annular aperture mask at its back focal plane. A 0-π concentric binary phase grating pattern was presented on the SLM so that its 1st order diffraction ring was focused on the annular mask by the lens. The annular mask was custom fabricated (chrome deposited on quartz, Photo Sciences Inc.) to block 0th and higher order diffractions and its parameters (inner diameter = 2.3 mm, outer diameter = 2.5 mm) were chosen to generate a Bessel focus with a theoretical axial full-width at half-maxima (FWHM) of 85 µm at the focal plane of the 16×/0.8-NA objective, as calculated following Lu et al. 31 . The annular mask was 4f-conjugated to the non-resonant galvo surface in the galvo-resonant galvo scanning system. Fluorescence emission was collected by two GaAsP photomultiplier tubes (PMTs) with emission filters for simultaneous 2-color imaging of green (525/50 nm) and red (607/70 nm) fluorescence (BDF25GR, Thorlabs). Post-objective laser power was measured with a power meter calibrated at 920 nm. The system was designed and built in collaboration with Thorlabs and is now a commercially available microscope system (Bergamo® II series). Then, 0.2-µm-diameter yellow-green fluorescent beads (FluoSpheres®, Thermo Fisher Scientific) attached to a glass slide were imaged using both the Gaussian and Bessel configurations of the microscope to measure the lateral and axial PSFs. 3D resolution was measured by taking the FWHM of the PSFs. The largest FOV achieved with the 16×/0.8 NA objective was 1.4 mm × 1.4 mm.
Mouse surgical preparation
All animal experiments were conducted according to the National Institutes of Health guidelines for animal research. Procedures and protocols on mice were approved by the Animal Care and Use Committee at the University of California, Berkeley. In vivo imaging data in this study were collected from four wild-type (Jackson Laboratories, Black 6, stock no. 000664), one Thy1-GFP (neuronal GFP expression, Jackson Laboratories, Tg(Thy1-EGFP)MJrs/J, stock no. 007788), and two Aldh1l1-GFP (pan-glial GFP expression, Mutant Mouse Resource & Research Centers, Tg(Aldh1l1-EGFP)OFC789Gsat/Mmucd, stock no. 011015-UCD) mice socially housed under normal light cycle and room temperature. Cranial window implantation procedure has been described previously 72 . In brief, mice aged 3–4 months were anesthetized with 1–2% isoflurane in O 2 combined with the analgesic buprenorphine (SC, 0.1 mg/kg) and head-fixed in a stereotaxic apparatus (Kopf Instruments). A 3.5-mm-diameter craniotomy was made over the left V1 centered at −2.5 mm medial-lateral and 1 mm anterior–posterior to lambda. A glass window made of a single coverslip (Fisher Scientific, no. 1.5) was embedded in the craniotomy, flush with the skull, and sealed by a tissue adhesive (VetBond, 3M). A stainless-steel head-bar was then firmly attached to the skull with dental acrylic. Implanted mice were provided with a post-operative analgesia Meloxicam (SC, 5 mg/kg) for 2 days and allowed to recover for at least 2 weeks prior to imaging experiments. In vivo imaging All imaging experiments were performed on head-fixed, awake mice. Prior to imaging, animals were briefly anesthetized with isoflurane and retro-orbitally injected with 50 µL of 5% (w/v) 70-kDa dextran-conjugated Texas Red fluorescent dye. Mice were then head-fixed under the objective lens. First, structural image stacks were taken using both Gaussian and Bessel beam paths at the largest FOV. For the two Aldh1l1-GFP transgenic mice, blood vessel (red) and glial (green) structures were imaged concurrently. Next, volumetric imaging of blood vessel dynamics was performed at 15 Hz (1024 × 1024-pixel frames) or 99 Hz (128 × 128-pixel frames) in distinct FOVs using the Bessel focus module. During some experiments, we concurrently imaged the mouse’s ipsilateral eye illuminated by infrared LEDs using a camera (Mako U-130B) with an infrared filter. The bright spot on the upper left quadrant of the pupil image (Fig. 4c ) was the reflection of the infrared illuminator and did not affect pupil diameter analysis. For high-resolution capillary imaging, small FOVs were imaged at 30 Hz (512 × 512-pixels per frame) with 0.2 µm pixel size, first with Gaussian then Bessel foci. Due to the higher fraction of energy distributed in the side rings of a Bessel focus compared to a Gaussian focus 34 , higher post-objective laser power was used for Bessel compared to Gaussian imaging at the same cortical depth (e.g., at 100 µm below pia surface, Bessel: 167–217 mW, Gaussian: 35–47 mW).
Data analysis
All image processing, visualization, and analysis were performed in ImageJ and MATLAB® (MathWorks). Image sequences from Bessel functional data were registered to remove rigid lateral motion artifacts before further analysis. In all figures, superficial Bessel data (0–100 µm below surface of dura mater), unless otherwise stated, were visualized using the gray lookup table on the square root of fluorescence signal (normalized from minimum to maximum) to improve the visibility of dim structures without saturating bright structures. All Gaussian data and all other Bessel data were visualized using the gray lookup table on their fluorescence signal (normalized from minimum to maximum). For Supplementary Fig. 1 and its associated analysis, fluorescence signal and blood vessel size of 60 vessel segments were measured in both the Bessel image (900 frame average) and the corresponding Gaussian stack (5 frame average, 1 µm step size). For the Bessel image, line segments of 1-pixel thickness were drawn perpendicular to the blood vessels. Fluorescence signals were chosen to be the brightest pixel along the line segments and vessel sizes were the total numbers of pixels above a common threshold. The threshold was calculated by first selecting a region without vessels near the center of the image then adding 3 standard deviations to the mean pixel value of the region. For the Gaussian image stack, a line segment was drawn perpendicular to the same blood vessel in the Bessel image and the stack was resliced to show the axial cross-section of the vessel: fluorescence intensity was chosen to be the brightest pixel in this 2D cross-section, and size was represented by the FWHM at the widest point in the cross-section. For Fig. 3 , 1-min-long 15 Hz functional data were used to study the relationship between fluorescence intensity and vasodilation. First, we performed a 5-frame (0.33 s) moving average of the raw frames to remove high-frequency fluorescence signal variations due to blood flow. For four blood vessels, we extracted the time traces of the average signal from 256-pixel-area (450 µm 2 ) ROIs fully encompassed within the lumen of the vessels and calculated their ΔF/F traces with F being the median value of the time trace. Blood vessel diameters were measured by thresholding the moving-averaged images at 3 standard deviations above the mean background signal near the blood vessel of interest, and then calculating the number of pixels above threshold within a 10-pixel-wide line segment drawn perpendicular to the vessel. The same analysis procedures were performed on four capillaries in higher resolution (0.2 µm × 0.2 µm pixel size) Gaussian and Bessel data in Supplementary Fig. 2 , with two additional steps. (1) Fluctuating background signal was removed from Bessel data with frame-by-frame subtraction of the background signal near the capillary of interest, then adding back a session-averaged background value. By doing this, capillary fluorescence measurements were decoupled from fluctuations originating from out-of-focus fluorescence such as large surface vessel dilations. (2) 30-Hz Gaussian and Bessel data were first temporally binned to 1 s resolution to suppress high-frequency blood-flow-introduced signal variation, followed by a 5-frame moving average on fluorescence and diameter measurements, which resulted in 5-s moving averages. For the signal correlation analysis in Fig. 3 f and g , large volume (1.4 mm × 1.4 mm × 0.1 mm) Bessel TPLSM raw images were spatially binned to 64 × 64 ROIs (each 16 × 16 pixels) by averaging all pixels within a ROI. The time trace of each ROI was then extracted and correlated with the time trace of a specified target ROI with a sliding window of ±10 frames. The absolute maximum correlation value within the sliding window was used to represent the cross-correlation coefficient between the ROI and target ROI. Supplementary Fig. 3c was created by first dividing standard deviation of the image time stack by the average image and plotted on a color scale. Then, the dimmest 80% of pixels in the average image that represented non-vasculature tissue were set to black. Supplementary Fig. 3d was created in the same way, with an initial binning to 64 × 64 ROIs. For the pupil-vessel entrainment experiment in Fig. 4 , 10-min-long 15 Hz functional images at 1024 × 1024-pixel resolution were also binned to 64 × 64 ROIs (each 16 × 16 pixels) by averaging all pixels within an ROI. We used a threshold and fitting method adapted from Diego Barragan (Title: Tracking pupil using image processing, MATLAB Central File Exchange) to extract pupil diameter from concurrently recorded mouse pupil images. We fit the pupil in each video frame as an oval, and used its width, rather than height, as pupil diameter to reduce squinting and blinking artifacts. The time trace of each ROI was correlated with the mouse’s pupil diameter with a sliding window of ±10 frames. The absolute maximum correlation value within the sliding window was used to represent the cross-correlation coefficient between the ROI and pupil diameter. For 3D blood flow speed measurement presented in Fig. 5 , blood vessel segments were hand-traced over the average intensity projection of 1-min-long 99 Hz datasets (two 208 µm × 208 µm × 80 µm volumes 0–80 µm below top pia surface in two mice; two 416 µm × 416 µm × 80 µm volumes 0–80 µm and 100–180 µm below the top pia surface, respectively, in two mice). Raw Bessel images were then resliced along the length of blood vessel segments and plotted in time as kymographs. Because RBCs excluded fluorescent dye and appeared as dark shadows, they generated diagonal dark streaks in kymographs 21 . We rejected from analysis blood vessel kymographs with little to no RBC streaks visible above the background fluorescence. We measured the 3D lengths of blood vessel segments from skeletonized Gaussian structural data and then nonlinearly transformed the horizontal axes of the kymographs from 2D Bessel projection length to 3D Gaussian structural length for further analysis. We adapted an automated method developed by Chhatbar and Kara 43 to measure the slope of RBC streaks using Sobel filtering and iterative Radon transforms and calculated blood flow speed every 50-frame (0.5 s) kymograph segment. We further rejected from analysis blood vessel segments that had more than one-third of its time trace showing very high (>5 mm/s) or reversed (
📊 Figures
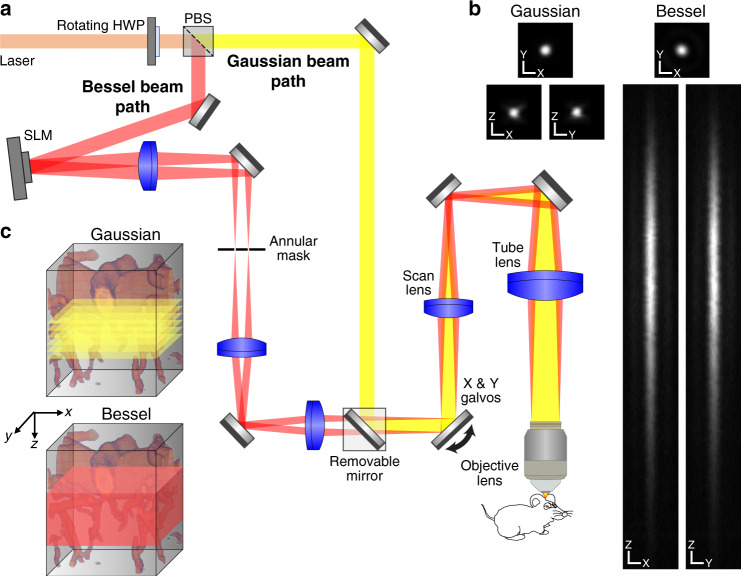
Fig. 1
Design and characterization of a commercial two-photon laser scanning microscope with a Bessel focus module.
a Schematic of the microscope. A half-wave plate (HWP), a polarizing beamsplitter (PBS), and a removable mirror allow switching between Bessel (red) and Gaussian (yellow) beam paths. In the Bessel pat...
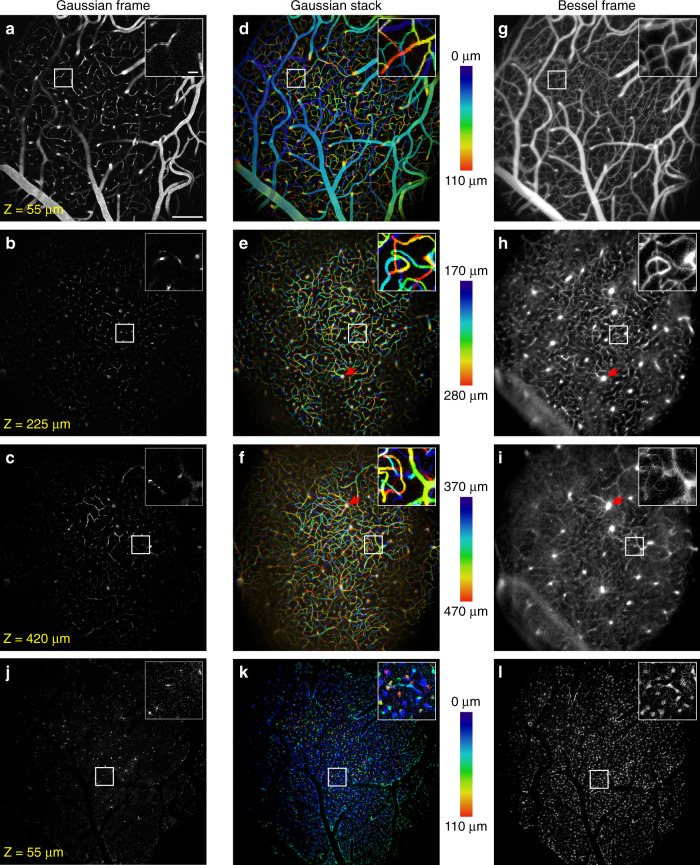
Fig. 2
In vivo volumetric structural imaging of vasculature and glia with Bessel TPLSM.
a u2013 c Gaussian TPLSM images of vasculature labeled with dextran-conjugated Texas Red at 55u2009u00b5m, 225u2009u00b5m, and 420u2009u00b5m depths, respectively, over a 1.4u2009mmu2009u00d7u20091.4u...
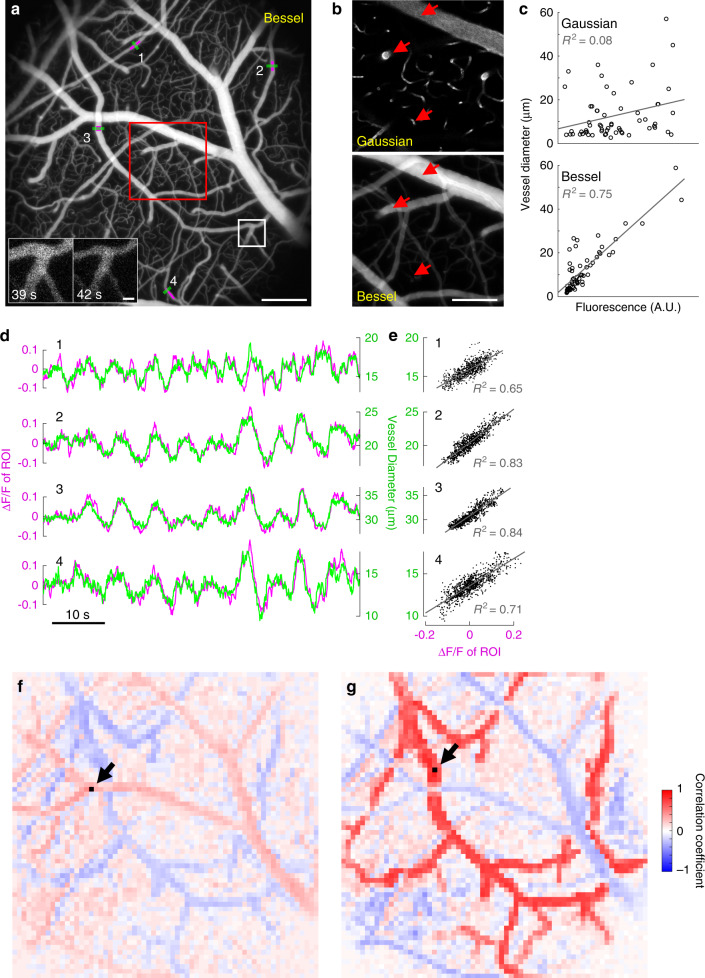
Fig. 3
Bessel TPLSM signal is correlated with vessel size and captures distributed dynamics of vasodilation and vasoconstriction in 3D.
a A 1.4u2009mmu2009u00d7u20091.4u2009mmu2009u00d7u20090.1u2009mm volume of vasculature imaged at 15u2009Hz using Bessel TPLSM, visualized in grayscale on the normalized square root of fluorescence sig...
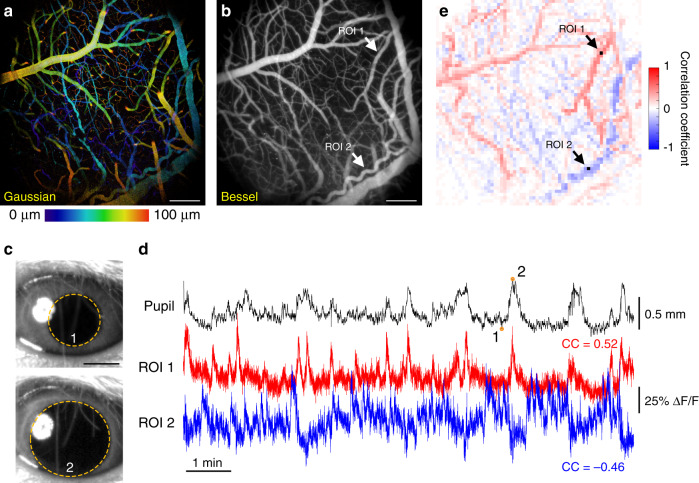
Fig. 4
Entrainment of vasodilation and vasoconstriction of a 3D vasculature network with pupil diameter measured by Bessel TPLSM.
a A 1.4u2009mmu2009u00d7u20091.4u2009mmu2009u00d7u20090.1u2009mm volume of vasculature imaged at 15u2009Hz with Gaussian TPLSM, color-coded by depth. b Bessel TPLSM image of the same volume in a , vis...
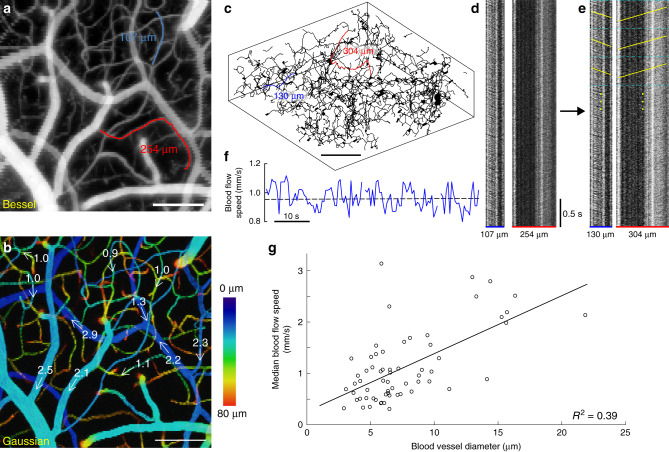
Fig. 5
High-speed volumetric measurement of cerebral blood flow speed with Bessel TPLSM.
a Bessel image of a 416u2009u00b5mu2009u00d7u2009416u2009u00b5mu2009u00d7u200980u2009u00b5m volume of vasculature that was imaged at 99u2009Hz with Bessel TPLSM for blood flow speed measurements, with...
Figure images are served from the NIH/NLM PubMed Central Open Access Subset or Europe PMC; copyright remains with the publishers and authors.
💬 Discussion
0 commentsNo comments yet. Be the first to start a discussion!
Leave a Comment