Abstract
The overwhelming success of exome- and genome-wide association studies in discovering thousands of disease-associated genes necessitates developing novel high-throughput functional genomics approaches to elucidate the molecular mechanisms of these genes. Here, we have coupled multiplexed repression of neurodevelopmental disease–associated genes to single-cell transcriptional profiling in differentiating human neurons to rapidly assay the functions of multiple genes in a disease-relevant context, assess potentially convergent mechanisms, and prioritize genes for specific functional assays. For a set of 13 autism spectrum disorder (ASD)–associated genes, we show that this approach generated important mechanistic insights, revealing two functionally convergent modules of ASD genes: one that delays neuron differentiation and one that accelerates it. Five genes that delay neuron differentiation ( ADNP , ARID1B , ASH1L , CHD2 , and DYRK1A ) mechanistically converge, as they all dysregulate genes involved in cell-cycle control and progenitor cell proliferation. Live-cell imaging after individual ASD-gene repression validated this functional module, confirming that these genes reduce neural progenitor cell proliferation and neurite growth. Finally, these functionally convergent ASD gene modules predicted shared clinical phenotypes among individuals with mutations in these genes. Altogether, these results show the utility of a novel and simple approach for the rapid functional elucidation of neurodevelopmental disease-associated genes.
🔬 Techniques
💻 Software
✨ Fluorophores
🧪 Sample Preparation
🔬 Cell Lines
🧪 Reagent Suppliers
💻 Software Details
💾 Data Repositories
🏛️ Research Organizations (ROR)
Affiliated research institutions:
📋 Methods
Cell culture
HEK293T cells were maintained in Dulbecco's Modified Eagle Media (DMEM) supplemented with 10% fetal bovine serum and 1% penicillin-streptomycin, and passaged every 3–4 d after enzymatic dissociation using trypsin. LUHMES cells (ATCC CRL-2927) were cultured according to established protocols with minor modifications as described in the Supplemental Methods ( Scholz et al. 2011 ). Polyclonal dCas9-KRAB-blast expressing LUHMES were generated by infecting cells with lentivirus and selecting using blasticidin (10 µg/mL). Lenti-dCas9-KRAB-blast was a gift from Gary Hon (Addgene 89567) ( Xie et al. 2017 ).
Human iPSC-derived neural progenitor cells
(XCL4) were acquired from STEMCELL Technologies (catalog number 70902) and grown in neural progenitor medium 2. Although now discontinued by STEMCELL Technologies, these reagents are available from XCell Science. Tetracycline-inducible dCas9-KRAB NPCs were generated after neomycin selection (200 µg/mL). pHAGE TRE dCas9-KRAB was a gift from Rene Maehr and Scot Wolfe (Addgene 50917) ( Kearns et al. 2014 ). For proliferation assays, TRE dCas9-KRAB XCL4 cells were infected in quadruplicate with individual gRNAs targeting seven ASD genes and one nontargeting gRNA. After puromycin selection and doxycycline induction, cells were plated at equal cell numbers and grown for 8 d, and total cells were counted using a hemocytometer. Cell counts were compared with cells infected with a nontargeting gRNA. gRNA cloning For each target gene, we selected three gRNAs optimized for repression from the Dolcetto library ( Sanson et al. 2018 ) and cloned them into a CRISPR-repression optimized vector to enable pooled lentiviral preparation without guide-barcode swapping ( Supplemental Methods ; Hill et al. 2018 ; Sanson et al. 2018 ; Xie et al. 2018 ). CROP-seq-opti was a gift from Jay Shendure (Addgene 106280) ( Hill et al. 2018 ).
Show full methods section
Cell culture
HEK293T cells were maintained in Dulbecco's Modified Eagle Media (DMEM) supplemented with 10% fetal bovine serum and 1% penicillin-streptomycin, and passaged every 3–4 d after enzymatic dissociation using trypsin. LUHMES cells (ATCC CRL-2927) were cultured according to established protocols with minor modifications as described in the Supplemental Methods ( Scholz et al. 2011 ). Polyclonal dCas9-KRAB-blast expressing LUHMES were generated by infecting cells with lentivirus and selecting using blasticidin (10 µg/mL). Lenti-dCas9-KRAB-blast was a gift from Gary Hon (Addgene 89567) ( Xie et al. 2017 ).
Human iPSC-derived neural progenitor cells
(XCL4) were acquired from STEMCELL Technologies (catalog number 70902) and grown in neural progenitor medium 2. Although now discontinued by STEMCELL Technologies, these reagents are available from XCell Science. Tetracycline-inducible dCas9-KRAB NPCs were generated after neomycin selection (200 µg/mL). pHAGE TRE dCas9-KRAB was a gift from Rene Maehr and Scot Wolfe (Addgene 50917) ( Kearns et al. 2014 ). For proliferation assays, TRE dCas9-KRAB XCL4 cells were infected in quadruplicate with individual gRNAs targeting seven ASD genes and one nontargeting gRNA. After puromycin selection and doxycycline induction, cells were plated at equal cell numbers and grown for 8 d, and total cells were counted using a hemocytometer. Cell counts were compared with cells infected with a nontargeting gRNA. gRNA cloning For each target gene, we selected three gRNAs optimized for repression from the Dolcetto library ( Sanson et al. 2018 ) and cloned them into a CRISPR-repression optimized vector to enable pooled lentiviral preparation without guide-barcode swapping ( Supplemental Methods ; Hill et al. 2018 ; Sanson et al. 2018 ; Xie et al. 2018 ). CROP-seq-opti was a gift from Jay Shendure (Addgene 106280) ( Hill et al. 2018 ).
Lentivirus production of individual gRNAs and pooled gRNA libraries
Lentivirus was produced according to established protocols. In brief, HEK293T cells were seeded at a density of 1 million cells per well of a six-well plate and transfected with 2 μg of DNA comprising 1 µg gRNA-transfer plasmid, 750 ng psPAX2, and 250 ng pMD2.G. psPAX2 and pMD2.G were gifts from Didier Trono (Addgene 12259 and 12260). Cells were transfected using the PEI method (Polysciences). Media was changed 12 h after transfection, and viral-containing supernatant was collected 24 and 48 h later. Lentivirus was concentrated using Lenti-X reagent and resuspended in 50-µL aliquots from each milliliter of original supernatant (20× concentration). Lentivirus was titrated on LUHMES cells by infecting cells with serial dilutions of virus, followed by antibiotic selection (puromycin for gRNAs, 1 µg/mL). For pooled gRNA libraries, equal amounts of DNA for each gRNA were mixed prior to transfection.
Lentiviral transduction of gRNAs
For individual or pooled gRNAs, LUHMES cells were infected with serial dilutions of virus. Virus-containing media were removed after 4–6 h of transduction. Antibiotic selection with puromycin (1 µg/mL) was applied 24 h after infection. Wells in which no more than 25% of cells survived, corresponding to multiplicity of infection 99% of all cells formed a single cluster of postmitotic neurons as defined by the absence of proliferative marker expression ( Supplemental Fig S3A,B ). This is consistent with our experimental design capturing a single time point (day 7) in a rapid isogenic model of neuronal differentiation. Within the major cluster, however, the expression of markers of neuronal differentiation showed variable patterns across the UMAP ( Supplemental Fig S3C–E ). Moreover, the most variably expressed genes in single-cell transcriptomes were enriched for functional roles in neurogenesis and axon projection, suggesting heterogeneity of neuronal differentiation at the single-cell level. We did not observe batch effects on global clustering ( Supplemental Fig. S3F ).
Pseudotime analysis
We projected cells in pseudotime in Monocle by ordering cells by highly variable genes. Dimensionality reduction was performed using the “DDRTree” method. Trajectories based on different sets of highly variable genes were qualitatively similar, showing a single trajectory with only minor branching. The pseudotime trajectory is composed of individual line segments called pseudotime “states.” To ensure high correlation between pseudotime and neuron differentiation status, we computed the state-specific genes in the bulk RNA-seq data set for each day of differentiation and used these genes for pseudotime ordering. We then transferred pseudotime state labels into Seurat to discover marker genes for each pseudotime state. Transferring pseudotime labels onto the UMAP plot showed distinct banding patterns representing subtle transcriptional state differences within the main cluster ( Supplemental Fig. S10A,B ). Reclustering cells in the earliest and latest pseudotime states revealed two completely distinct cell states expressing either differentiation ( NEUROD1 ) or maturation ( STMN2 ) markers ( Supplemental Fig. S10C–E ; Dennis et al. 2019 ; Polioudakis et al. 2019 ). This confirms that pseudotime is more sensitive to detect biologically relevant transcriptional patterns than UMAP clustering in our data set. We tested for altered pseudotime state membership proportions for each gRNA using χ-squared tests, computed the distribution of pseudotime state scores for each gRNA, and compared their averages using t -tests ( Supplemental Methods ).
Transition mapping of LUHMES differentiation
Transition mapping allows the comparison of in vitro neuron differentiation to in vivo development by computing the overlap of differentially expressed genes at selected time points across data sets ( Stein et al. 2014 ). We compared the in vitro LUHMES differentiation time points day 0 to day 8 to transcriptional changes across brain regions and developmental time points in the BrainSpan Atlas of the Developing Human Brain. LUHMES differentiation had the strongest overlap with transcriptional changes occurring in the cortex of postconception week-8 to week-10 embryos and week-10 to week-13 embryos.
Differential gene expression analysis
Differential gene expression testing was performed using the FindMarkerGenes function in Seurat using the Wilcoxon rank sum test and a relaxed log 2 fold-change threshold of 0.1 to increase the number of differentially expressed genes. This cutoff was calibrated against a gold-standard data set comparing single-cell and bulk RNA-seq data to identify differentially expressed genes ( Avey et al. 2018 ). To find marker genes of pseudotime state clusters, only positive markers were returned. Pseudotime state was binarized with states 1–3 labeled as “early” and states 4–6 as “late.” We next created another label combining the targeted gene with binary pseudotime state (e.g., CHD8_early). Averaged transcriptional profiles were recomputed for each group based on these new labels, and differentially expressed genes were also recalculated. PCA and hierarchical clustering were performed on these samples. As expected, unsupervised clustering of the stratified profiles by PCA perfectly discriminated between “early” and “late” samples ( Supplemental Fig. S6D ). This analysis showed that the first principal component corresponds to pseudotime status and explains almost 20% of the total variance in the data set. Gene Ontology and pathway enrichment analyses were performed using WebGestalt ( Wang et al. 2017 ).
Live-cell imaging
Cells were imaged using an IncuCyte S3 live imaging system (Essen BioScience) For each experiment, dCas9-KRAB LUHMES were infected in duplicate or triplicate with individual gRNAs and were plated in duplicate or triplicate in wells of a 24-well plate in either self-renewing or differentiation conditions. Nine fields per well were imaged every 4 h for either 3 or 5 d for proliferation or differentiation, respectively. These experiments were repeated two or three times for each individual gRNA. Images were analyzed using the IncuCyte Software. Specifically, we performed the proliferation analysis and NeuroTrack neurite tracing analyses with default parameters. Cell bodies and neurites were detected from phase contrast images. Representative images are shown in Supplemental Figure S7 .
📊 Figures
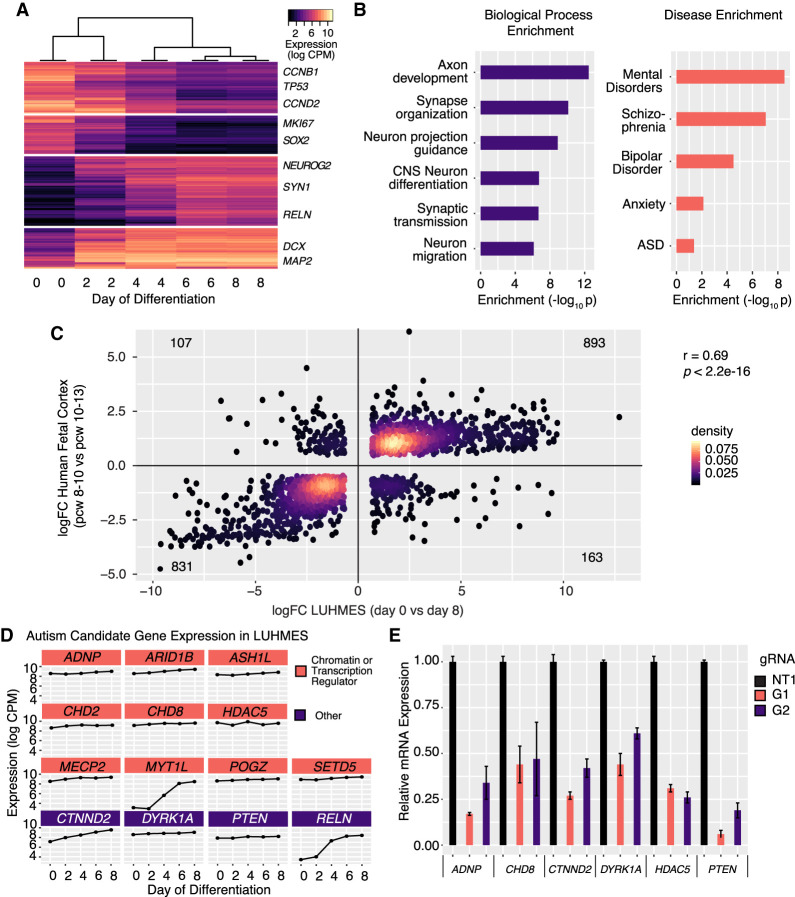
Figure 1.
LUHMES are a tractable, disease-relevant model of human neuronal differentiation amenable to perturbation. ( A ) Hierarchical clustering of bulk RNA-seq time course expression data indicates rapid and...
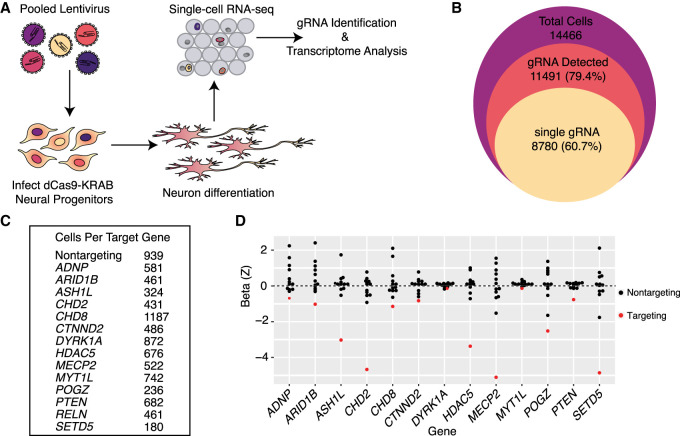
Figure 2.
Single-cell RNA-seq is an efficient readout of multiplexed gene repression in a human model of neuronal differentiation. ( A ) Schematic of pooled repression of ASD genes in LUHMES. ( B ) The numbers ...
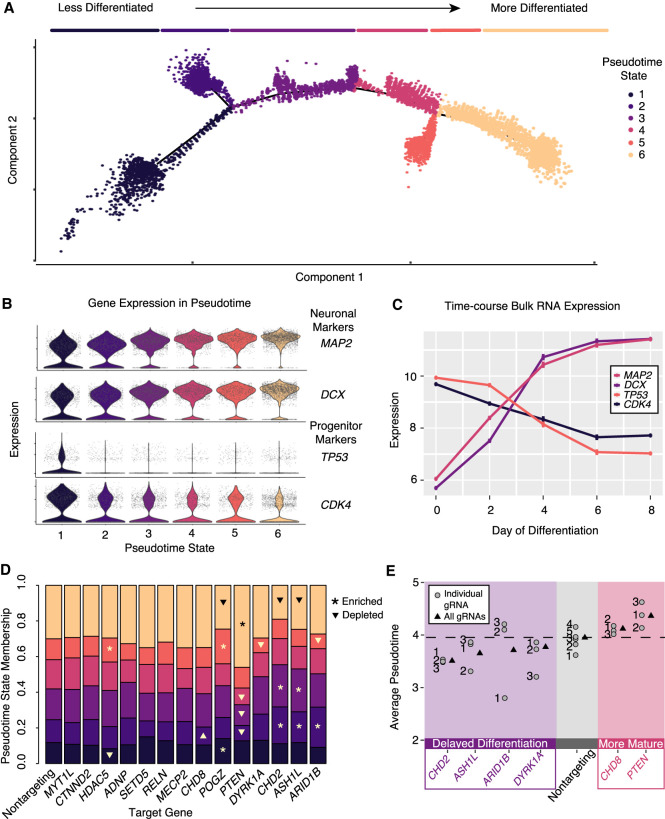
Figure 3.
Pseudotime analysis reveals ASD-gene repressionu2013induced alterations in differentiation trajectory and modules of ASD genes delaying or accelerating neuronal differentiation. ( A ) Pseudotime order...
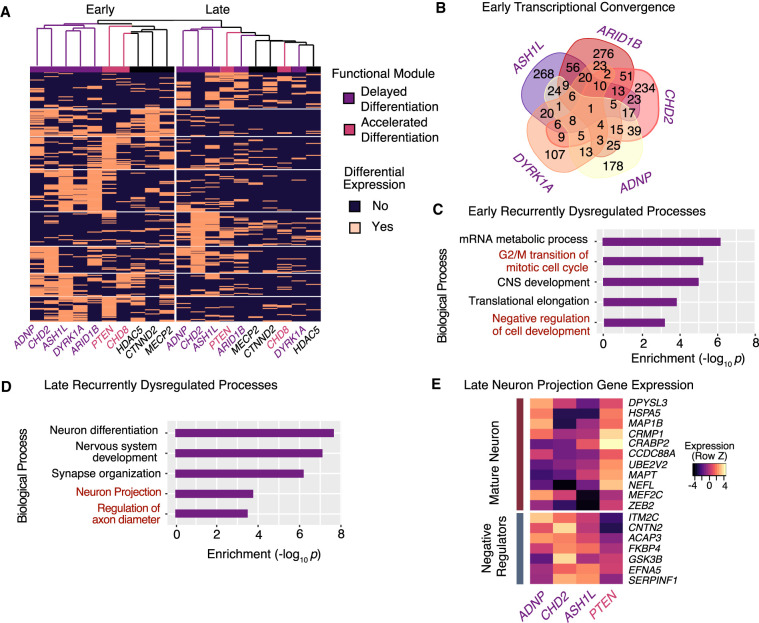
Figure 4.
Single-cell differential gene expression analysis identifies early- and late-stage convergent modules of ASD genes. ( A ) Hierarchical clustering of ASD knockdown profiles using genes differentially e...
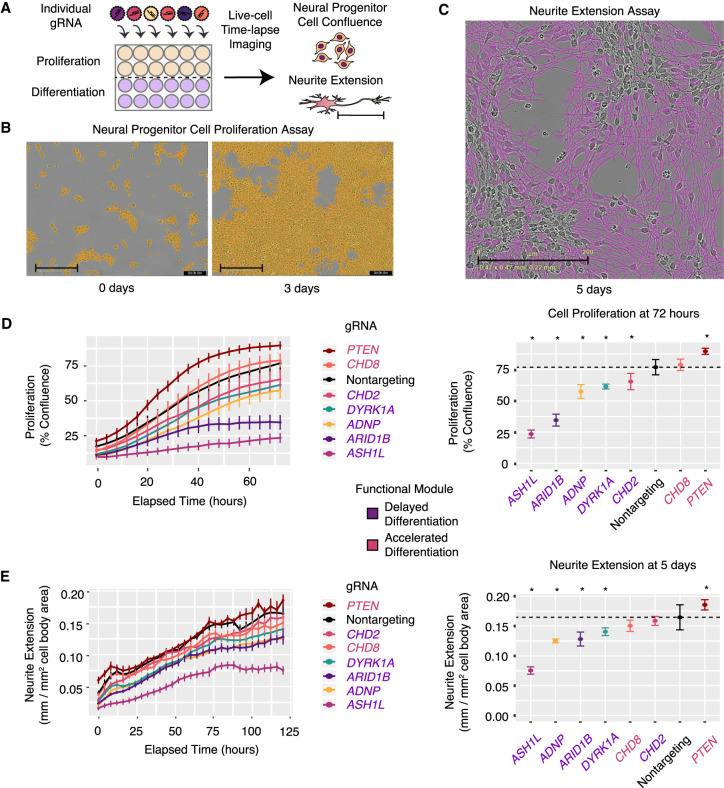
Figure 5.
Live-cell imaging after repression of individual ASD genes confirms defects in cellular proliferation and neurite extension. ( A ) Schematic overview of arrayed gRNA screening. Cells infected with a s...
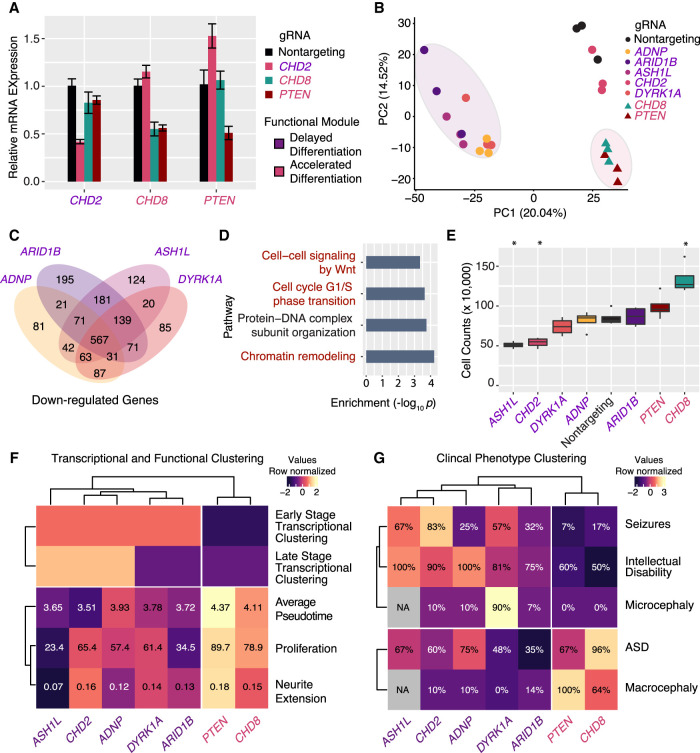
Figure 6.
CRISPR repression in iPSC neural progenitor cells confirms modules of ASD genes and transcriptional convergence at cell-cycle dysregulation. Experimental clustering of functional ASD gene modules matc...
Figure images are served from the NIH/NLM PubMed Central Open Access Subset or Europe PMC; copyright remains with the publishers and authors.
💬 Discussion
0 commentsNo comments yet. Be the first to start a discussion!
Leave a Comment