Abstract
The fusion of the gametes upon fertilization results in the formation of a totipotent cell. Embryonic chromatin is expected to be able to support a large degree of plasticity. However, whether this plasticity relies on a particular conformation of the embryonic chromatin is unknown. Moreover, whether chromatin plasticity is functionally linked to cellular potency has not been addressed. Here, we adapted fluorescence recovery after photobleaching (FRAP) in the developing mouse embryo and show that mobility of the core histones H2A, H3.1, and H3.2 is unusually high in two-cell stage embryos and decreases as development proceeds. The transition toward pluripotency is accompanied by a decrease in histone mobility, and, upon lineage allocation, pluripotent cells retain higher mobility than the differentiated trophectoderm. Importantly, totipotent two-cell-like embryonic stem cells also display high core histone mobility, implying that reprogramming toward totipotency entails changes in chromatin mobility. Our data suggest that changes in chromatin dynamics underlie the transitions in cellular plasticity and that higher chromatin mobility is at the nuclear foundations of totipotency.
🔬 Techniques
💻 Software
✨ Fluorophores
🧪 Sample Preparation
🔬 Cell Lines
🏭 Microscope Brands
📷 Detectors
💻 Software Details
🏛️ Research Organizations (ROR)
Affiliated research institutions:
📋 Methods
Embryo collection and microinjection
Embryos were collected from F1 (C57BL/6 × CBA/H) crosses on superovulation. Human H3.1 ( Santenard et al. 2010 ), H3.2, H3.3 ( Santenard et al. 2010 ), and H2A (HIST1H2AK) cDNAs were subcloned into pRN3P plasmid, and corresponding mRNAs were transcribed in vitro, as described previously ( Santenard et al. 2010 ). All fusions were cloned with EGFP in the C terminus, and all plasmids have identical 3′ and 5′ untranslated regions (UTRs). For the FRAP analysis in blastocysts, the levels of GFP in the blastocyst were too noisy when microinjection was performed in the zygote. Thus, to overcome this limitation, both blastomeres of two-cell stage embryos, collected at 45 h after administration of human chorionic gonadotropin (hphCG), were injected with identical concentrations of mRNA. We previously determined that recovery rates are independent of protein levels (see Supplemental Fig. S4). We verified incorporation of histones into chromatin (see the Supplemental Material).
FRAP microscopy
FRAP was performed using a Leica SP2 confocal microscope and at 37°C using a 63.0 × 1.4 oil objective. Embryos were placed in drops of M2 medium on a glass-bottomed dish. A rectangular region of interest of 2.28 μm 2 was chosen randomly within a nucleus, avoiding the NLBs, and was subjected to FRAP. Ten prebleach frames were acquired followed by two bleach pulses without acquisition. Recovery of fluorescence was followed during 60 sec, with 1 frame per second. The raw data were processed with Fiji software (ImageJ). All analysis was done on background-subtracted values using EasyFRAP (see the Supplemental Material for a thorough description). The obtained curves were normalized using the full-scale normalization method so that the first post-bleach frame was set to 0. Normalized curves were then subjected to curve fitting.
Show full methods section
Embryo collection and microinjection
Embryos were collected from F1 (C57BL/6 × CBA/H) crosses on superovulation. Human H3.1 ( Santenard et al. 2010 ), H3.2, H3.3 ( Santenard et al. 2010 ), and H2A (HIST1H2AK) cDNAs were subcloned into pRN3P plasmid, and corresponding mRNAs were transcribed in vitro, as described previously ( Santenard et al. 2010 ). All fusions were cloned with EGFP in the C terminus, and all plasmids have identical 3′ and 5′ untranslated regions (UTRs). For the FRAP analysis in blastocysts, the levels of GFP in the blastocyst were too noisy when microinjection was performed in the zygote. Thus, to overcome this limitation, both blastomeres of two-cell stage embryos, collected at 45 h after administration of human chorionic gonadotropin (hphCG), were injected with identical concentrations of mRNA. We previously determined that recovery rates are independent of protein levels (see Supplemental Fig. S4). We verified incorporation of histones into chromatin (see the Supplemental Material).
FRAP microscopy
FRAP was performed using a Leica SP2 confocal microscope and at 37°C using a 63.0 × 1.4 oil objective. Embryos were placed in drops of M2 medium on a glass-bottomed dish. A rectangular region of interest of 2.28 μm 2 was chosen randomly within a nucleus, avoiding the NLBs, and was subjected to FRAP. Ten prebleach frames were acquired followed by two bleach pulses without acquisition. Recovery of fluorescence was followed during 60 sec, with 1 frame per second. The raw data were processed with Fiji software (ImageJ). All analysis was done on background-subtracted values using EasyFRAP (see the Supplemental Material for a thorough description). The obtained curves were normalized using the full-scale normalization method so that the first post-bleach frame was set to 0. Normalized curves were then subjected to curve fitting.
Curve fitting and statistical analysis
Experimentally obtained and normalized recovery curves were fit using Prism6 software (GraphPad Software). A two-phase exponential association equation, Y = Ymax1 × [1 − e (− K1 × X )] + Ymax2 × [1 − e (− K2 × X )], was used to obtain mobile fractions and reaction rates, as this has been previously described to be appropriate for nuclear proteins ( Phair and Misteli 2000 ). Unpaired t -tests were used for comparing two groups. Throughout the study, Ymax1 values are used for mobile fraction estimation, as they reflect the steady-state protein pool, unless otherwise stated.
Electron microscopy
Embryos at the two-cell ( n = 3) and eight-cell ( n = 3) stages were collected after natural matings of B6CBAF1/J mice, fixed, and contrasted with osmium tetroxide and 1% uranyl acetate for 1 h. Samples were observed with a transmission electron microscope using an Orius 1000 CCD camera. Quantification of electron-dense regions was performed with a dedicated analysis pipeline implemented in ImageJ and MatLab (Supplemental Fig. S8).
📊 Figures
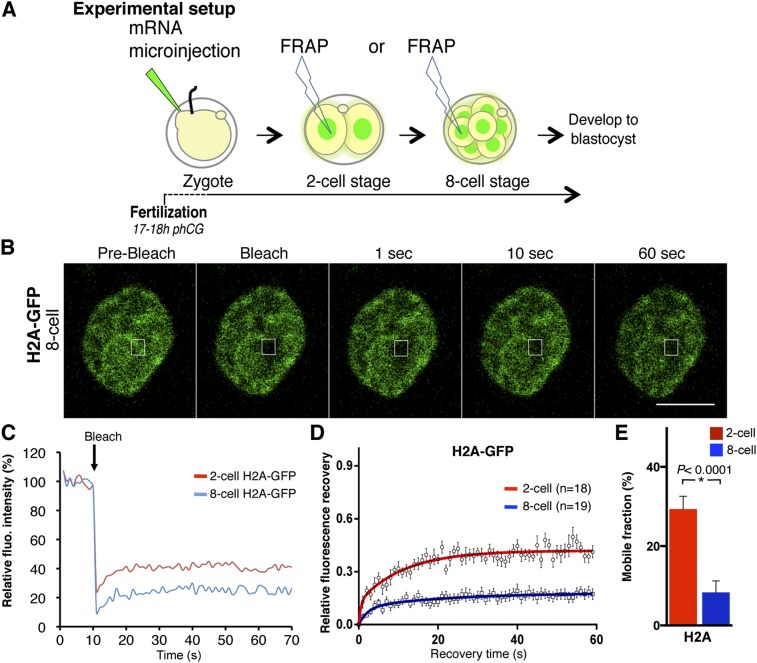
Figure 1.
FRAP analysis of chromatin components in the developing mouse embryo reveals a decrease in chromatin mobility of H2A-GFP. ( A ) Experimental setup for FRAP in embryos. Zygotes were collected and micro...
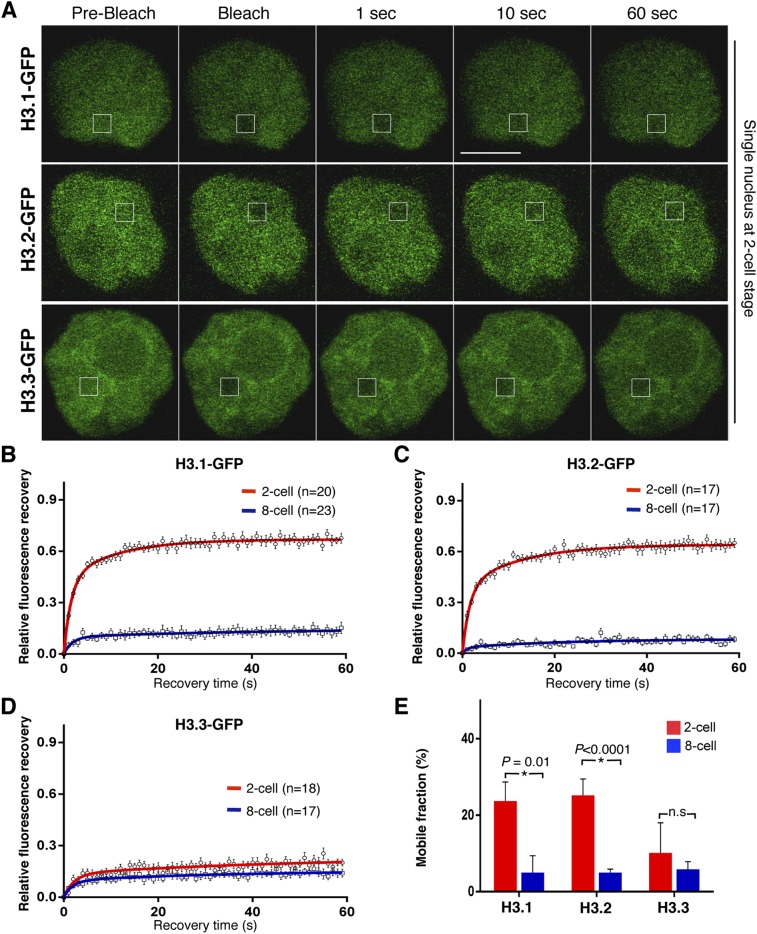
Figure 2.
Mobility of core histones H3.1-GFP and H3.2-GFP decreases between the two-cell and the eight-cell stages, but H3.3-GFP mobility remains unchanged. ( A ) Nuclei of two-cell stage embryos expressing eit...
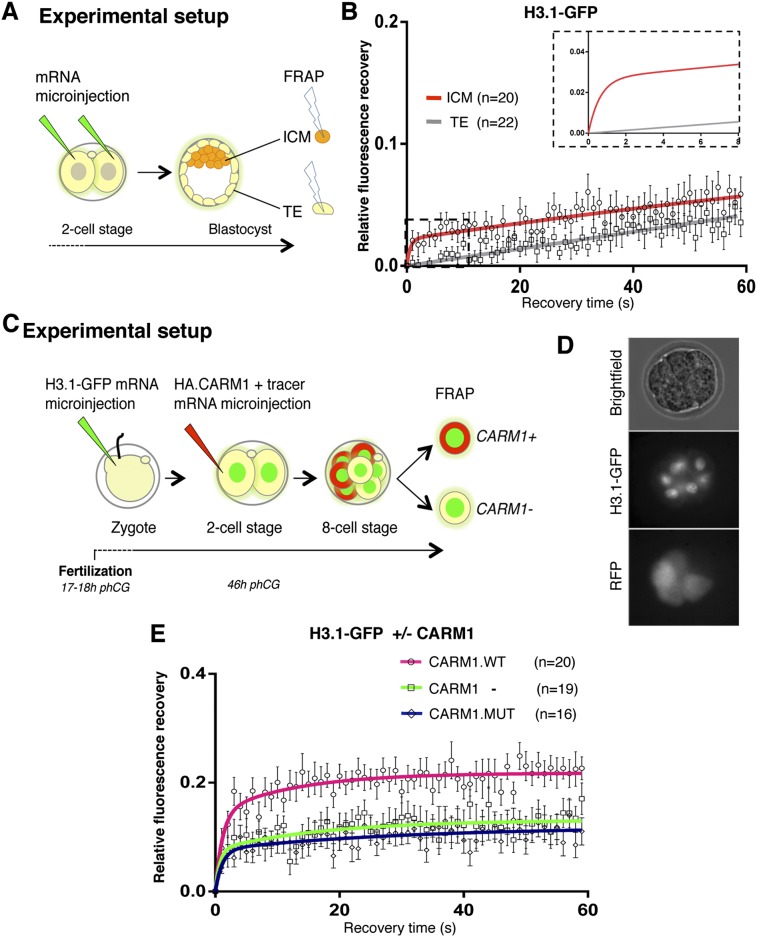
Figure 3.
Pluripotent cells retain high chromatin mobility upon lineage allocation. ( A ) The two blastomeres of a two-cell stage embryo were microinjected with equal amounts of H3.1-GFP mRNA, and embryos were ...
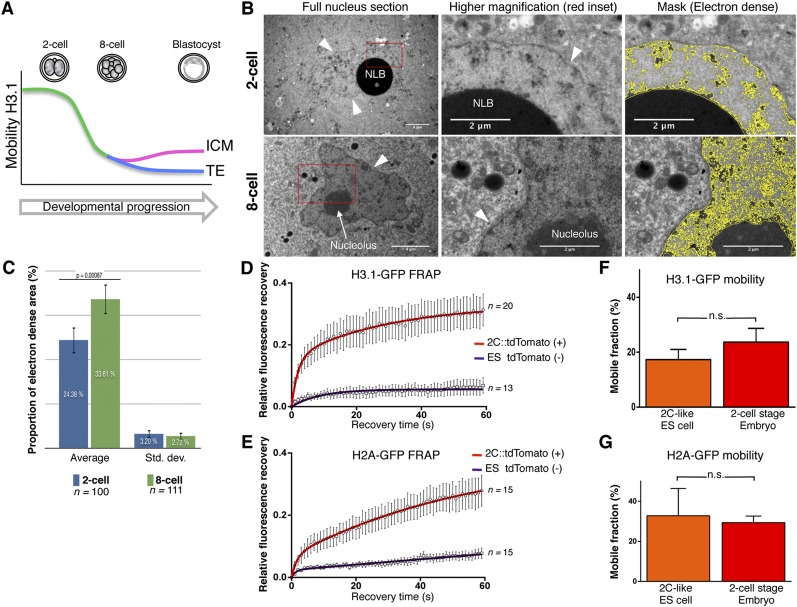
Figure 4.
Totipotent cells display unusually high chromatin mobility and loose chromatin ultrastructure. ( A ) Schematic summary of H3.1-GFP mobility throughout development. ( B ) Electron micrographs of two-ce...
Figure images are served from the NIH/NLM PubMed Central Open Access Subset or Europe PMC; copyright remains with the publishers and authors.
💬 Discussion
0 commentsNo comments yet. Be the first to start a discussion!
Leave a Comment