Abstract
Nerves of the peripheral nervous system have, to some extent, the ability to regenerate after injury, particularly in instances of crush or contusion injuries. After a controlled crush injury of the rat sciatic nerve, demyelination and remyelination are followed with functional assessments and imaged both ex vivo and in vivo over the course of 4 weeks with video-rate coherent anti-Stokes Raman scattering (CARS) microscopy. A new procedure compatible with live animal imaging is developed for performing histomorphometry of myelinated axons. This allows quantification of demyelination proximal and remyelination distal to the crush site ex vivo and in vivo respectively.
🔬 Techniques
🔬 Cell Lines
🏭 Microscope Brands
💻 Software Details
🏛️ Research Organizations (ROR)
Affiliated research institutions:
📋 Methods
2.1.
Animal model
We have used the sciatic nerve of Sprague Dawley rats as a model for this study. Approval was obtained from our local institutional animal care and use committee. Surgical exposure of the sciatic nerve was achieved by means of a dorsolateral muscle splitting incision. A standardized demyelinating crush injury was reproduced in all animals (14) by means of a #5 jeweler’s forceps held closed across the nerve for 30 seconds. Functional assessment of the sciatic nerve was carried out by means of a walking track analysis. Following sciatic nerve injury and during subsequent recovery, the hindprint of the rat undergoes several morphological changes from which a sciatic function index (SFI) can be calculated [ 13 ]. Prints were obtained by coating the animal hindpaws in ink and allowing it to walk down a paper-lined track. The resulting SFI allows for a longitudinal functional assessment of sciatic nerve regeneration. For the purpose of imaging, the animal was anaesthetized (intraperitoneal injection of pentobarbital) and surgery was performed to expose the sciatic nerve. The animal is then mounted on an adapted stage that is incorporated into a custom-built upright multimodal video-rate microscope. Imaging with confocal reflectance (detecting the pump beam) and CARS is performed simultaneously. 2.2.
CARS microscope
The custom-made video-rate laser scanning microscope and laser sources were described previously [ 3 , 14 ]. Briefly, the CARS microscope consists of two synchronized laser sources with a custom-built microscope. The Stokes pulse is provided by a 10 W, 7 ps Nd:Vanadate pulsed laser (picoTRAIN, High Q Laser) operating at 1064 nm while the pump pulse, at a wavelength of 816.8 nm, is obtained from a synchronously pumped OPO (Levante Emerald ps, APE) generating approximately 400 mW at 80 MHz. Both beams are recombined spatially and temporally with a dichroic mirror mounted on a delay line and are sent to the video-rate laser scanning microscope acquiring two channels simultaneously at a frame rate of 30 images per second. The confocal reflectance channel is captured by an avalanche photodiode (InGaAs, CMC Electronics) while the CARS channel is recorded with a red-sensitive photomultiplier tube (R3896, Hamamatsu) in a non-descanned configuration. After accounting for losses through the scanning system, the dichroics and the 63× objective (UIS-UPLAPO, 1.2 NA / w, Olympus), a total of 50 to 100 mW (pump and Stokes beams) was incident on the sample. The contrast obtained with CARS microscopy arises because the frequency difference of the pump and Stokes beam is chosen to resonantly excite the CH 2 symmetric stretch vibrational mode at 2845 cm −1 , predominantly localized in lipids. Schwann cells and the myelin they produce are lipid-rich molecules [ 15 ] and account for the majority of the CARS signal in this case. 2.3.
Show full methods section
2.1.
Animal model
We have used the sciatic nerve of Sprague Dawley rats as a model for this study. Approval was obtained from our local institutional animal care and use committee. Surgical exposure of the sciatic nerve was achieved by means of a dorsolateral muscle splitting incision. A standardized demyelinating crush injury was reproduced in all animals (14) by means of a #5 jeweler’s forceps held closed across the nerve for 30 seconds. Functional assessment of the sciatic nerve was carried out by means of a walking track analysis. Following sciatic nerve injury and during subsequent recovery, the hindprint of the rat undergoes several morphological changes from which a sciatic function index (SFI) can be calculated [ 13 ]. Prints were obtained by coating the animal hindpaws in ink and allowing it to walk down a paper-lined track. The resulting SFI allows for a longitudinal functional assessment of sciatic nerve regeneration. For the purpose of imaging, the animal was anaesthetized (intraperitoneal injection of pentobarbital) and surgery was performed to expose the sciatic nerve. The animal is then mounted on an adapted stage that is incorporated into a custom-built upright multimodal video-rate microscope. Imaging with confocal reflectance (detecting the pump beam) and CARS is performed simultaneously. 2.2.
CARS microscope
The custom-made video-rate laser scanning microscope and laser sources were described previously [ 3 , 14 ]. Briefly, the CARS microscope consists of two synchronized laser sources with a custom-built microscope. The Stokes pulse is provided by a 10 W, 7 ps Nd:Vanadate pulsed laser (picoTRAIN, High Q Laser) operating at 1064 nm while the pump pulse, at a wavelength of 816.8 nm, is obtained from a synchronously pumped OPO (Levante Emerald ps, APE) generating approximately 400 mW at 80 MHz. Both beams are recombined spatially and temporally with a dichroic mirror mounted on a delay line and are sent to the video-rate laser scanning microscope acquiring two channels simultaneously at a frame rate of 30 images per second. The confocal reflectance channel is captured by an avalanche photodiode (InGaAs, CMC Electronics) while the CARS channel is recorded with a red-sensitive photomultiplier tube (R3896, Hamamatsu) in a non-descanned configuration. After accounting for losses through the scanning system, the dichroics and the 63× objective (UIS-UPLAPO, 1.2 NA / w, Olympus), a total of 50 to 100 mW (pump and Stokes beams) was incident on the sample. The contrast obtained with CARS microscopy arises because the frequency difference of the pump and Stokes beam is chosen to resonantly excite the CH 2 symmetric stretch vibrational mode at 2845 cm −1 , predominantly localized in lipids. Schwann cells and the myelin they produce are lipid-rich molecules [ 15 ] and account for the majority of the CARS signal in this case. 2.3.
Image acquisition
Confocal reflectance is used as a guidance modality to confirm position and nature of the tissue in question prior to imaging with CARS. During the imaging session, animal breathing leads to lateral shifts between subsequent frames. A real-time movement correction algorithm, based on tracking the maximum of the 2d cross-correlation function [ 16 ] of following frames, is used to permit long integration times. Axial movement of the animal (up / down) is reduced by mechanically restricting leg movements. An image is referred to a frame recorded in the coronal plane (inset of Fig. 1(b) ) of the sciatic nerve as opposed to a transverse image (inset of Fig. 1(a) ) which is rendered from a z -stack of multiple images recorded in the coronal plane. When axial movement is minimized, z -stacks (60 images, 1 μ m apart) are acquired to reconstruct transverse images corresponding to the standard histology paradigm. After the imaging session, the animal is sacrificed to permit ex vivo CARS imaging. Fig. 1 CARS histomorphometry in transverse and coronal planes. Probability histogram of g-ratio measurements extracted from (a) reconstructed transverse planes and from (b) the z -stack of coronal planes. (a, inset) Typical CARS image in the transverse plane. (b, inset) Typical CARS image in the coronal plane. All scale bars are 25 μ m. 2.4.
Image processing for histology in the transverse plane
Image analysis was performed with an in-house software [ 7 ] implemented in Matlab (Mathworks, Natick, Massachusetts, USA) and with ImageJ (NIH, Bethesda, Maryland, USA). To assess the myelin health, z -stacks of images were acquired and transverse views were rendered with the freely accessible Volume Viewer plugin. Then, region of interests (ROIs) that include a myelinated axon were manually cropped from the whole dataset of transverse images. All ROIs were resampled by a factor of 4 with a bicubic algorithm. Each individual axon was thresholded with an automatic adaptive Niblack algorithm [ 17 ], to avoid any user bias. Local window size was set to 21 pixels and weight of the standard deviation contribution to 0.55 (i.e. the k-value). The threshold parameters were set empirically on a subset of images of a control animal and kept constant for all subsequent measurements. At that time, an automated function determined the inner and outer boundaries of the circular myelin sheath on the binary image, from which the diameter of the axon and that of the fiber are mathematically computed based on the area of their respective regions. Finally, the g-ratio (ratio of the axon to the fiber diameter) is calculated by dividing the two previous measurements. 2.5.
Image processing for histology in the coronal plane
Image analysis was performed with Matlab and ImageJ. Morphology based on CARS images was extracted from frames recorded from the coronal plane of the sciatic nerve. The proposed approach is an analogy of the laser beam size measurement method making use of a scanning edge [ 18 ]. First, individual myelinated axons were manually cropped from the original dataset. Great care is taken to make sure that rectangular ROIs were parallel to their respective axon. Then, all ROIs were resampled by a factor of 4 with a bicubic algorithm. At this time, all the individual line profiles coming from a particular ROI were averaged to obtain a single representative line profile of the fiber. At this point, a linear baseline subtraction was performed in order to level the representative line profile on a straight line. The leveled representative line profile was then normalized by dividing every of his points by its maximum value. A cumulative integral was numerically computed on the resulting line profile. The fiber and axon diameter are determined by the position of the edges of the fiber and axon diameters. The edges position correspond to a width of half of the contributed area of each peak of the line profile to the cumulative integral (i.e. roughly 12.5 %, 37.5 %, 62.5 % and 87.5 %). The limits were set empirically on a subset of images of a control animal and kept constant for all subsequent measurements. Figure 2(c) shows a typical leveled line profile (solid line) overlaid with its cumulative integral (dashed line). The dotted lines highlight the positions that were automatically determined by the cumulative integral to be the edges of the fiber and axon diameters. The g-ratio was calculated by dividing the axon by the fiber diameter. Myelin thickness was computed by a subtracting the axon to the fiber diameter and then dividing by the factor 2. Fig. 2 (a) Scheme of the imaging plane relative the fiber and axon location (r a : axon radius, r f : fiber radius, r’ a : biased axon radius and r’ f : biased fiber radius). (b) Measured g-ratio versus the normalized displacement from the center of the axon (solid: experimental and dashed: simulated). (c) Leveled line profile (solid) overlaid with its cumulative integral (dashed) and the edges of the fiber and axon diameter (dotted). (d) Theoretical biased probability histogram of g-ratio measurements. 2.6.
Statistical analysis
Values are expressed in terms of means ± standard error of the mean (SEM) unless otherwise stated. Statistical analysis of the data was performed using Matlab. Values of p ≤ 0.05 were considered statistically significant (*), p ≤ 0.01 were considered highly statistically significant (**) and p ≤ 0.001 were considered extremely statistically significant (***). Mann-Whitney U-test was used to evaluate the differences in medians of g-ratio distributions and myelin thickness prevalence at various position along a crushed nerve ( Fig. 4(d) ) and at different time points post-crush ( Fig. 6(b) ) respectively. Fig. 3 Large-scale and high-resolution CARS map of a crushed sciatic nerve at the millimeter scale at 1 week post-injury. Three ROIs depicting healthy, proximal and distal regions of the nerve are highlighted. Scale bar is 250 μ m. Fig. 4 Histomorphometry on ex vivo crushed sciatic nerve 1 week post-injury. (a)–(c) Snapshots of the healthy, proximal and distal region of the lesion respectively, corresponding to the 3 ROIs of Fig. 3 . (d) The g-ratio versus the position along the crushed sciatic nerve. All scale bars are 25 μ m. Fig. 5 In vivo CARS images of crushed sciatic nerves at different time points of recovery. (a–c) Myelin sheaths proximal to the crush site at 2, 3 and 4 weeks post-injury respectively. (d) Myelin sheaths of a control sciatic nerve. (e) and (f) Myelin sheaths distal to the crush site at 2 and 4 weeks post-crush respectively. All scale bars are 25 μ m. Fig. 6 Behavioural assessment and histomorphometry on in vivo CARS images of crushed sciatic nerves distal to the lesion at different time points. (a) SFI and (b) myelin thickness (circles) and the g-ratio (squares) versus time.
📊 Figures
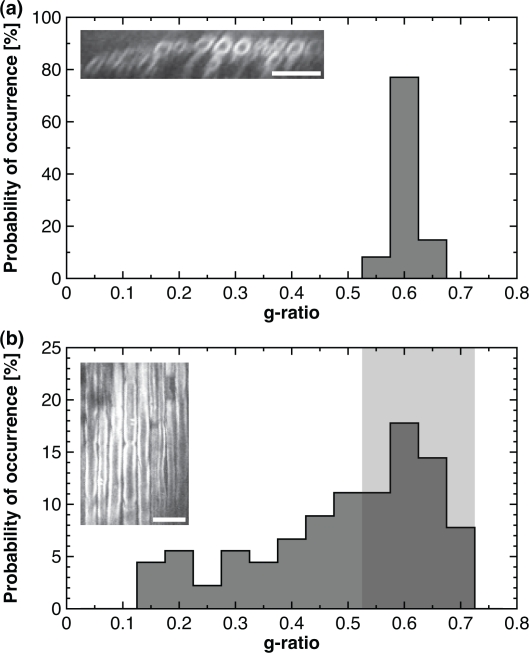
Fig. 1
CARS histomorphometry in transverse and coronal planes. Probability histogram of g-ratio measurements extracted from (a) reconstructed transverse planes and from (b) the z -stack of coronal planes. (a...
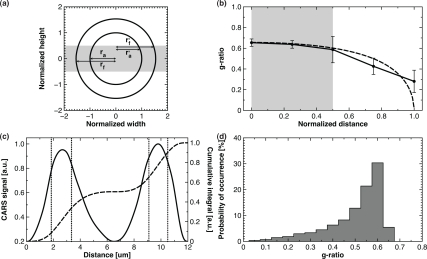
Fig. 2
(a) Scheme of the imaging plane relative the fiber and axon location (r a : axon radius, r f : fiber radius, ru2019 a : biased axon radius and ru2019 f : biased fiber radius). (b) Measured g-ratio ver...
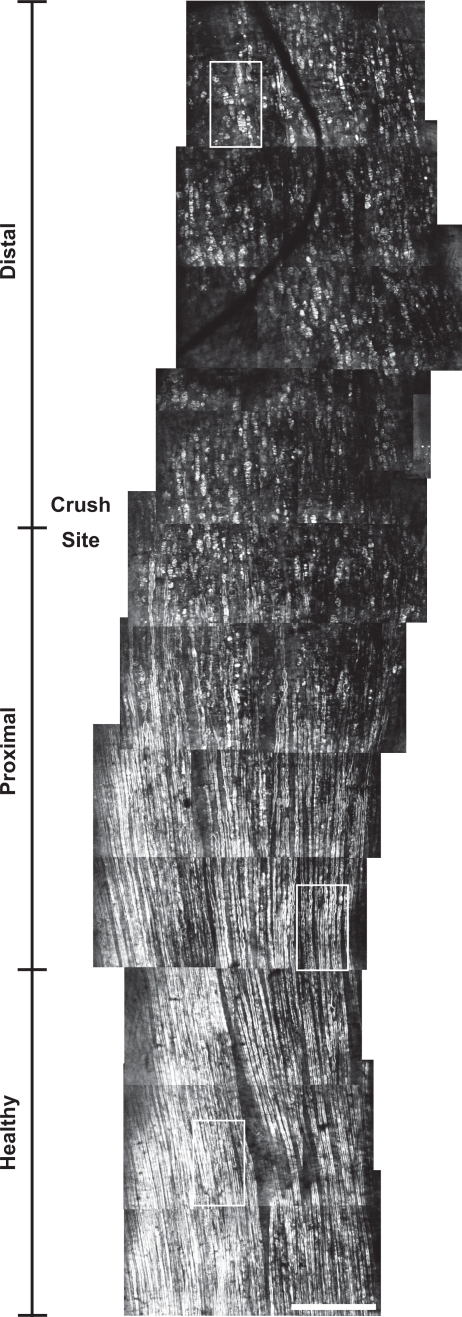
Fig. 3
Large-scale and high-resolution CARS map of a crushed sciatic nerve at the millimeter scale at 1 week post-injury. Three ROIs depicting healthy, proximal and distal regions of the nerve are highlighte...
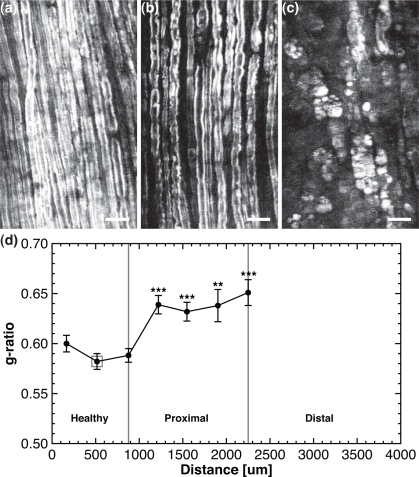
Fig. 4
Histomorphometry on ex vivo crushed sciatic nerve 1 week post-injury. (a)u2013(c) Snapshots of the healthy, proximal and distal region of the lesion respectively, corresponding to the 3 ROIs of Fig. 3...
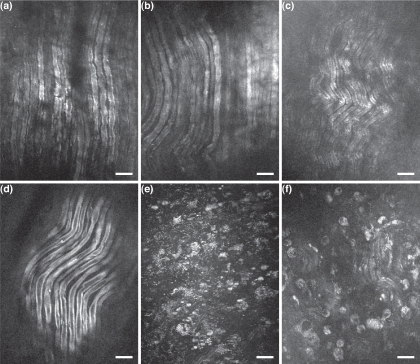
Fig. 5
In vivo CARS images of crushed sciatic nerves at different time points of recovery. (au2013c) Myelin sheaths proximal to the crush site at 2, 3 and 4 weeks post-injury respectively. (d) Myelin sheaths...
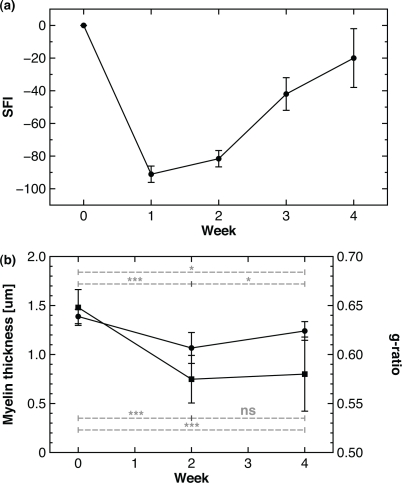
Fig. 6
Behavioural assessment and histomorphometry on in vivo CARS images of crushed sciatic nerves distal to the lesion at different time points. (a) SFI and (b) myelin thickness (circles) and the g-ratio (...
Figure images are served from the NIH/NLM PubMed Central Open Access Subset or Europe PMC; copyright remains with the publishers and authors.
💬 Discussion
0 commentsNo comments yet. Be the first to start a discussion!
Leave a Comment