Abstract
Abstract The Hedgehog (Hh) pathway controls embryonic development and postnatal tissue maintenance and regeneration. Inhibition of Hh receptor Patched (Ptch) by the Hh ligands relieves suppression of signaling cascades. Here, we report the cryo-EM structure of tetrameric Ptch1 in complex with the palmitoylated N-terminal signaling domain of human Sonic hedgehog (ShhN p ) at a 4:2 stoichiometric ratio. The structure shows that four Ptch1 protomers are organized as a loose dimer of dimers. Each dimer binds to one ShhN p through two distinct inhibitory interfaces, one mainly through the N-terminal peptide and the palmitoyl moiety of ShhN p and the other through the Ca 2+ -mediated interface on ShhN p . Map comparison reveals that the cholesteryl moiety of native ShhN occupies a recently identified extracellular steroid binding pocket in Ptch1. Our structure elucidates the tetrameric assembly of Ptch1 and suggests an asymmetric mode of action of the Hh ligands for inhibiting the potential cholesterol transport activity of Ptch1.
🔬 Techniques
🧬 Organisms
🧪 Sample Preparation
🏭 Microscope Brands
🧪 Reagent Suppliers
💻 Software Details
💾 Data Repositories
🏛️ Research Organizations (ROR)
Affiliated research institutions:
📋 Methods
Protein expression and purification
The cDNA of human Ptch1 (Uniprot: Q13635 ) (residues 1–1305) was cloned into the pCAG vector with an amino-terminal FLAG tag and a carboxy-terminal His 10 tag. The cDNA of human Shh (Uniprot: Q15465 ) N-terminal domain (ShhN, residues 1–197) was cloned into the no-tag pCAG vector. A complete list of all primers used in this study has been supplied in Supplementary Table 2 . HEK 293F suspension cells (Thermo Fisher Scientific, Cat# R79007 ) were cultured in Freestyle 293 medium (Thermo Fisher Scientific) at 37 °C supplied with 5% CO 2 and 80% humidity. When the HEK 293F cell density reached 2.0 × 10 6 cells per ml, the cells were transiently transfected with the expression plasmids and polyethylenimines (PEIs) (Polysciences). For the Ptch1 alone, approximately 1 mg Ptch1 plasmids were pre-mixed with 3 mg PEIs in 50 ml fresh medium for 15–30 min before application. For the Ptch1–ShhN complex, approximately 1 mg Ptch1 and 1 mg ShhN plasmids were pre-mixed with 6 mg PEIs in 50 ml fresh medium for 15–30 min before application. For transfection, 50 ml mixture was added to one-liter cell culture and incubated for 15–30 min. Transfected cells were cultured for 48 h before harvest. For the purification of Ptch1 alone or its complex with ShhN, the HEK 293F cells were collected and resuspended in the buffer containing 25 mM Tris pH 8.0, 150 mM NaCl, and protease inhibitor cocktails (Amresco). After sonication on ice, the membrane fraction was solubilized at 4 °C for 2 h with 1% (w/v) GDN (Anatrace). After centrifugation at 20,000× g for 1 h, the supernatant was collected and applied to anti-Flag M2 affinity resin (Sigma). The resin was rinsed with the wash buffer (W1 buffer) containing 25 mM Tris pH 8.0, 150 mM NaCl, and 0.02% GDN. The protein was eluted with the W1 buffer plus 200 μg/ml FLAG peptide. The eluent was then applied to the nickel affinity resin (Ni-NTA, Qiagen). After three times of rinsing with W1 buffer plus 20 mM imidazole, the protein was eluted from the nickel resin with W1 buffer plus 250 mM imidazole. The eluent was then concentrated and further purified by size-exclusion chromatography (SEC, Superose® 6 10/300 GL, GE Healthcare) in the buffer containing 25 mM Tris pH 8.0, 150 mM NaCl, and 0.02% GDN. The peak fractions for the oligomeric and monomeric Ptch1 or its complex with ShhN were separately collected. Blue Native PAGE (BN-PAGE) Chromatographically purified Ptch1 and Ptch1–ShhN p samples were mixed with 4 × loading buffer and Coomassie G-250 additive and then subjected to 3–12% NativePAGE TM Novex Bis-Tris gel (Invitrogen) for native electrophoresis at 4 °C. The electrophoresis was conducted at 150 V constant for 60 min, and then increase the voltage to 250 V constant for another 75 min. After electrophoresis, the gel was transferred to a container for fixation in fixing solution (40% methanol, 10% acetic acid), and then for staining (0.02% Coomassie R-250 in 30% methanol and 10% acetic acid) and destaining (8% acetic acid). All the procedures were performed according to the manufacturer’s protocol. Source data are provided as a Source Data file. Glutaraldehyde cross-linking assay About 0.15 mg/ml Ptch1 was mixed with glutaraldehyde at indicated concentrations and incubated at 4 °C for 2 h in the buffer containing 25 mM HEPES, 150 mM NaCl and 0.02% GDN. Then the reaction was quenched through the addition of Tris (pH 8.0) to a final concentration of 150 mM and cross-linking result was analysed by SDS-PAGE.
Show full methods section
Protein expression and purification
The cDNA of human Ptch1 (Uniprot: Q13635 ) (residues 1–1305) was cloned into the pCAG vector with an amino-terminal FLAG tag and a carboxy-terminal His 10 tag. The cDNA of human Shh (Uniprot: Q15465 ) N-terminal domain (ShhN, residues 1–197) was cloned into the no-tag pCAG vector. A complete list of all primers used in this study has been supplied in Supplementary Table 2 . HEK 293F suspension cells (Thermo Fisher Scientific, Cat# R79007 ) were cultured in Freestyle 293 medium (Thermo Fisher Scientific) at 37 °C supplied with 5% CO 2 and 80% humidity. When the HEK 293F cell density reached 2.0 × 10 6 cells per ml, the cells were transiently transfected with the expression plasmids and polyethylenimines (PEIs) (Polysciences). For the Ptch1 alone, approximately 1 mg Ptch1 plasmids were pre-mixed with 3 mg PEIs in 50 ml fresh medium for 15–30 min before application. For the Ptch1–ShhN complex, approximately 1 mg Ptch1 and 1 mg ShhN plasmids were pre-mixed with 6 mg PEIs in 50 ml fresh medium for 15–30 min before application. For transfection, 50 ml mixture was added to one-liter cell culture and incubated for 15–30 min. Transfected cells were cultured for 48 h before harvest. For the purification of Ptch1 alone or its complex with ShhN, the HEK 293F cells were collected and resuspended in the buffer containing 25 mM Tris pH 8.0, 150 mM NaCl, and protease inhibitor cocktails (Amresco). After sonication on ice, the membrane fraction was solubilized at 4 °C for 2 h with 1% (w/v) GDN (Anatrace). After centrifugation at 20,000× g for 1 h, the supernatant was collected and applied to anti-Flag M2 affinity resin (Sigma). The resin was rinsed with the wash buffer (W1 buffer) containing 25 mM Tris pH 8.0, 150 mM NaCl, and 0.02% GDN. The protein was eluted with the W1 buffer plus 200 μg/ml FLAG peptide. The eluent was then applied to the nickel affinity resin (Ni-NTA, Qiagen). After three times of rinsing with W1 buffer plus 20 mM imidazole, the protein was eluted from the nickel resin with W1 buffer plus 250 mM imidazole. The eluent was then concentrated and further purified by size-exclusion chromatography (SEC, Superose® 6 10/300 GL, GE Healthcare) in the buffer containing 25 mM Tris pH 8.0, 150 mM NaCl, and 0.02% GDN. The peak fractions for the oligomeric and monomeric Ptch1 or its complex with ShhN were separately collected. Blue Native PAGE (BN-PAGE) Chromatographically purified Ptch1 and Ptch1–ShhN p samples were mixed with 4 × loading buffer and Coomassie G-250 additive and then subjected to 3–12% NativePAGE TM Novex Bis-Tris gel (Invitrogen) for native electrophoresis at 4 °C. The electrophoresis was conducted at 150 V constant for 60 min, and then increase the voltage to 250 V constant for another 75 min. After electrophoresis, the gel was transferred to a container for fixation in fixing solution (40% methanol, 10% acetic acid), and then for staining (0.02% Coomassie R-250 in 30% methanol and 10% acetic acid) and destaining (8% acetic acid). All the procedures were performed according to the manufacturer’s protocol. Source data are provided as a Source Data file. Glutaraldehyde cross-linking assay About 0.15 mg/ml Ptch1 was mixed with glutaraldehyde at indicated concentrations and incubated at 4 °C for 2 h in the buffer containing 25 mM HEPES, 150 mM NaCl and 0.02% GDN. Then the reaction was quenched through the addition of Tris (pH 8.0) to a final concentration of 150 mM and cross-linking result was analysed by SDS-PAGE.
Analytical ultracentrifugation analyses
Analytical ultracentrifugation sedimentation velocity (AUC-SV) experiments were performed using a Beckman Coulter XL-I analytical ultracentrifuge equipped with a four-cell An-60 Ti analytical rotor. Four hundred μl protein sample from size-exclusion chromatography in the buffer containing 25 mM Tris pH 8.0, 150 mM NaCl, and 0.02% GDN and 400 μl buffer (25 mM Tris PH 8.0, 150 mM NaCl) were loaded into the sample sector and reference sector separately. The rotor with the cells was pre-scanned at a rotor speed of 70 × g for sample leakage. The run was started once the rotor temperature reached the set point at 20 °C. Sedimentation profiles were recorded by UV detector at 280 nm and Interference laser at 655 nm and scanned every 6 min. Data were analyzed with GUSSI. The partial specific volume and dn/dc value for the protein are 0.74 cm 3 /g and 0.1896 cm 3 /g, respectively, according to the report. The extinction coefficient for Ptch1 is 1.27 L/(g cm), which was calculated with ProtParam on the ExPasy server. For GDN, the partial specific volume was measured by Density Meter as 0.80 cm 3 /g and dn/dc value was measured by multi-angle light scattering as 0.135 cm 3 /g.
Cryo-EM sample preparation and data collection
The cryo grids were prepared using Thermo Fisher Vitrobot Mark IV. The Quantifoil R1.2/1.3 Cu grids were first glow-discharged with air for 40 s at medium level in Plasma Cleaner (HARRICK PLASMA, PDC-32G-2). Then aliquots of 3.5 µl purified Ptch1–ShhN complex (concentrated to approximately 15 mg/ml) were applied to glow-discharged grids. After being blotted with filter paper for 3.5 s, the grids were plunged into liquid ethane cooled with liquid nitrogen. A total of 4003 micrograph stacks were automatically collected with SerialEM on Titan Krios at 300 kV equipped with K2 Summit direct electron detector (Gatan), Quantum energy filter (Gatan) and Cs corrector (Thermo Fisher), at a nominal magnification of ×105,000 with defocus values from −2.0 µm to −1.2 µm. Each stack was exposed in super-resolution mode for 5.6 s with an exposing time of 0.175 s per frame, resulting in 32 frames per stack. The total dose was about 50 e − /Å 2 for each stack. The stacks were motion corrected with MotionCor2 54 and binned twofold, resulting in a pixel size of 1.114 Å/pixel, meanwhile dose weighting was performed 55 . The defocus values were estimated with Gctf 56 .
Cryo-EM data processing
A total of 1,226,114 particles were automatically picked with RELION 2.0 57 . After 2D classification, a total of 448,682 particles were selected and subject to a guided multi-reference classification procedure. The references, two good and two bad, were generated with limited particles in advance. A total of 266,572 particles selected from multi-references 3D classification were subjected to local search 3D classification with adapted mask on the flexible half (to obtain a complete map) and performed five parallel runs at the same time. Then, a total of 107,265 particles were selected from good classes and subjected to seven parallel runs of local search 3D classification without adapted mask. Two distinct classes were selected, Class I with 39,503 particles and Class II with 25,510 particles, yielding 3D reconstitutions with 6.8 Å and 6.5 Å, respectively. Lastly, ECD masks were applied to increase the local resolution to 4.6 Å and 4.3 Å for these two classes, respectively. To increase the resolution of stable half, the 266,572 particles selected from multi-references 3D classification were subjected to a global angular search 3D classification with one class and 40 iterations. The outputs of the 30th–40th iterations were subjected to local angular search 3D classification with three classes separately. A total of 171,590 particles were selected by combining the good classes of the local angular search 3D classification, yielding a 3D reconstruction with an overall resolution of 3.6 Å after 3D auto-refinement with an adapted mask on the stable half. All 2D classification, 3D classification, and 3D auto-refinement were performed with RELION 2.0. Resolutions were estimated with the gold-standard Fourier shell correlation 0.143 criterion 58 with high-resolution noise substitution.
Model building and refinement
Firstly, the map at 3.6 Å was used to build a 2:1 complex structure of Ptch1 and ShhN. Two previously reported 1:1 complex structures (PDB code 6DMY and 6D4J) served as initial models to be docked into the map with Chimera, followed by manual adjustment in Coot to generate the final structure. Then, two 2:1 structures were fitted into the maps of Class I or Class II to generate two complex structures at 4:2 stoichiometry. All structure refinements were carried out by PHENIX 59 in real space with secondary structure and geometry restraints. Overfitting of the models was monitored by refining the model against one of the two independent half maps and testing the refined model against the other map 60 . Reporting summary Further information on research design is available in the Nature Research Reporting Summary linked to this article.
Supplementary information Supplementary Information Peer Review File Reporting Summary Source Data
📊 Figures
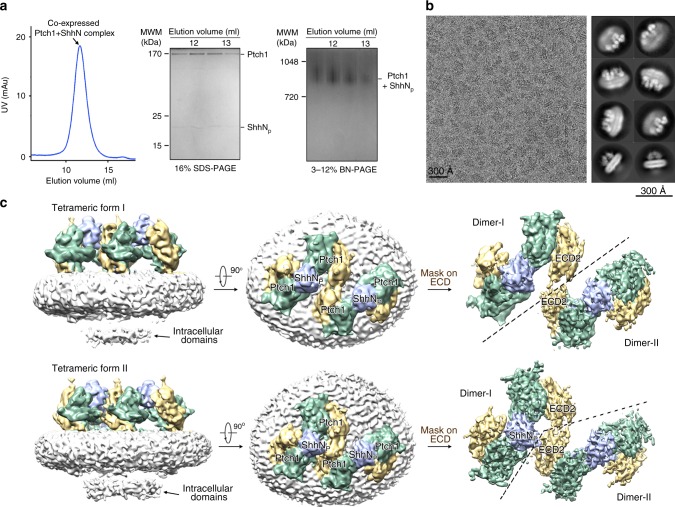
Fig. 1
Structural determination of tetrameric Ptch1 in complex with ShhN p . a Purification of co-expressed Ptch1 (residues 1u20131305) and ShhN (residues 1u2013197). Shown here is a representative size excl...
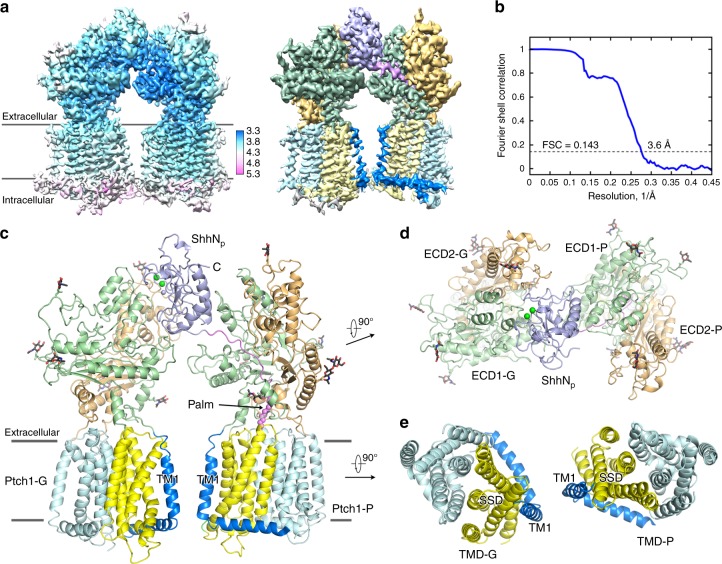
Fig. 2
Structure of the 2:1 Ptch1u2013ShhN p complex. a Cryo-EM map for the 2:1 Ptch1u2013ShhN p complex. Higher resolution was achieved after applying adapted mask to dimeric Ptch1 with one ShhN p . Left pa...
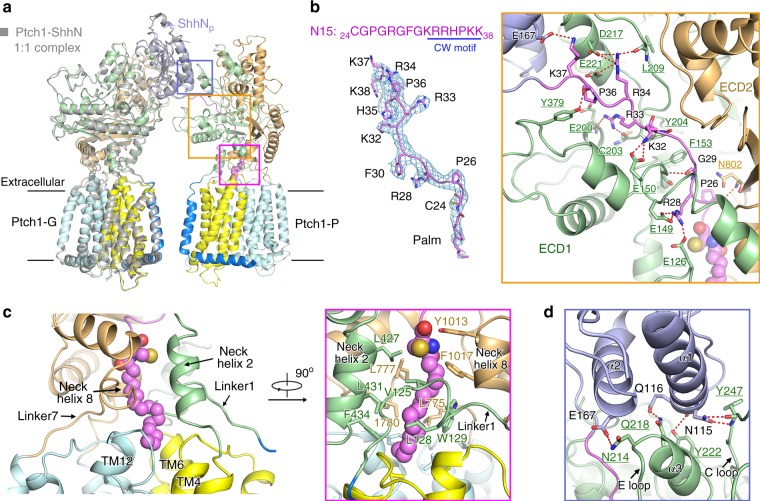
Fig. 3
Asymmetric binding of one ShhN p with two Ptch1. a Structural comparison of 2:1 Ptch1u2013ShhN p with our previously reported 1:1 Ptch1u2013ShhN complexes. The 2:1 Ptch1u2013ShhN p complex was domain ...
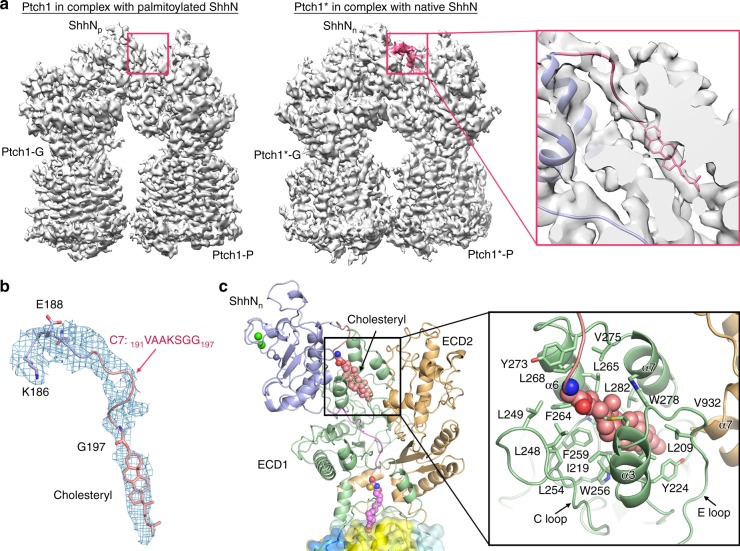
Fig. 4
The cholesteryl moiety of native ShhN (ShhN n ). a Comparison of the EM maps for our Ptch1u2013ShhN p and the recently published Ptch1*u2013ShhN n (EMDB code EMD-8955) reveals an extra density of ShhN...
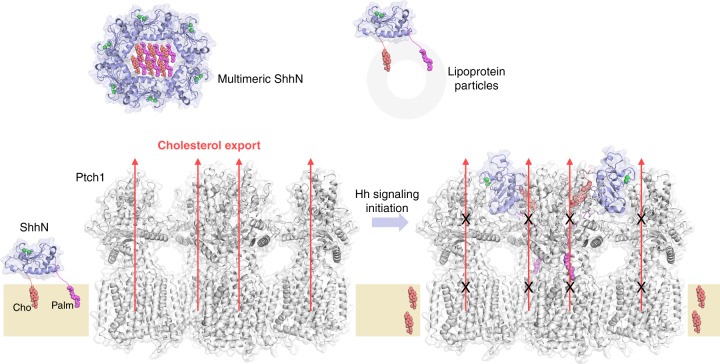
Fig. 5
Model for the inhibition of tetrameric Ptch1 by lipid-modified ShhN. The palmitoyl and cholesteryl modified ShhN signaling domain becomes hydrophobic that can be attached to the membrane. Multimerizat...
Figure images are served from the NIH/NLM PubMed Central Open Access Subset or Europe PMC; copyright remains with the publishers and authors.
💬 Discussion
0 commentsNo comments yet. Be the first to start a discussion!
Leave a Comment