Abstract
The quorum sensing (QS) system controls bacterial biofilm formation, which is highly related to the virulence and resistance of pathogens. In the present study, the effect of two traditional Chinese medicine (TCM) monomers, berberine and matrine, on biofilm formation and QS-related gene expression of antimicrobial-resistant (AMR) Escherichia coli strains was investigated by laser scanning confocal microscopy (LSCM) observation and real-time PCR. The results indicated a roughly positive relationship between biofilm formation ability and antimicrobial resistance. LSCM observation showed that berberine and matrine inhibited biofilm formation of AMR E. coli strains at 1/2 minimal inhibitory concentration (MIC) (1/2 MIC berberine at OD630: 0.1020; 1/2 MIC matrine: OD630: 0.1045); furthermore, abnormal cell morphology such as rounded and elongated cells was also observed. This finding was consistent with the downregulation of QS-related genes: luxS, pfS, sdiA, hflX, motA, and fliA. At 1/2 MIC and 1/4 MIC concentrations of berberine, a significant downregulation of luxS, pfS, hflX, ftsQ, and ftsE was observed. The results indicate that berberine and matrine can inhibit biofilm formation by inhibiting the QS system and that berberine is more effective than matrine.
🔬 Techniques
🧬 Organisms
✨ Fluorophores
🧪 Sample Preparation
🔬 Cell Lines
🏭 Microscope Brands
🧪 Reagent Suppliers
💻 Software Details
🏛️ Research Organizations (ROR)
Affiliated research institutions:
📋 Methods
E. coli Culture
An antibiotic-resistant strain of E. coli was previously isolated and tested for its antibiotic resistance spectrum by Chen et al. (2018) . The standard strain of E. coli ATCC 25922 was purchased from the National Institute of Pharmaceutical and Biological Products Control (Beijing, China). The cryopreserved E. coli standard strain ATCC 25922 and the isolated strain were regenerated by inoculation into a test tube containing 3 mL of Mueller-Hinton Broth and cultured to a logarithmic phase at 37°C in a constant temperature shaker. The concentration of the bacterial solution was adjusted to 0.5 M turbidity (a bacterial suspension with an OD 600 between 0.08 and 0.10), and the solution was used as a seed liquid. After the strain was regenerated, the colonies were picked and inoculated into 3 mL of lysogeny broth (LB) medium, and the concentration of the bacterial solution was adjusted to approximately 0.5 M turbidity after shaking at 37°C, 190 r/min for 4 h. The TCM monomers were then added to the LB at the minimum inhibitory concentration (MIC) of 1 MIC, 1/2 MIC, 1/4 MIC, and 1/8 MIC, and a blank medium without the drugs was used as a control. Aliquots of the bacterial culture were collected every 1 h for a period of 24 h to measure the OD 600 value. Antibiotic Resistance and TCM Monomer Sensitivity Stock solutions of standard drugs were prepared at a concentration of 512 μg/mL. These drugs included ampicillin (CAS: 7177-48-2), cefazolin (CAS: 25953-19-9), cefotaxime (CAS: 64485-93-4), gentamicin (CAS: 1403-66-3), ciprofloxacin (CAS: 85721-33-1), tetracycline (CAS: 60-54-8), and chloramphenicol (CAS: 56-75-7). The berberine standards (CAS: 2086-83-1) and matrine standards (CAS: 519-02-8) (purchased from the National Institute of Pharmaceutical and Biological Products Control, Beijing, China) were dissolved in autoclaved double distilled water to prepare a drug solution with a concentration of 10.24 μg/mL. The microbroth dilution method was used to determine the MIC of the two TCM monomers against E. coli. This method is recommended by the American Society for Clinical and Laboratory Standards (CLSI) for drug sensitivity tests.
Show full methods section
E. coli Culture
An antibiotic-resistant strain of E. coli was previously isolated and tested for its antibiotic resistance spectrum by Chen et al. (2018) . The standard strain of E. coli ATCC 25922 was purchased from the National Institute of Pharmaceutical and Biological Products Control (Beijing, China). The cryopreserved E. coli standard strain ATCC 25922 and the isolated strain were regenerated by inoculation into a test tube containing 3 mL of Mueller-Hinton Broth and cultured to a logarithmic phase at 37°C in a constant temperature shaker. The concentration of the bacterial solution was adjusted to 0.5 M turbidity (a bacterial suspension with an OD 600 between 0.08 and 0.10), and the solution was used as a seed liquid. After the strain was regenerated, the colonies were picked and inoculated into 3 mL of lysogeny broth (LB) medium, and the concentration of the bacterial solution was adjusted to approximately 0.5 M turbidity after shaking at 37°C, 190 r/min for 4 h. The TCM monomers were then added to the LB at the minimum inhibitory concentration (MIC) of 1 MIC, 1/2 MIC, 1/4 MIC, and 1/8 MIC, and a blank medium without the drugs was used as a control. Aliquots of the bacterial culture were collected every 1 h for a period of 24 h to measure the OD 600 value. Antibiotic Resistance and TCM Monomer Sensitivity Stock solutions of standard drugs were prepared at a concentration of 512 μg/mL. These drugs included ampicillin (CAS: 7177-48-2), cefazolin (CAS: 25953-19-9), cefotaxime (CAS: 64485-93-4), gentamicin (CAS: 1403-66-3), ciprofloxacin (CAS: 85721-33-1), tetracycline (CAS: 60-54-8), and chloramphenicol (CAS: 56-75-7). The berberine standards (CAS: 2086-83-1) and matrine standards (CAS: 519-02-8) (purchased from the National Institute of Pharmaceutical and Biological Products Control, Beijing, China) were dissolved in autoclaved double distilled water to prepare a drug solution with a concentration of 10.24 μg/mL. The microbroth dilution method was used to determine the MIC of the two TCM monomers against E. coli. This method is recommended by the American Society for Clinical and Laboratory Standards (CLSI) for drug sensitivity tests.
Effect of TCM Monomers on Growth and Biofilm Generation
Strains with higher levels of resistance were selected for the detection of biofilm formation. For this purpose, 96-well plates seeded with the monomers at 1/2 MIC, 1/4 MIC, and 1/8 MIC concentrations and a negative control containing only LB broth medium were used. After adjusting to a bacterial concentration of 0.5 McMurray, the strain was inoculated into the wells at a concentration of 1% inoculum per well. The plates were incubated for 48 h at 37°C, and the medium was replaced at 24 h. After incubation, the plates were washed with PBS and fixed with methanol for 15 min; the excess methanol was then discarded, and the plates were allowed to dry. The plates were then stained with 1% crystal violet for 5 min, washed to remove the unbound dye, and then dried; the crystal violet dye was dissolved in 33% (v/v) glacial acetic acid. The OD 630 value was determined using a microplate reader. The readings were taken in triplicate per well and then averaged.
Laser Scanning Confocal Microscopy Observation
For this experiment, the strain with the strongest biofilm formation ability was selected. On a six-well cell culture plate, a piece of cover slip treated with concentrated sulfuric acid was placed overnight, and the culture solution with different concentrations of TCM monomers was added to each well. The blank group contained only LB, and after adjusting to a bacterial concentration of 0.5 McMurray, each well was inoculated with 1% inoculum. The six-well plate was placed in a constant temperature incubator and incubated at 37°C for 24 h. After incubation, the medium was discarded. The biofilm-attached coverslips were rinsed with PBS (pH = 6.8) and fixed with 2.5% glutaraldehyde for 1.5 h; the coverslips were then rinsed with PBS to remove the fixative and stained with FITC-ConA (Sigma, United States) in the dark at 4°C for 30 min; after staining, the coverslips were washed with PBS. The coverslips were then stained with PI (Sigma, United States) in the dark at 4°C for 15 min. After staining, the coverslips were washed with PBS, sealed with an anti-fluorescence quenching agent, and placed under LSCM (Leica, Germany) for observation. Effect of TCM Monomers on the Expression of Genes Related to Biofilm Generation and the QS The TRIzol (Invitrogen) method was used to extract total RNA from the E. coli culture 48 h after incubation with the TCM monomers. In accordance with the instructions given in the reverse transcription kit, a cDNA template was synthesized, and gDNA on total RNA was eliminated before cDNA synthesis. RT-PCR was performed according to the instructions of the Universal SYBR qPCR Master Mix Kit (Novizan Biotechnology Co., Ltd., Nanjing, China). Eight primers from Tsingke Biotechnology were used ( Table 1 ), with gapA as an internal reference gene. The qRT-PCR reaction conditions were as follows: denaturation at 95°C for 2 min, 39 cycles of denaturation at 95°C for 15 s, annealing at 62°C for 15 s, and a final extension at 72°C for 20 s. After the reaction was completed, the sample was cooled to 65°C for 2 min, and the temperature was then slowly increased to 95°C at the rate of 0.2°C/s while continuously measuring the fluorescence. TABLE 1 Details of RT-PCR primer sequences. Gene Length (bp) Primers Sequence References hflX 128 hflX-F 5′-TGTAGGTGAAGGTAAAGCAG-3′ This study hflX-R 5′-CACGACACTCGCACAAACGC-3′ fliA 112 fliA-F 5′-GCTGGCTGTTATTGGTGTCG-3′ Chen et al., 2018 fliA-R 5′-CAACTGGAGCAGGAACTTGG-3′ motA 120 motA-F 5′-CTTCCTCGGTTGTCGTCTGT-3′ Chen et al., 2018 motA-R 5′-CTATCGCCGTTGAGTTTGGT-3′ ompA 152 ompA-F 5′-TCCAGAGCAGCCTGACCTTC-3′ This study ompA-R 5′-GCTGAGCCTGGGTGTTTCCT-3′ gapA 104 gapA-F 5′-GAAATGGGACGAAGTTGGTG-3′ Congrui et al., 2013 gapA-R 5′-AACCACTTTCTTCGCACCAG-3′ luxS 116 luxS-F 5′-TGCCACACTGGTAGACGTTC-3′ Chen et al., 2018 luxS-R 5′-TGATTGGTACGCCAGATGAG-3′ pfS 169 pfs-F 5′-CGGCAACAGCCAGGAACTCA-3′ This study pfs-R 5′-GCGAAAATCCGCCACAACTT-3′ sdiA 105 sdiA-F 5′-AGTCTGATGGCTCTGATGCG-3′ This study sidA-R 5′-CTTACCTTCCGCCGTCCATT-3′ ftsE 81 ftsE-F 5′-AAAGTACCCTCCTGAAGCTGATCTGTG-3′ This study ftsE-R 5′-GCGTGATGTCATGGCCGCTAAAC-3′ ftsQ 95 ftsQ-F 5′-GTTTCTTCTCGCCGCAATAAT-3′ This study ftsQ-R 5′-AACACGACCCAGCCGCTCACC-3′ The primers for the target genes were designed using the NCBI primer designing tool.
Data Analysis
The results of the drug sensitivity test were determined according to the CLSI standards ( Clinical and Laboratory Standards Institute [CLSI], 2015 ). Relative expression levels of the target genes were calculated using 2 –ΔΔCq (where ΔCq = Cq (target gene) − Cq (reference gene) , ΔΔCq = △Cq (test) −△Cq (calibrator) ) as described previously ( Livak and Schmittgen, 2001 ). Statistical analysis was performed using SPSS software (version 19.0). The symbol ∗ indicates a significant difference at p < 0.05, while ∗∗ indicates a significant difference at p < 0.01.
📊 Figures
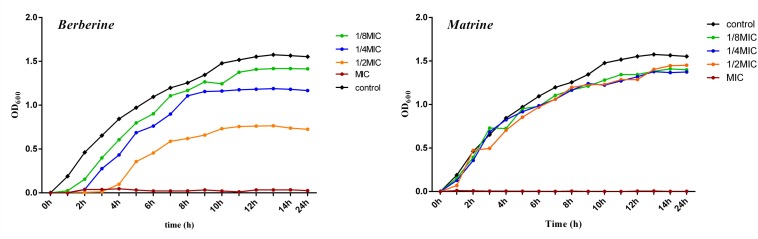
FIGURE 1
Growth curve of of E. coli treated with berberine and matrine at different concentrations.
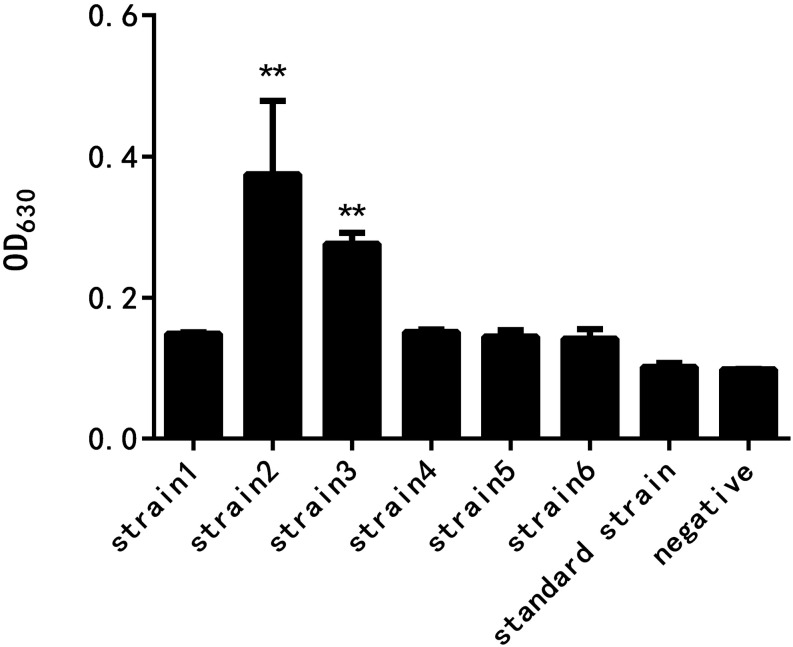
FIGURE 2
Comparison of the biofilm formation ability of E. coli at different drug resistance levels ( u2217u2217 indicates a significant difference at p < 0.01).

FIGURE 3
Effects of the two TCM monomers on biofilm formation of resistant E. coli ( u2217 indicates a significant difference at p < 0.05; u2217u2217 indicates a significant difference at p < 0.01).
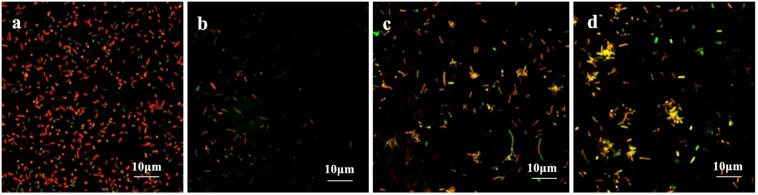
FIGURE 4
Comparison of the inhibitory effect of berberine on the biofilm formation of E. coli . (a) Untreated group, (b) 1/2 MIC concentration-treated group, (c) 1/4 MIC concentration-treated group, and (d) 1/...
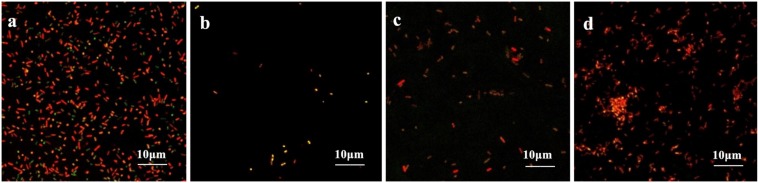
FIGURE 5
Comparison of the inhibitory effect of matrine on the biofilm formation of E. coli . (a) Untreated group, (b) 1/2 MIC concentration-treated group, (c) 1/4 MIC concentration-treated group, and (d) 1/8 ...
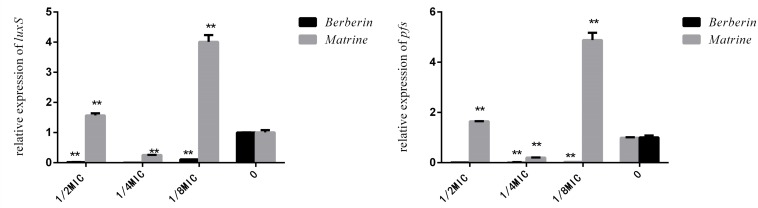
FIGURE 6
Effects of TCM monomers on the relative expression of the luxS and pfS genes in AI-2 synthesis ( u2217u2217 indicates a significant difference at p < 0.01).
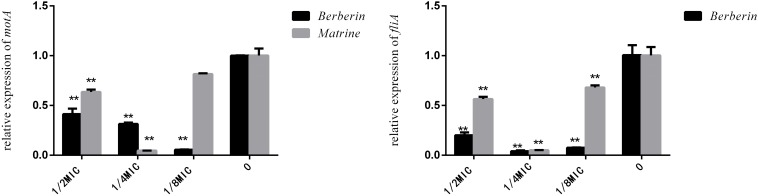
FIGURE 7
Effects of TCM monomers on the relative expression of the fliA and motA genes ( u2217u2217 indicates a significant difference at p < 0.01).
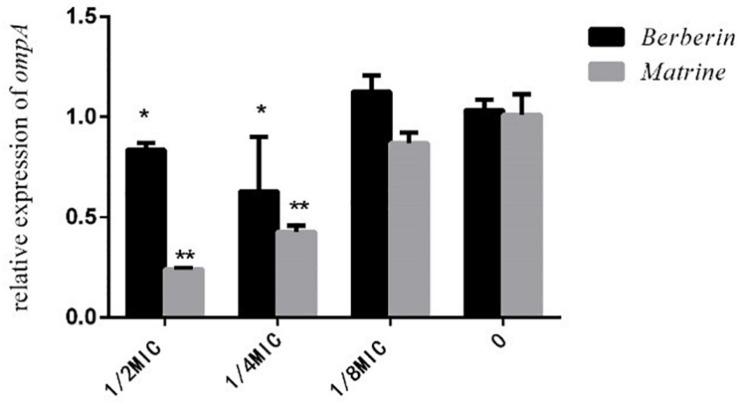
FIGURE 8
Effects of TCM monomers on the relative expression of the outer membrane protein ompA gene ( u2217 indicates a significant difference at p < 0.05; u2217u2217 indicates a significant difference at p...
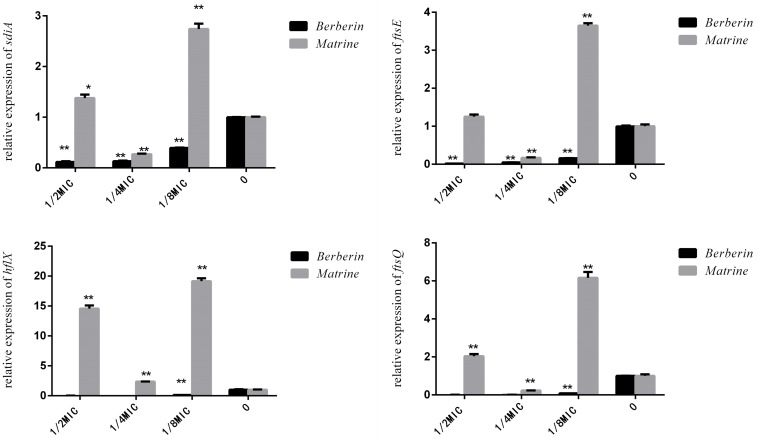
FIGURE 9
Effects of TCM monomers on the relative expression of the sdiA , ftsQ , ftsE , and hflX genes ( u2217u2217 indicates a significant difference at p < 0.01).
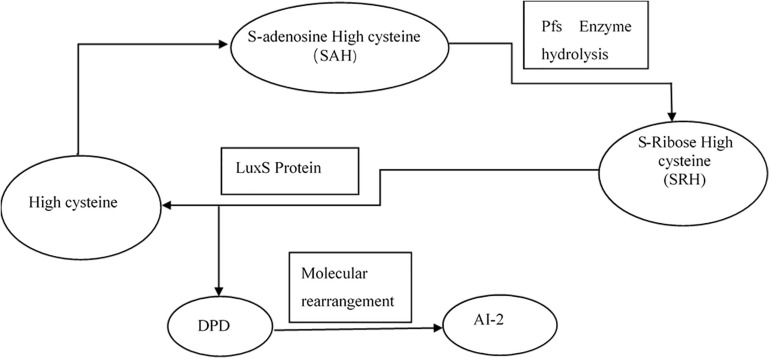
FIGURE 10
Synthesis of AI-2 ( Vendeville et al., 2005 ).
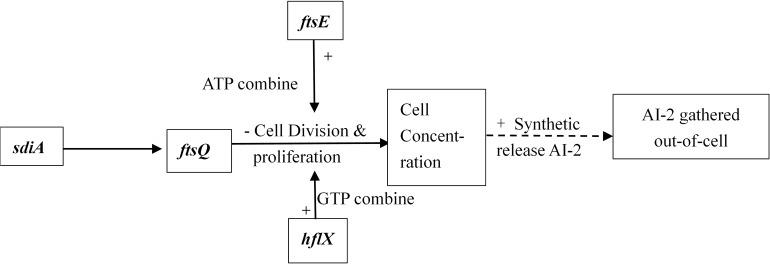
FIGURE 11
Adjustment pathway for the QS of E. coli ( Vendeville et al., 2005 ).
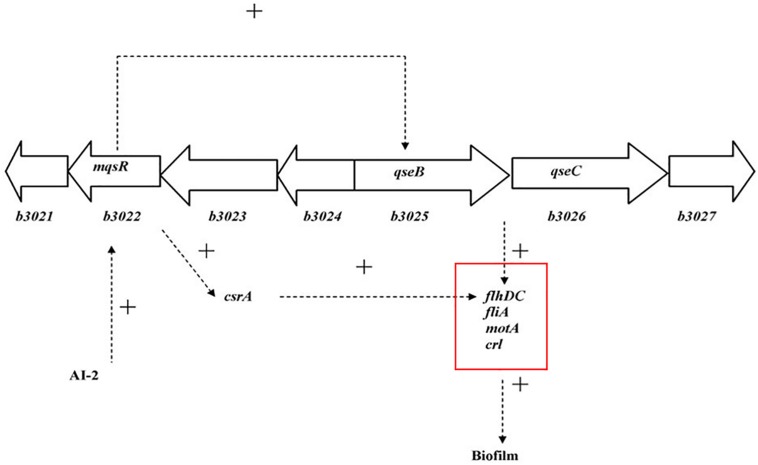
FIGURE 12
Model for the QS regulation of biofilms ( Liu and Matsumura, 1994 ).
Figure images are served from the NIH/NLM PubMed Central Open Access Subset or Europe PMC; copyright remains with the publishers and authors.
💬 Discussion
0 commentsNo comments yet. Be the first to start a discussion!
Leave a Comment