Abstract
AbstractComplex I is the first and the largest enzyme of respiratory chains in bacteria and mitochondria. The mechanism which couples spatially separated transfer of electrons to proton translocation in complex I is not known. Here we report five crystal structures of T. thermophilus enzyme in complex with NADH or quinone-like compounds. We also determined cryo-EM structures of major and minor native states of the complex, differing in the position of the peripheral arm. Crystal structures show that binding of quinone-like compounds (but not of NADH) leads to a related global conformational change, accompanied by local re-arrangements propagating from the quinone site to the nearest proton channel. Normal mode and molecular dynamics analyses indicate that these are likely to represent the first steps in the proton translocation mechanism. Our results suggest that quinone binding and chemistry play a key role in the coupling mechanism of complex I.
🔬 Techniques
🧬 Organisms
✨ Fluorophores
🏭 Microscope Brands
🧪 Reagent Suppliers
💻 Software Details
💾 Data Repositories
🏛️ Research Organizations (ROR)
Affiliated research institutions:
📋 Methods
Complex I purification
Intact complex I from T. thermophilus was purified through several steps. T. thermophilus HB8 cells were grown in a 70 L bioreactor system (Applikon Biotechnology, Delft, The Netherlands) at 70 °C, pH 7.4, for about 20 h. Membrane preparation and complex I purification was performed at room temperature from 150 g of these cells, firstly resuspended in 50 mM Bis–Tris pH 6.0, 0.002% (w/v) PMSF and EDTA-free protease inhibitor cocktail (Roche, Basel, Switzerland) and then solubilized with 2 mM CaCl 2 , 50 mM NaCl, and 1% n -tridecyl-β-maltoside (TDM, Glycon, Luckenwalde, Germany) for 1 h. After centrifugation at 150,000 × g for 1 h and filtration (0.45 μm), solubilized material was passed through a HiLoad 26/10 Q-Sepharose anion exchange column equilibrated with buffer A (20 mM Bis–Tris pH 6.0, 2 mM CaCl 2 , 0.002% (w/v) PMSF, 0.05% TDM, and 10% glycerol) and eluted with a linear gradient of 1 M NaCl in buffer B (1 M NaCl in buffer A). Eluted material was passed through a HiPrep 16/10 ANX FF anion exchange column equilibrated with buffer A. After elution with buffer B, fractions were pooled and diluted to about 5 mM NaCl in buffer A, then loaded onto a Mono-S HR 16/10 cation exchange column equilibrated with buffer A. Fractions were eluted in a linear gradient of 0.5 M NaCl in buffer A. All the fractions along the purification process were assessed by SDS–PAGE and NADH:FeCy activity. Fractions containing intact complex I were pooled and concentrated to about 1 mL (100 kDa cutoff MWCO), then loaded into a HiLoad 16/60 Superdex 200 gel-filtration column equilibrated with 100 mM NaCl in buffer A. Fractions with purity assessed by SDS–PAGE were pooled and concentrated to about 25 mg mL −1 , stored in liquid nitrogen at 25% glycerol. Activity measurements Complex I activity was measured at 50 °C with DQ as an electron acceptor. To a 2 mL quartz cuvette containing DQ assay buffer (50 mM Bis–Tris pH 6.0, 25 mM NaCl, 2 mM CaCl 2 ), 0.25 mg mL −1 asolectin (Fluka), 8 μg mL −1 complex I protein, and 100 μM DQ were added. The sample was incubated for 5 min whilst stirred at 400 rpm, to allow for the equilibration of the protein/DQ/lipid/detergent mixture. The reaction was started by adding 100 μM NADH and the change in absorbance was followed at 340 nm, over 30 s under constant stirring. Specific enzyme activity was calculated in μmol NADH oxidized mg −1 ml −1 . When required, inhibitors of complex I were added after DQ, prior to the 5-min incubation period. Lipids were prepared by mixing asolectin in a small volume of chloroform (1 mL) before evaporating the solvent under a stream of nitrogen gas, and were resuspended in 1% CHAPS to a final concentration of 5 mg mL −1 before use. Nqo16 purification Subunit Nqo16 ( ttha1528 gene) was amplified from the T. thermophilus HB8 genome by PCR, using forward (5′-AATTAGCATATGGTACGCGTGGGCATGCGCGCC) and reverse (5′- AATTAGGGATCCCTAGGCCGCCCGCTTGAGGTAG) primers synthesized by Sigma Aldrich (Gillinghman, Dorset, UK). The products from the reaction were purified using a PCR purification kit (Qiagen, Hilden, Germany) and cloned into the pet16b vector, between NdeI and BamHI restriction sites, adding a polyhistidine tag to the 5′ end of the ttha1528 gene. 1 μL of plasmid (50–100 ng μL −1 ) was added to a 100 μL aliquot of chemically competent E. coli XL1 blue cells, left on ice for 20 min then incubated at 42 °C for 45 s. 450 mL of S.O.C. medium was added to the transformed cells and incubated at 37 °C for 1 h. 50 μL of transformed cells were spread on an agar plate with ampicillin, allowing colonies to grow. The ttha1528 insert was then validated by Sanger sequencing (Source Bioscience, Cambridge, UK). The plasmid pet16b containing ttha1528 insert was extracted with a QIAprep Spin Miniprep Kit (Qiagen, Hilden, Germany) and transformed, as previously described, into E. coli BL21(DE3) cells, for further expression and purification. One litre of LB containing 100 μg mL −1 ampicillin was inoculated with stocks of E. coli BL21(DE3) cells containing pet16b- ttha1528 and grown in baffled flasks, without induction, for 18 h at 37 °C and 250 rpm. The cells were harvested by centrifugation (6800× g for 30 min, at 4 °C) and resuspended in 5 mL/g of cells of binding buffer (50 mM HEPES pH 7.4, 500 mM NaCl, 0.002% (w/v) PMSF and a PIC-E tablet), using a glass-Teflon homogenizer, at 4 °C. The cells were passed through a cell disrupter twice at 110 psi (SPCH-10, Stansted Cell Disrupter). The cell lysate was heat treated, in a water bath at 70 °C for 10 min, then clarified by ultracentrifugation (215,000× g for 1 h at 23 °C). The supernatant was retained and filtered through a 0.45 μm filter, then loaded onto a 5 mL Ni-NTA Superflow Cartridge (Qiagen, Hilden, Germany), pre-equilibrated with binding buffer. A gradient of elution buffer (binding buffer and 500 mM imidazole) was applied to elute the His-tagged Nqo16. Eluted fractions were monitored by A 280 and analysed by SDS–PAGE. The buffer was exchanged into the storage buffer (20 mM Bis–Tris pH 6.0, 2 mM CaCl 2 , 100 mM NaCl, 0.05% (v/v) TDM and 25% (v/v) glycerol). Nqo16 was concentrated to 3 mg mL −1 and stored in liquid nitrogen. Crystallization of native intact complex I Intact T. thermophilus complex I crystals were obtained using sitting drop crystallization at 23 °C. Purified complex I (diluted to 18–20 mg mL −1 in buffer A) was incubated with additional TDM, reaching a final concentration of 4% (w/v) TDM. Previously reported crystallization conditions 16 were optimized by the addition of heterologously expressed and purified subunit Nqo16 to the complex. Otherwise, only a small proportion of the purified enzyme contains Nqo16 and the rest does not crystallize. Addition of Nqo16 allowed us to utilize the entire pool of the purified enzyme for crystallization, as needed for protein-consuming multiple soaking experiments. The ratio of added Nqo16 to complex I was optimized in test crystallizations to 1:0.2 (CXI:Nqo16) and then, such complex I/Nqo16 mixture, was mixed at a ratio of 2:1 (v/v) with a mini-screen of crystallization solutions, containing 100 mM Bis–Tris pH 6.0, a gradient of 19–25% (w/v) PEG 4000, 100 mM KCl, 100 mM glutaric acid, and up to 12 different detergents, all of them promoting the crystal growth to different extents. Rod-shaped crystals (50 × 50 × 500–700 μm) were obtained after 1–3 weeks, cryoprotected in 100 mM Bis–Tris pH 6.0, 9% PEG 4000, 50 mM KCl, 50 mM glutaric acid, 25% ethylene glycol, and 0.01% TDM before storing in liquid nitrogen. Crystallization in the presence of ligands Complex I structure containing DQ was determined from an intact crystal obtained after 24 days in 100 mM Bis–Tris pH 6.0, 23% (w/v) PEG 4000, 100 mM KCl, 100 mM glutaric acid, and 50 mM 3-(1-pyridinio)-1-propanesulfonate (NDSB-201, Santa Cruz Biotechnology), soaked overnight in the cryoprotectant solution containing 500 μM DQ and 1% ethanol. In the case of piericidin A, aureothin, and pyridaben, a combination of co-crystallization and soaking was performed. Intact complex I was mixed with 50 μM piericidin A in 1% DMSO (1:1 ratio) obtaining the best co-crystals after 14 days in 100 mM Bis–Tris pH 6.0, 24% (w/v) PEG 4000, 100 mM KCl, 100 mM glutaric acid, and 0.59 mM n -undecyl-β-maltoside (UDM, Glycon). These co-crystals were further soaked in the cryoprotectant solution with 100 μM piericidin A and 1% DMSO for 4 h. Mixture of 100 μM aureothin in 1% DMSO with intact complex I (1:1 ratio) resulted in co-crystals grown for 8 days in 100 mM Bis–Tris pH 6.0, 25% (w/v) PEG 4000, 100 mM KCl, 100 mM glutaric acid, and 7.6 mM 4-cyclohexyl-1-butyl-β- d -maltoside (CYMAL-4, Anatrace), further soaked in cryoprotectant solution with 100 μM aureothin in 1% DMSO for 30 min. Intact complex I was mixed with 150 μM pyridaben in 1% DMSO (1:1 ratio), obtaining the best co-crystals after 15 days in 100 mM Bis–Tris pH 6.0, 21% (w/v) PEG 4000, 100 mM KCl, 100 mM glutaric acid, and 1.02 mM octyl-maltoside fluorinated (Anatrace), further soaked in 200 μM pyridaben and 1% DMSO for 6 min. Finally, to obtain complex I in the presence of NADH under reducing conditions, crystallization experiments were performed inside an anaerobic glove box (Belle Technology). Best intact complex I crystals, grown after 13 days in 100 mM Bis–Tris pH 6.0, 23% (w/v) PEG 4000, 100 mM KCl, 100 mM glutaric acid, and 0.01 n -tetradecyl-β- d -maltopyranoside (T315S, Anatrace), were soaked in cryoprotectant solution containing 20 mM NADH and 20 mM sodium dithionite for 4.5 min.
Show full methods section
Complex I purification
Intact complex I from T. thermophilus was purified through several steps. T. thermophilus HB8 cells were grown in a 70 L bioreactor system (Applikon Biotechnology, Delft, The Netherlands) at 70 °C, pH 7.4, for about 20 h. Membrane preparation and complex I purification was performed at room temperature from 150 g of these cells, firstly resuspended in 50 mM Bis–Tris pH 6.0, 0.002% (w/v) PMSF and EDTA-free protease inhibitor cocktail (Roche, Basel, Switzerland) and then solubilized with 2 mM CaCl 2 , 50 mM NaCl, and 1% n -tridecyl-β-maltoside (TDM, Glycon, Luckenwalde, Germany) for 1 h. After centrifugation at 150,000 × g for 1 h and filtration (0.45 μm), solubilized material was passed through a HiLoad 26/10 Q-Sepharose anion exchange column equilibrated with buffer A (20 mM Bis–Tris pH 6.0, 2 mM CaCl 2 , 0.002% (w/v) PMSF, 0.05% TDM, and 10% glycerol) and eluted with a linear gradient of 1 M NaCl in buffer B (1 M NaCl in buffer A). Eluted material was passed through a HiPrep 16/10 ANX FF anion exchange column equilibrated with buffer A. After elution with buffer B, fractions were pooled and diluted to about 5 mM NaCl in buffer A, then loaded onto a Mono-S HR 16/10 cation exchange column equilibrated with buffer A. Fractions were eluted in a linear gradient of 0.5 M NaCl in buffer A. All the fractions along the purification process were assessed by SDS–PAGE and NADH:FeCy activity. Fractions containing intact complex I were pooled and concentrated to about 1 mL (100 kDa cutoff MWCO), then loaded into a HiLoad 16/60 Superdex 200 gel-filtration column equilibrated with 100 mM NaCl in buffer A. Fractions with purity assessed by SDS–PAGE were pooled and concentrated to about 25 mg mL −1 , stored in liquid nitrogen at 25% glycerol. Activity measurements Complex I activity was measured at 50 °C with DQ as an electron acceptor. To a 2 mL quartz cuvette containing DQ assay buffer (50 mM Bis–Tris pH 6.0, 25 mM NaCl, 2 mM CaCl 2 ), 0.25 mg mL −1 asolectin (Fluka), 8 μg mL −1 complex I protein, and 100 μM DQ were added. The sample was incubated for 5 min whilst stirred at 400 rpm, to allow for the equilibration of the protein/DQ/lipid/detergent mixture. The reaction was started by adding 100 μM NADH and the change in absorbance was followed at 340 nm, over 30 s under constant stirring. Specific enzyme activity was calculated in μmol NADH oxidized mg −1 ml −1 . When required, inhibitors of complex I were added after DQ, prior to the 5-min incubation period. Lipids were prepared by mixing asolectin in a small volume of chloroform (1 mL) before evaporating the solvent under a stream of nitrogen gas, and were resuspended in 1% CHAPS to a final concentration of 5 mg mL −1 before use. Nqo16 purification Subunit Nqo16 ( ttha1528 gene) was amplified from the T. thermophilus HB8 genome by PCR, using forward (5′-AATTAGCATATGGTACGCGTGGGCATGCGCGCC) and reverse (5′- AATTAGGGATCCCTAGGCCGCCCGCTTGAGGTAG) primers synthesized by Sigma Aldrich (Gillinghman, Dorset, UK). The products from the reaction were purified using a PCR purification kit (Qiagen, Hilden, Germany) and cloned into the pet16b vector, between NdeI and BamHI restriction sites, adding a polyhistidine tag to the 5′ end of the ttha1528 gene. 1 μL of plasmid (50–100 ng μL −1 ) was added to a 100 μL aliquot of chemically competent E. coli XL1 blue cells, left on ice for 20 min then incubated at 42 °C for 45 s. 450 mL of S.O.C. medium was added to the transformed cells and incubated at 37 °C for 1 h. 50 μL of transformed cells were spread on an agar plate with ampicillin, allowing colonies to grow. The ttha1528 insert was then validated by Sanger sequencing (Source Bioscience, Cambridge, UK). The plasmid pet16b containing ttha1528 insert was extracted with a QIAprep Spin Miniprep Kit (Qiagen, Hilden, Germany) and transformed, as previously described, into E. coli BL21(DE3) cells, for further expression and purification. One litre of LB containing 100 μg mL −1 ampicillin was inoculated with stocks of E. coli BL21(DE3) cells containing pet16b- ttha1528 and grown in baffled flasks, without induction, for 18 h at 37 °C and 250 rpm. The cells were harvested by centrifugation (6800× g for 30 min, at 4 °C) and resuspended in 5 mL/g of cells of binding buffer (50 mM HEPES pH 7.4, 500 mM NaCl, 0.002% (w/v) PMSF and a PIC-E tablet), using a glass-Teflon homogenizer, at 4 °C. The cells were passed through a cell disrupter twice at 110 psi (SPCH-10, Stansted Cell Disrupter). The cell lysate was heat treated, in a water bath at 70 °C for 10 min, then clarified by ultracentrifugation (215,000× g for 1 h at 23 °C). The supernatant was retained and filtered through a 0.45 μm filter, then loaded onto a 5 mL Ni-NTA Superflow Cartridge (Qiagen, Hilden, Germany), pre-equilibrated with binding buffer. A gradient of elution buffer (binding buffer and 500 mM imidazole) was applied to elute the His-tagged Nqo16. Eluted fractions were monitored by A 280 and analysed by SDS–PAGE. The buffer was exchanged into the storage buffer (20 mM Bis–Tris pH 6.0, 2 mM CaCl 2 , 100 mM NaCl, 0.05% (v/v) TDM and 25% (v/v) glycerol). Nqo16 was concentrated to 3 mg mL −1 and stored in liquid nitrogen. Crystallization of native intact complex I Intact T. thermophilus complex I crystals were obtained using sitting drop crystallization at 23 °C. Purified complex I (diluted to 18–20 mg mL −1 in buffer A) was incubated with additional TDM, reaching a final concentration of 4% (w/v) TDM. Previously reported crystallization conditions 16 were optimized by the addition of heterologously expressed and purified subunit Nqo16 to the complex. Otherwise, only a small proportion of the purified enzyme contains Nqo16 and the rest does not crystallize. Addition of Nqo16 allowed us to utilize the entire pool of the purified enzyme for crystallization, as needed for protein-consuming multiple soaking experiments. The ratio of added Nqo16 to complex I was optimized in test crystallizations to 1:0.2 (CXI:Nqo16) and then, such complex I/Nqo16 mixture, was mixed at a ratio of 2:1 (v/v) with a mini-screen of crystallization solutions, containing 100 mM Bis–Tris pH 6.0, a gradient of 19–25% (w/v) PEG 4000, 100 mM KCl, 100 mM glutaric acid, and up to 12 different detergents, all of them promoting the crystal growth to different extents. Rod-shaped crystals (50 × 50 × 500–700 μm) were obtained after 1–3 weeks, cryoprotected in 100 mM Bis–Tris pH 6.0, 9% PEG 4000, 50 mM KCl, 50 mM glutaric acid, 25% ethylene glycol, and 0.01% TDM before storing in liquid nitrogen. Crystallization in the presence of ligands Complex I structure containing DQ was determined from an intact crystal obtained after 24 days in 100 mM Bis–Tris pH 6.0, 23% (w/v) PEG 4000, 100 mM KCl, 100 mM glutaric acid, and 50 mM 3-(1-pyridinio)-1-propanesulfonate (NDSB-201, Santa Cruz Biotechnology), soaked overnight in the cryoprotectant solution containing 500 μM DQ and 1% ethanol. In the case of piericidin A, aureothin, and pyridaben, a combination of co-crystallization and soaking was performed. Intact complex I was mixed with 50 μM piericidin A in 1% DMSO (1:1 ratio) obtaining the best co-crystals after 14 days in 100 mM Bis–Tris pH 6.0, 24% (w/v) PEG 4000, 100 mM KCl, 100 mM glutaric acid, and 0.59 mM n -undecyl-β-maltoside (UDM, Glycon). These co-crystals were further soaked in the cryoprotectant solution with 100 μM piericidin A and 1% DMSO for 4 h. Mixture of 100 μM aureothin in 1% DMSO with intact complex I (1:1 ratio) resulted in co-crystals grown for 8 days in 100 mM Bis–Tris pH 6.0, 25% (w/v) PEG 4000, 100 mM KCl, 100 mM glutaric acid, and 7.6 mM 4-cyclohexyl-1-butyl-β- d -maltoside (CYMAL-4, Anatrace), further soaked in cryoprotectant solution with 100 μM aureothin in 1% DMSO for 30 min. Intact complex I was mixed with 150 μM pyridaben in 1% DMSO (1:1 ratio), obtaining the best co-crystals after 15 days in 100 mM Bis–Tris pH 6.0, 21% (w/v) PEG 4000, 100 mM KCl, 100 mM glutaric acid, and 1.02 mM octyl-maltoside fluorinated (Anatrace), further soaked in 200 μM pyridaben and 1% DMSO for 6 min. Finally, to obtain complex I in the presence of NADH under reducing conditions, crystallization experiments were performed inside an anaerobic glove box (Belle Technology). Best intact complex I crystals, grown after 13 days in 100 mM Bis–Tris pH 6.0, 23% (w/v) PEG 4000, 100 mM KCl, 100 mM glutaric acid, and 0.01 n -tetradecyl-β- d -maltopyranoside (T315S, Anatrace), were soaked in cryoprotectant solution containing 20 mM NADH and 20 mM sodium dithionite for 4.5 min.
X-ray data collection and processing
Diffraction data from crystals containing intact complex I in the presence of ligands was collected at 100 K in beamlines ID29 and ID23-2 at the European Synchrotron Radiation Facility (ESRF, Grenoble, France) and in beamline I03 at Diamond Light Source (DLS, Oxford, UK) (Supplementary Table 1 ). Diffraction images were processed in XDS and XSCALE 52 . After soaking in different ligands, all crystals showed a similar unit cell and belonged to the P2 1 space group, containing 2 mol/ASU (about 69% of solvent content) and strongly pseudo-merohedrally twinned (twin fractions of 0.47–0.50). Resolution limits ranged from 3.1 to 3.6 Å, depending on the ligand and the dataset. However, weak diffraction along b axis was a common feature observed in all intact complex I crystals, requiring anisotropic scaling and truncation at F/σ = 2.5 along a* , b* and c* axes (Diffraction Anisotropy Server, UCLA). The starting structure constituted previously published structure of complex I 16 with Nqo6 55-70 loop re-built according to the improved density from the 11 merged isomorphous native datasets (Supplementary Table 1 ). This model was used for molecular replacement in Phaser 53 . All structures were refined in phenix.refine 54 following the same protocol, until R -factors convergence, to assess the reliability of differences observed among them. The ligands were modelled only in cases where strong Fo–Fc and 2Fo–Fc density (calculated before the placement of any ligand in the model) clearly indicated the presence of a bound ligand. Model building was performed in Coot 55 and all structures have been validated in MolProbity 56 .
Electron microscopy Intact complex
I from T. thermophilus was purified as described above. The more abundant, non-crystallisable, form of complex I was used for specimen preparation, as Nqo16 is not needed for redox or proton-pumping activity, and so we did not consider addition of Nqo16 essential for cryo-EM. After particle spread optimization, grids were prepared with complex I solubilized in a buffer composed of 20 mM Bis–Tris pH 6.0, 75 mM NaCl, 2 mM CaCl 2 , 0.01% [w/v] of DDM, 0.5% [v/v] of TDM, and 2.5–3.25% [v/v] of glycerol. With the aim of trapping complex I in its oxidized and reduced states, specimen grids were prepared with the addition of either 5 mM NAD + or 5 mM NADH just before applying sample to the grids. The sample (~2.7 μL) was added to Quantifoil R0.6/1.0 300 mesh grids in Vitrobot MKIII (RH 100%, T = 22 °C). Subsequently specimens were blotted, flash-cooled in liquid ethane and stored in LN 2 until usage.
Image collection and processing for EM
Automated data collection was performed using a 300 kV FEI Krios TEM equipped with a Falcon-II DED in the Laboratory of Molecular Biology (LMB-MRC, Cambridge, UK). 710 micrographs of complex I in presence of NAD + were acquired in one session. 2184 micrographs of complex I in presence of NADH were acquired in three different sessions. A single image per hole was acquired with magnification of ×81,395 corresponding to a 1.72 Å pixel size. Images consisted of 34 movie frames captured during an exposure period of 2 s with an electron dose-rate 17 e − Å −2 s −1 . The defocus ranged from 2.5 μm up to 4 μm. All the image-processing steps were performed using RELION2.0 57 . Unless otherwise stated, the same strategy for data processing and settings were applied to both the NADH and the NAD + datasets. The MOTIONCORR 58 was applied to both series of micrographs to account for whole-frame drift. CTF parameters were calculated using Gctf with subsequent local refinement for each particle 59 . Then, a subset of manually picked particles was used to run a preliminary 2D-classification for the selection of the reference 2D classes, which were used as templates in the automated particles picking. Particle extraction was carried out with a box size of 256 pixel. A total of 149k and 336k particles were picked from the NAD + and NADH datasets, respectively, and classified into 100 (NAD + subset) or 150 (NADH subset) 2D classes. Particles from the best 2D classes were selected and subjected to 3D classification with regularization parameter T = 8. The initial 3D reference map was prepared by low pass-filtering (30 Å) the intact complex I model from T. thermophilus (PDB 4HEA [10.2210/pdb4HEA/pdb]) 16 without Nqo16. For the NADH dataset, particles were divided initially into four 3D classes. Particles from the good class (class 4) were re-classified into three classes, and then two good classes were taken forward. The most populated class (class 2), named NADH major, contained 44,511 particles; the second most populated class (class 1), named NADH minor, contained 27,908 particles. For the NAD + dataset, the full particle ensemble was classified into four 3D classes and, in parallel, into six 3D classes. The first 3D classification resulted in two well-defined classes, class 2 (NAD + major) and class 3 (NAD + minor) of 38,659 and 20,840 particles, respectively. The second type of 3D classification resulted also in two well-defined classes (classes 1 and 2). Particles not included in the classes mentioned above were discarded. Selected particles, classes 1 and 2, were combined in one ensemble and processed for a second round of 3D classification into three classes. At this stage, the major class (class 2) comprised 40,831 particles and the minor class (class 1) was of 24,185 particles. After comparing the particle content of the major and minor classes obtained so far, it was decided to pool all the particles from classes 2 and 3 of the first run with particles from classes 1 and 2 from the second 3D classification cascade. The resulting ensemble contained 77,535 unique particles after removing duplicates, which were re-classified into two 3D classes. Class 1, named as NAD + major, contained 47,850 and class 2 (NAD + minor) contained 29,685. The processing of both NAD + and NADH datasets yielded a total of four classes: one major class and one minor class for complex I with NAD + and one major and one minor with NADH. For automated 3D refinement particles from each subset were re-extracted with a 512 pixel box and refinement was performed separately for each class, followed by particle polishing 60 . Finally, polished particles were refined and the EM density map for each class was sharpened with either automatically estimated or manually set B -factor.
Cryo-EM model building and refinement
Four electron density maps were used to build structural models of four different conformational states of complex I. Maps for minor states with bound NAD + and NADH, that is, CXI MN:NAD+ and CXI MN:NADH , respectively, are characterized by resolution of 5.5 and 6.1 Å, compared to the 4.3 and 4.25 Å resolution maps, which were obtained for major states with NAD + and NADH, respectively. The structures of minor states were built using the molecular dynamics flexible fitting (MDFF) method 61 , which is more suitable for maps of medium resolution (implemented in NAMD code 62 ). For the structures of major states, initially both the MDFF approach and the density-guided optimization protocol implemented in Rosetta code 63 were pursued. The details of the applied Rosetta protocol are described in our previous study 17 . In brief, we produced 100 models for each subunit of complex, using the elec_dens_fast function (with – denswt = 40), which was then followed by structure relaxation, using the – FastRelax flag, selection of the best fitting structure, and manual inspection of the best model in COOT. The final models for the 15 subunits of the complex I were then assembled into one model and its structure was globally optimized, using the protocol which allowed only for minor movements of side-chains (backbone restrained), resulting in the removal of inter-atomic clashes and improved fit of side-chains. The second of the applied protocols, the MDFF, incorporates an external potential (added as an additional term to the potential energy function of MD simulation), which is derived from the map and introduced into molecular dynamics simulation to steer atoms into high-density regions. The MDFF was performed with the CHARMM 22 64 , 65 force field at 300 K, with time step of 2 fs, with the scaling factor for the applied external potential of 0.3 kcal/mol for molecular dynamics part (chosen from several trials), and with the scaling factor of 5 kcal/mol (chosen from several trials) for energy minimization. The stereochemical quality of the fitted structures was preserved by restraining their heavy atoms with a small force constant of 1 kcal/mol and by restraining ϕ and ψ dihedral angles of amino-acid residues in helices and β strands, which effectively preserved the secondary structure of complex, at the same time leaving model fully flexible. The quality of fit for Rosetta-derived and MDFF-derived models was assessed, using the Time-line analysis plugin (implemented in VMD 66 ), by calculating the cross-correlation coefficient (cc) between simulated map and the experimental map. Models of major states which were produced by MDFF were characterized by better density fit and by lower clash score (MolProbity) than the ones obtained in Rosetta. The obtained density fit scores show that the regions of a worse fit correspond mainly to flexible peripheral parts of Nqo12 subunit and peripheral regions of PA. Therefore, the MDFF models were chosen as final models of major states used for analysis.
Structural and bioinformatic analyses
All the structural analyses in this work were performed with the usage of PyMOL, VMD, and PROSMART codes 67 . The interior of the studied structures was solvated with the usage of Dowser code 49 with default parameters and protonation states of amino acid residues were assigned in PROPKA code 48 . NMA was performed using Bio3D v2.3 package 68 , using two elastic network models (ENM), the ANM (cut-off 15 Å) 69 and HCA 70 . Network analysis of allosteric couplings between respective regions of complex I was performed based on generated NMA trajectories. We constructed several networks based on the trajectories obtained from NMA, using the edge betweenness algorithm, with a correlation cut-off of 0.40–0.70 (with increment of 0.05) for HCA force field, and with correlation cut-off 0.10–0.70 (with increment of 0.10) for ANM force field. The HCA-based networks constructed with cut-off 0.40–0.50 had similar structures to the ones obtained with ANM force field and cut-off of 0.20. For clarity, in this work we refer to HCA-based networks, which were obtained with cut-off 0.45. The coarse-grained (CG) molecular dynamics simulations were performed with Martini v.2.2 model 45 . The structure of the protein was additionally restrained with the Elastic Network model (ElNeDyn) version 22 71 , which was shown to effectively maintain the conformation of a protein while keeping its internal dynamics. The quinone parameterization is according to the earlier studies 72 and represents a standard combination of P1 and Na beads in all configurations with the exception of the UQ2 − configuration, where P1 beads were replaced by Qda beads to simulate the ubiquinol dianion form. In the UQ, UQ2 − , or UQH2 configurations SC3 beads of His38 and Tyr87 were given SQd types without negative charges. For direct comparisons, in the UQH2_His38 − _Tyr87 − configuration the SC3 beads of His38 and Tyr87 were both SQd bead type and given −1.0 charge. The Asp139 was assigned in all configurations to be composed of Na/Qa beads (charge −1.0), i.e. default parameters. The structure of protein was inserted into a DOPC bilayer patch of a size of 340 ( x ) and 150 ( y ) angstroms and then shortly equilibrated for 10 ps. The equilibration phase was followed by the production simulations, which all lasted 2 µs and were performed with 20 fs time step. We performed two independent simulations for each simulated system, starting with a different random seed and from different initial temperature. For the network analysis in Fig. 8 and Supplementary Fig. 9 , 2000 snapshots collected every 1 ns were used to make network models. Reporting summary Further information on experimental design is available in the Nature Research Reporting Summary linked to this paper.
Supplementary information Supplementary Information Description of Additional Supplementary Files Supplementary Data 1 Reporting Summary
📊 Figures
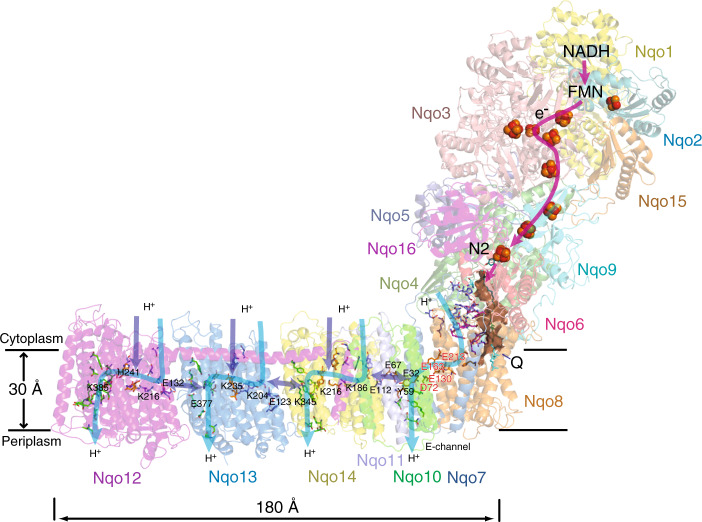
Fig. 1
Overall structure and organization of Thermus thermophilus complex I.
The electron transfer pathway in the peripheral arm (PA) and putative proton translocation pathways in the membrane domain (MD) are indicated by arrows. Complex I subunits are coloured individually an...
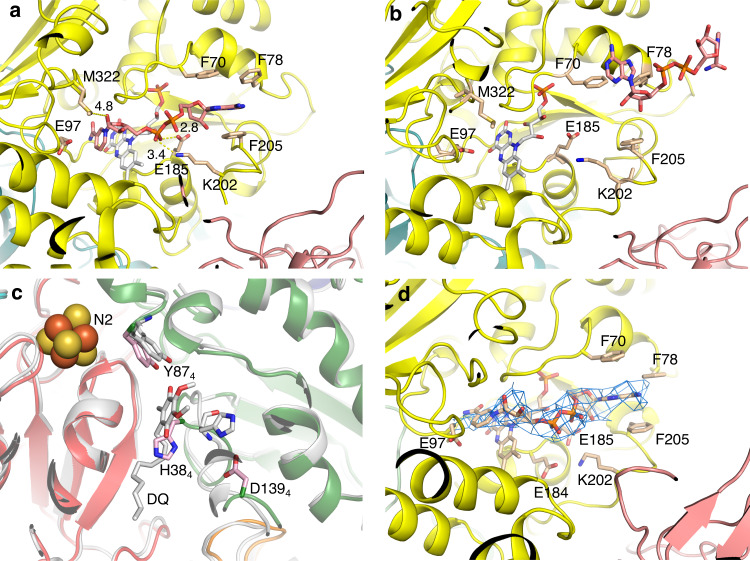
Fig. 2
NADH-binding site in complex I.
a The main interactions of NADH with subunit Nqo1 (CXI NADH structure, after short soaking). FMN is coloured in white, NADH is in salmon. Key Nqo1 residues are labelled and the main NADHu2013protein i...
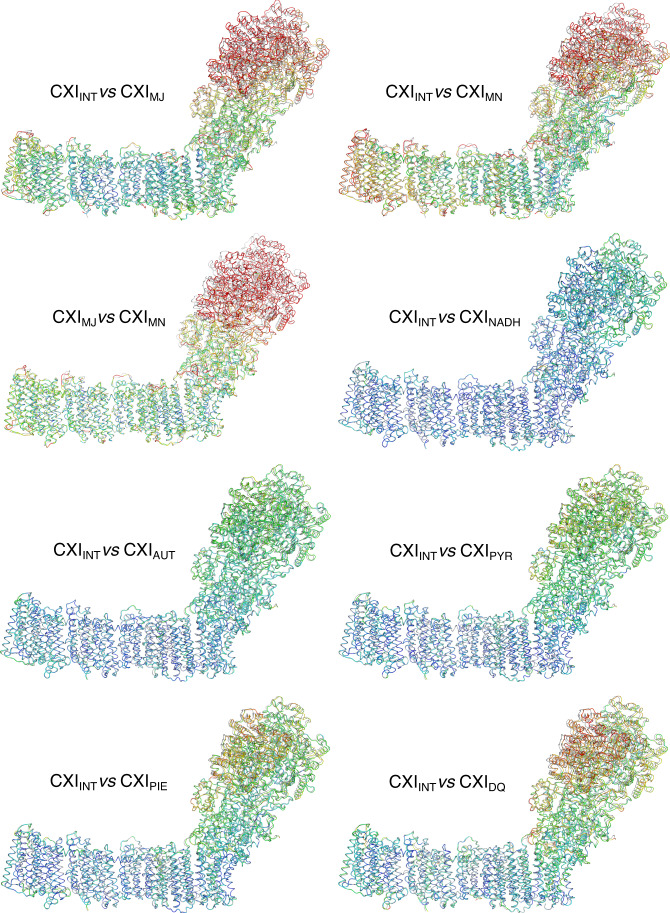
Fig. 3
Different conformations of complex I.
Models were aligned by Cu03b1 atoms of the membrane domain and coloured by Cu03b1 RMSD. Structure of native CXI INT state is in grey. RMSD values range from 0u2009u00c5 (blue) to 3u2009u00c5 (red) or ...
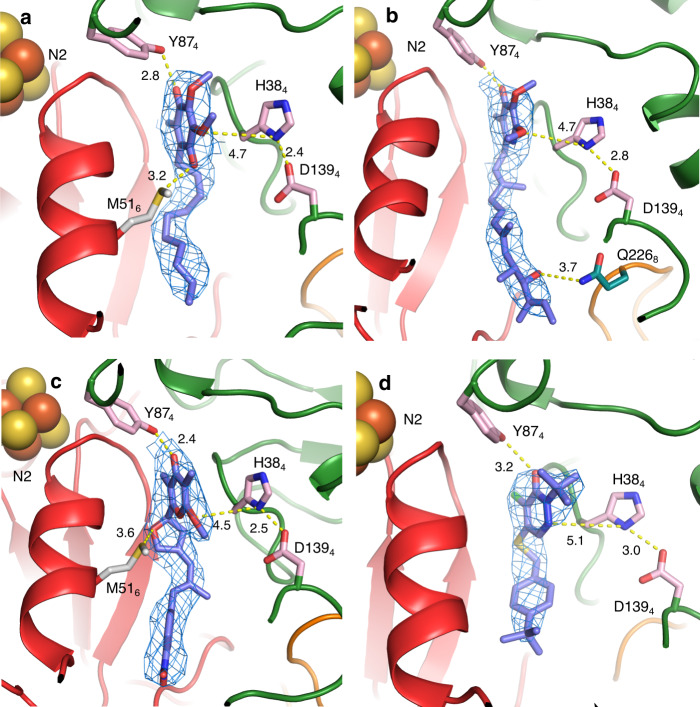
Fig. 4
Structures of ligands bound in the Q-site.
2Fou2212Fc maps (at 1 u03c3 ) and main interactions are shown, with distances in u00c5. Nqo4 is coloured in green, Nqo6 is in red, and Nqo8 loop is in orange. a Decylubiquinone, b piericidin A, c aure...
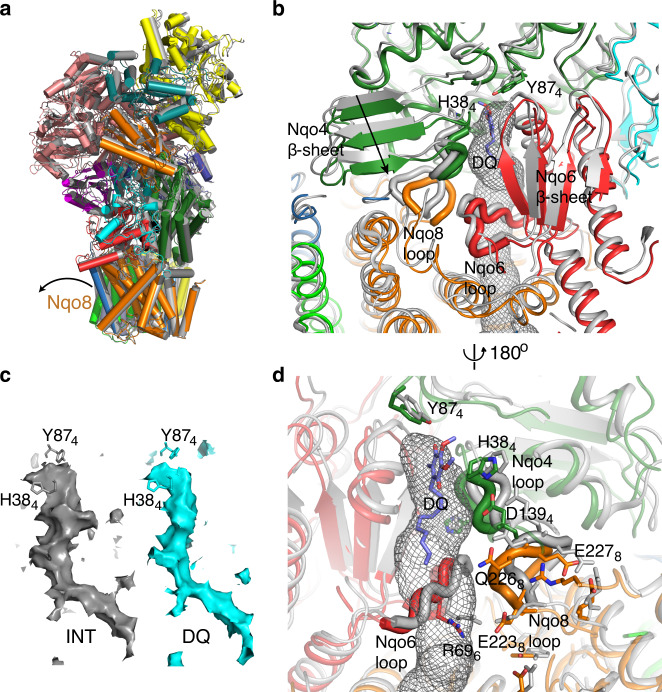
Fig. 5
Conformational changes observed after binding of DQ.
a Overlay of CXI INT (grey) with CXI DQ structure (coloured subunits, Nqo4 in dark green, Nqo6 in red and Nqo8 in orange). The structures were aligned by the MDs. Note that upon DQ binding Nqo8 tilts ...
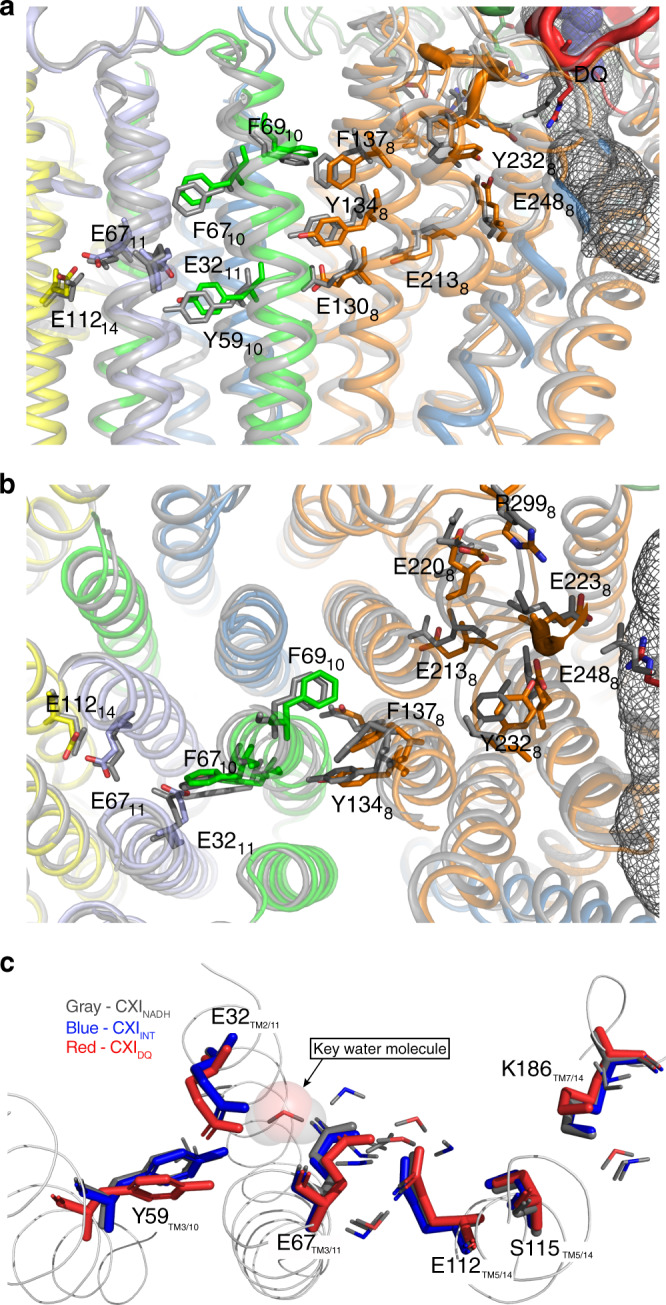
Fig. 6
Propagation of conformational changes from the Q-site towards E-channel.
a , b Overlay of CXI INT (grey) with CXI DQ structure (coloured subunits, Nqo8 in orange, Nqo10 in light green, Nqo11 in light blue and Nqo14 in yellow). The structures were aligned by the MDs. The di...
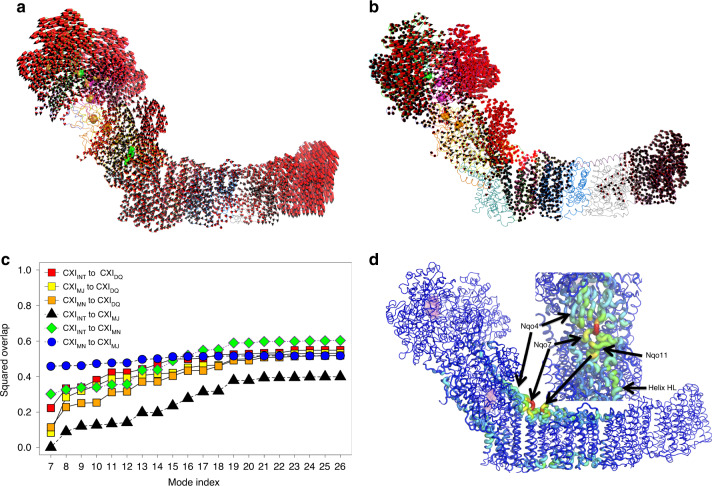
Fig. 7
The results of normal mode analysis (NMA).
Both lowest-frequency modes, mode 7 a and mode 8 b , bending and rotation respectively, are observed experimentally. The overlap analysis c shows that transitions to CXI DQ conformation involve a larg...
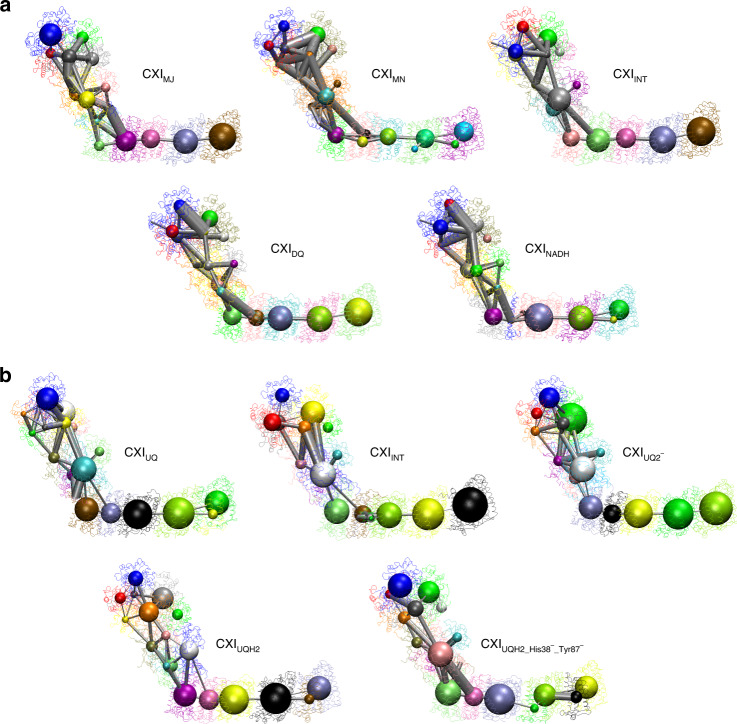
Fig. 8
Network analysis of potential allosteric couplings between respective regions of complex I.
a Analysis of experimentally determined structures, as indicated. b Analysis of the results of CG-MD simulations. Detected substructures or communities (nodes) of highly intra-connected (coupled) resi...
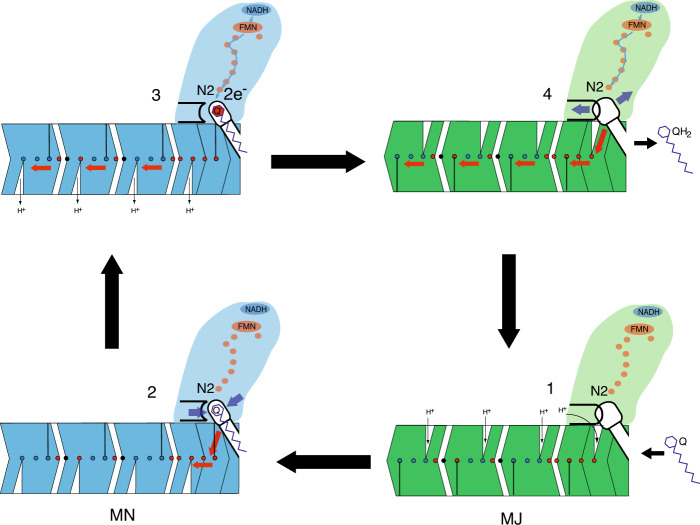
Fig. 9
The coupling mechanism of complex I.
The two main states of the complex are shown in green (major-like MJ states, represented by CXI INT , CXI NADH , and CXI MJ structures) and blue (minor-like MN states, represented by CXI DQ and CXI MN...
Figure images are served from the NIH/NLM PubMed Central Open Access Subset or Europe PMC; copyright remains with the publishers and authors.
💬 Discussion
0 commentsNo comments yet. Be the first to start a discussion!
Leave a Comment