Abstract
Kinesin-5 is a homotetrameric motor protein that interacts with adjacent microtubules in the mitotic spindle. Kinesin-5 is also highly expressed in developing postmitotic neurons. Axons of cultured neurons experimentally depleted of kinesin-5 grow up to five times longer than controls and display more branches. The faster growth rates are accompanied by a doubling of the frequency of transport of short microtubules, suggesting a major role for kinesin-5 in the balance of motor-driven forces on the axonal microtubule array. Live-cell imaging reveals that the effects on axonal length of kinesin-5 depletion are caused partly by a lower propensity of the axon and newly forming branches to undergo bouts of retraction. Overexpression of wild-type kinesin-5, but not a rigor mutant of kinesin-5, has the inverse effect on axonal length. These results indicate that kinesin-5 imposes restrictions on the growth of the axon and does so at least in part by generating forces on the axonal microtubule array.
🔬 Techniques
💻 Software
✨ Fluorophores
🧪 Sample Preparation
🔬 Cell Lines
🏭 Microscope Brands
🧪 Reagent Suppliers
📷 Detectors
💻 Software Details
💾 Data Repositories
🏛️ Research Organizations (ROR)
Affiliated research institutions:
📋 Methods
Cell culture and transfection
Cultures of dissociated neurons from rat superior cervical ganglia were prepared as previously described ( He et al., 2005 ). For experiments using siRNA, dissociated neurons were transfected with 10 μM (final concentration) of either control siRNA or kinesin-5 siRNA ( Silencer KIF11 [Eg5] siRNA; Ambion). Once transfected, the neurons were cultured in L-15 medium on 35-mm plastic dishes that had been coated with 0.1 mg/ml poly- d -lysine (PDL) for 3 h and repeatedly rinsed in double-distilled H 2 O. The following morning 5 μg/ml laminin and 5 μM arabinose C were added to the culture medium. For transport studies, the neurons were replated ( He et al., 2005 ) at a density of ∼7,500 cells/dish at 60 h after transfection onto grided glass coverslips that had been coated with 0.1 mg/ml PDL and 25 μg/ml laminin. Replating was performed 72 h after transfection. The EGFP-tubulin construct (CLONTECH Laboratories, Inc.) and the mCherry-tubulin construct (provided by R. Tsien, University of California, San Diego, La Jolla, CA) were transfected at 15 μg. Wild-type and mutant kinesin-5 constructs were provided by M. Kress (Institut André Lwoff, Centre National de la Recherche Scientifique, Villejuif, France) and A. Blangy (Centre de Recherches en Biochimie Macromoléculaire, Centre National de la Recherche Scientifique Unité Propre de Recherche, Montpellier, France), and then engineered in our laboratory as fusions with EGFP. The mutant construct, termed T112N, is described in detail by Blangy et al. (1998) . For kinesin-5 overexpression studies, 12 μg of either GFP (control) or EGFP–kinesin-5 was cotransfected with mCherry-tubulin. In one study, we wished to determine if expression of wild-type and/or the mutant kinesin-5 could “rescue” the phenotype obtained with siRNA-based depletion of kinesin-5. For these experiments, neurons were first transfected with siRNA. 48 h after transfection with siRNA, either the wild-type EGFP–kinesin-5 or the rigor mutant EGFP–kinesin-5 (T112N) was introduced using Lipofectamine 2000 (Invitrogen) as previously described ( Yu et al., 2005 ), except that Lipofectamine treatments were performed for 4.5 h duration and were followed by rinsing and medium replacement with L-15 plating medium. Neurons were then replated 24–30 h after Lipofectamine treatment and morphological analysis was performed as described below for siRNA experiments. Expression was observed in ∼15–20% of neurons, and data analysis used neurons with expression levels greater than the mean expression value (determined by arbitrary fluorescence units) for that experimental group.
Show full methods section
Cell culture and transfection
Cultures of dissociated neurons from rat superior cervical ganglia were prepared as previously described ( He et al., 2005 ). For experiments using siRNA, dissociated neurons were transfected with 10 μM (final concentration) of either control siRNA or kinesin-5 siRNA ( Silencer KIF11 [Eg5] siRNA; Ambion). Once transfected, the neurons were cultured in L-15 medium on 35-mm plastic dishes that had been coated with 0.1 mg/ml poly- d -lysine (PDL) for 3 h and repeatedly rinsed in double-distilled H 2 O. The following morning 5 μg/ml laminin and 5 μM arabinose C were added to the culture medium. For transport studies, the neurons were replated ( He et al., 2005 ) at a density of ∼7,500 cells/dish at 60 h after transfection onto grided glass coverslips that had been coated with 0.1 mg/ml PDL and 25 μg/ml laminin. Replating was performed 72 h after transfection. The EGFP-tubulin construct (CLONTECH Laboratories, Inc.) and the mCherry-tubulin construct (provided by R. Tsien, University of California, San Diego, La Jolla, CA) were transfected at 15 μg. Wild-type and mutant kinesin-5 constructs were provided by M. Kress (Institut André Lwoff, Centre National de la Recherche Scientifique, Villejuif, France) and A. Blangy (Centre de Recherches en Biochimie Macromoléculaire, Centre National de la Recherche Scientifique Unité Propre de Recherche, Montpellier, France), and then engineered in our laboratory as fusions with EGFP. The mutant construct, termed T112N, is described in detail by Blangy et al. (1998) . For kinesin-5 overexpression studies, 12 μg of either GFP (control) or EGFP–kinesin-5 was cotransfected with mCherry-tubulin. In one study, we wished to determine if expression of wild-type and/or the mutant kinesin-5 could “rescue” the phenotype obtained with siRNA-based depletion of kinesin-5. For these experiments, neurons were first transfected with siRNA. 48 h after transfection with siRNA, either the wild-type EGFP–kinesin-5 or the rigor mutant EGFP–kinesin-5 (T112N) was introduced using Lipofectamine 2000 (Invitrogen) as previously described ( Yu et al., 2005 ), except that Lipofectamine treatments were performed for 4.5 h duration and were followed by rinsing and medium replacement with L-15 plating medium. Neurons were then replated 24–30 h after Lipofectamine treatment and morphological analysis was performed as described below for siRNA experiments. Expression was observed in ∼15–20% of neurons, and data analysis used neurons with expression levels greater than the mean expression value (determined by arbitrary fluorescence units) for that experimental group.
Immunological techniques and Western blotting See the online supplemental
Materials and methods. Morphological studies For all morphological investigations, neurons were cultured and replated after the 72-h replating regimen. For axonal length and branching experiments, neurons were identified at 1 h after replating (before they had established axons). The neurons were then imaged sequentially at 3, 5, and 7 h after replating. Axonal lengths were measured using the “measure/curve” application of Axiovision LE 4.5 (Carl Zeiss MicroImaging, Inc.), and mean values were quantified. Analysis of branching frequency was performed by counting the total number of branches per neuron and dividing these values by total axonal length for individual neurons. For both total branching and categorical branching analysis, we used normalization of branch number to total axonal length to ensure accurate evaluation of branching frequency. Nitric oxide–induced axonal retraction 60 h after transfection with control or kinesin-5 siRNA, neurons were replated onto gridded PDL (0.1 mg/ml) and laminin-treated (25 μg/ml) glass-bottom culture dishes. By 72 h the neurons had generated extensive axons. The nitric oxide donor, noc-7 (Calbiochem), was prepared and applied as previously described ( He et al., 2002 ), except that it was used at a working concentration of 0.3 mM. DIC images of axons were recorded before and 30 min after addition of noc-7. Axonal lengths (from growth cone to cell body or to the first bifurcation point) were measured using the “measure/curve” application in Axiovision LE 4.5. Raw data were processed and graphs were produced using Excel (Microsoft Corp.).
Transport assays
The microtubule transport assay was performed essentially as described previously ( Hasaka et al., 2004 ), except that for experiments using pharmacological inhibition of kinesin-5 with monastrol, the neurons were plated directly onto glass coverslips in drug-containing medium and were imaged 24–36 h later. For siRNA-based studies, neurons transfected with either control siRNA or kinesin-5 siRNA were replated at 60 h as described in the previous paragraph. A total of 211 time-lapse images were taken at 700–900-ms exposure using 3-s intervals for each axon. Transport analysis included all microtubules observed to move continuously through the photobleached region during the imaging period. Transport frequencies were calculated by dividing the total number of movements by the total imaging time for individual movies.
Vesicle and mitochondrion transport assays
See the online supplemental Materials and methods. Live-cell imaging and analysis of stepwise axonal growth/retraction Neurons transfection with control or kinesin-5 siRNA (see Cell culture and transfection) were replated in L-15 medium (supplemented with FBS) onto PDL- and laminin (25 μg/ml)-coated glass coverslips. The L-15 medium was coated with 2 ml of mineral oil (Sigma-Aldrich) as a means to prevent medium evaporation and to maintain nutrient concentrations over time. Phase-contrast time-lapse images were acquired using either a 40 or 20× objective lens with 700-ms exposure time and 1 × 1 binning. Image acquisition was performed at 3-min intervals for 5 h using a heated stage apparatus to maintain the temperature at 37°C. Stepwise axon and branch growth were analyzed using the “Apps/Track Points” application of Metamorph software (Molecular Devices) by establishing a point of origin and then using automated tracking of axonal outgrowth. Data were exported from Metamorph to Excel and were analyzed for the relative change in distance to origin. A camera (Orca ER; Hamamatsu) was used. For additional details on statistical analysis and image processing, see online supplemental materials. Online supplemental material Video 1 shows that kinesin-5 depletion results in fewer bouts of retraction of axons and axonal branches. Online supplemental material is available at http://www.jcb.org/cgi/content/full/jcb.200702074/DC1 .
Online supplemental material Video 1 shows that kinesin-5 depletion results in fewer bouts of retraction of axons and axonal branches. Online supplemental material is available at http://www.jcb.org/cgi/content/full/jcb.200702074/DC1 .
Supplementary Material [Supplemental Material Index]
📊 Figures
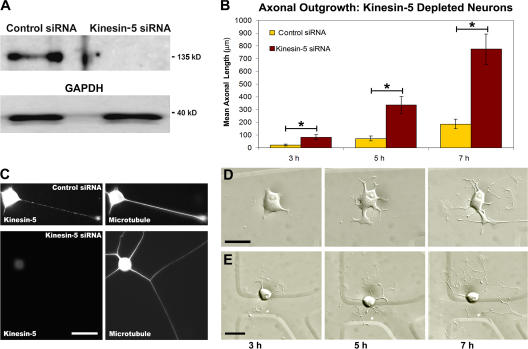
Figure 1.
Kinesin-5 depletion results in increased axonal length. (A) Western blot showing kinesin-5 protein levels in cultured sympathetic neurons treated with control siRNA and kinesin-5 siRNA. The bottom pan...
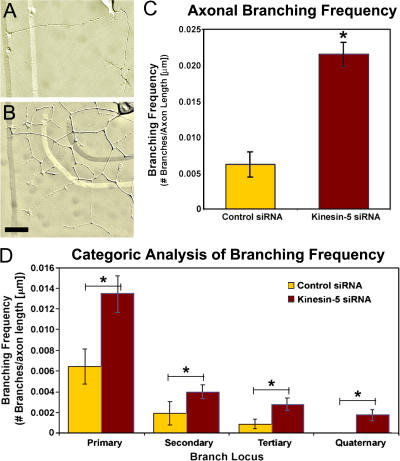
Figure 2.
Axonal branching is enhanced when kinesin-5 is depleted. (A and B) DIC images of typical control (A) and kinesin-5u2013depleted (B) neurons. Note the increase in branch number in axons depleted of kin...
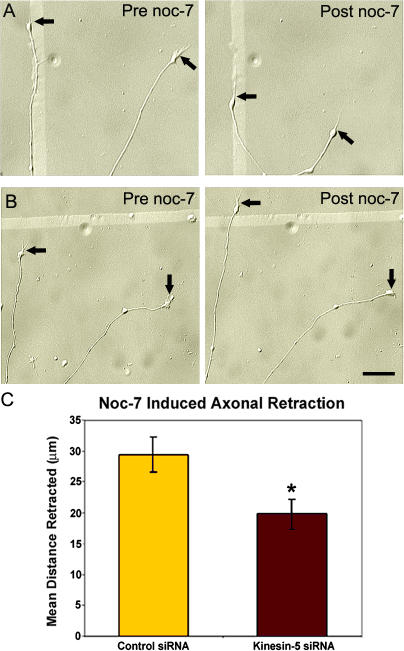
Figure 3.
Depletion of kinesin-5 reduces the distance of axonal retraction. (A and B) DIC images of control axons (A) and kinesin-5u2013depleted axons (B) before and 30 min after treatment with 0.3 mM noc-7. (B...
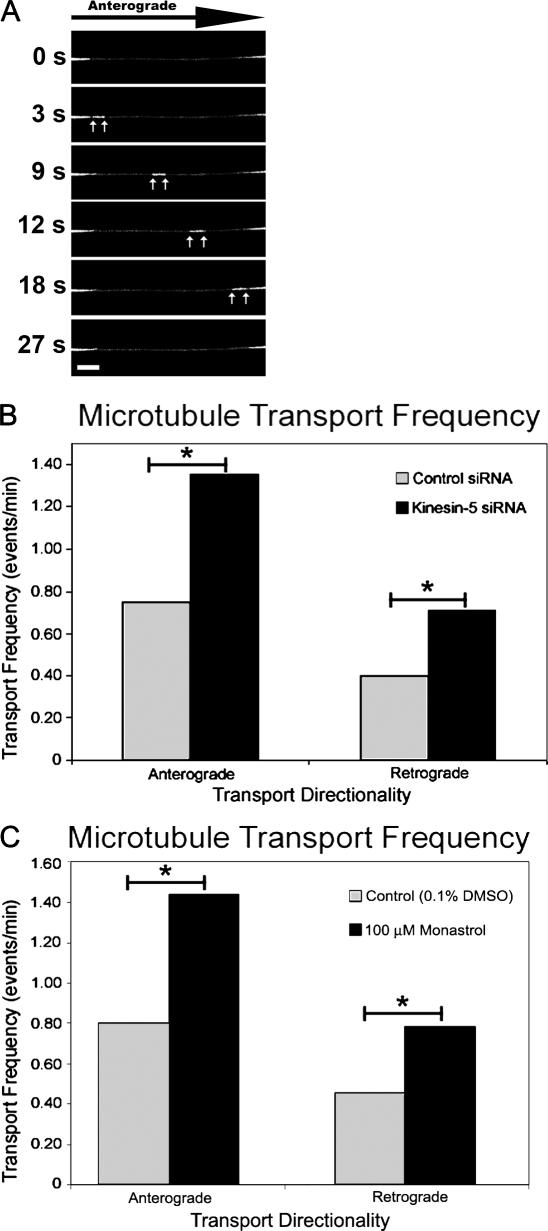
Figure 4.
Depletion of kinesin-5 enhances the transport frequency of short microtubules. (A) Time-lapse images of a neuron expressing GFP-tubulin reveal a short microtubule moving in the anterograde direction t...
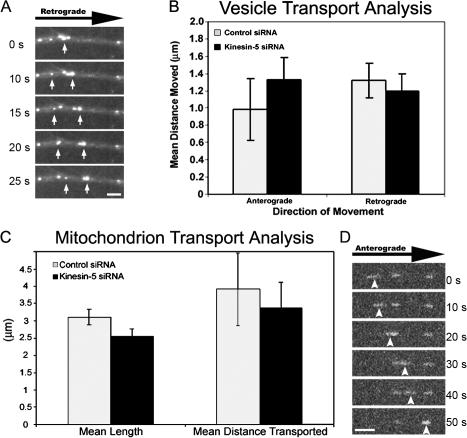
Figure 5.
Depletion of kinesin-5 motor does not affect axonal transport of membranous elements. (A) Time-lapse images of rhodamine-dextranu2013 labeled vesicles being transported retrogradely within the axon. W...
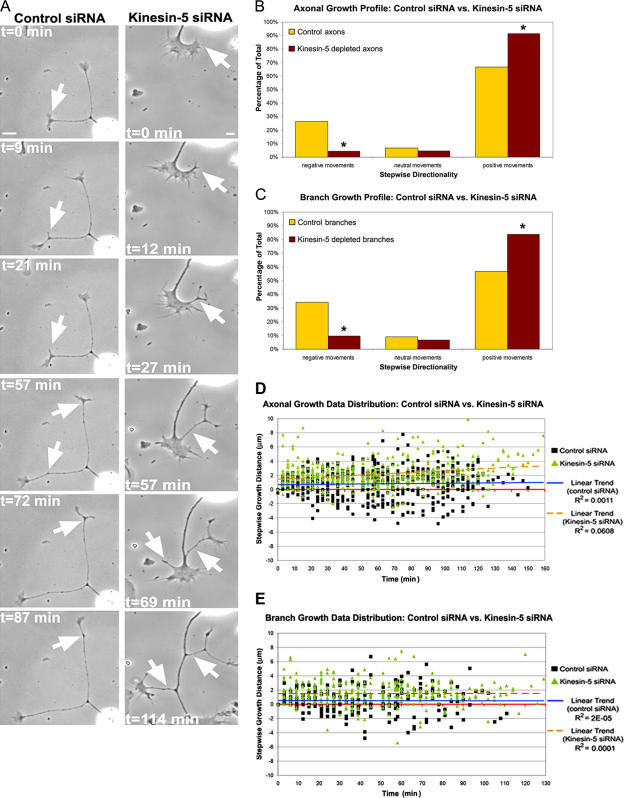
Figure 6.
Kinesin-5 depletion results in fewer bouts of retraction of axons and axonal branches. (A) Time-lapse, phase-contrast images of a control (left) and a kinesin-5u2013depleted neuron (right). Notice tha...
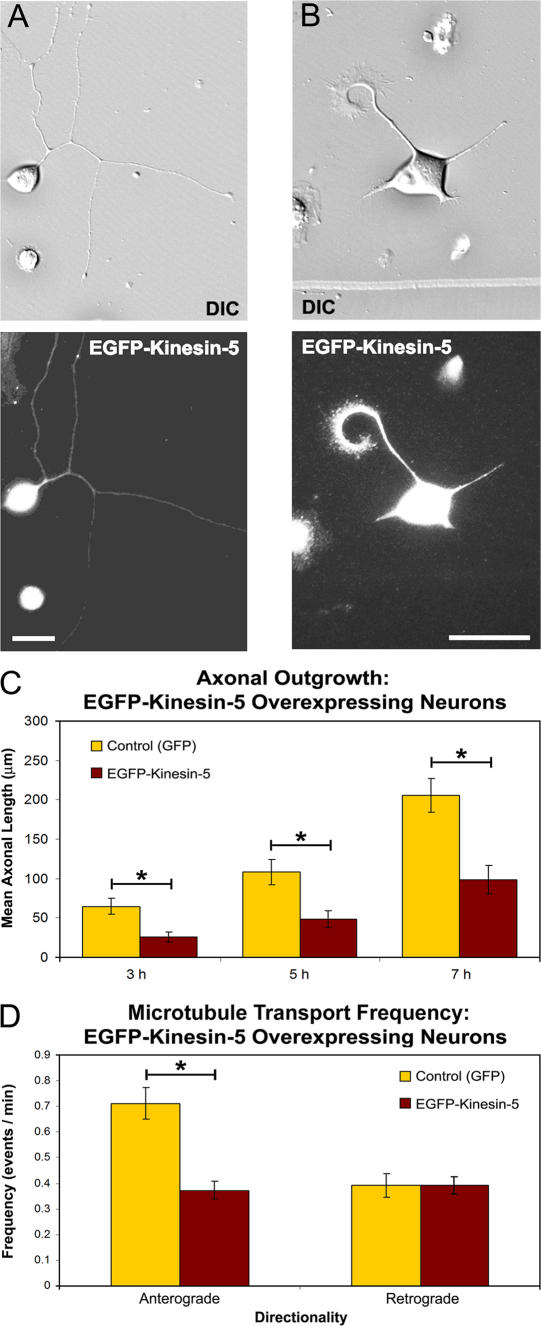
Figure 7.
Axonal growth and microtubule transport frequency are affected by kinesin-5 overexpression. (A and B) DIC (top) and corresponding anti-GFP immunocytochemistry (bottom) in neurons transfected with a wi...
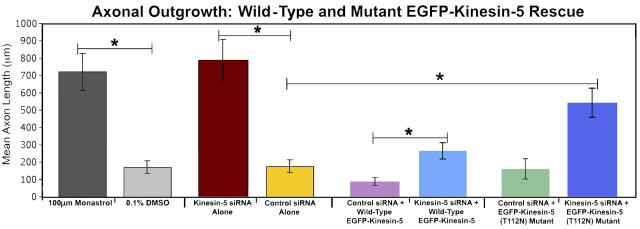
Figure 8.
Kinesin-5 elicits it effects in a force-dependent manner. Inhibition of kinesin-5 by monastrol treatment or depletion of kinesin-5 by siRNA produces mean axonal lengths that are approximately four tim...
Figure images are served from the NIH/NLM PubMed Central Open Access Subset or Europe PMC; copyright remains with the publishers and authors.
💬 Discussion
0 commentsNo comments yet. Be the first to start a discussion!
Leave a Comment