Abstract
Lysosomes are membrane-bound organelles responsible for the transport and degradation of intracellular and extracellular cargo. The intracellular motion of lysosomes is both diffusive and active, mediated by motor proteins moving lysosomes along microtubules. We sought to determine how lysosome diameter influences lysosome transport. We used osmotic swelling to double the diameter of lysosomes, creating a population of enlarged lysosomes. This allowed us to directly examine the intracellular transport of the same organelle as a function of diameter. Lysosome transport was measured using live cell fluorescence microscopy and single particle tracking. We find, as expected, the diffusive component of intracellular transport is decreased proportional to the increased lysosome diameter. Active transport of the enlarged lysosomes is not affected by the increased lysosome diameter.
🔬 Techniques
🔭 Microscopes
🧬 Organisms
💻 Software
✨ Fluorophores
🧪 Sample Preparation
🔬 Cell Lines
🏭 Microscope Brands
🧪 Reagent Suppliers
💻 Software Details
🏛️ Research Organizations (ROR)
Affiliated research institutions:
📋 Methods
Cell Culture
BS-C-1 monkey kidney epithelial cells (CCL-26, ATCC, Manassas, VA) transfected to stably express LAMP1-EYFP have been described previously [21] , [22] . The cells were maintained in a 37°C, 5% carbon dioxide environment in Minimum Essential Medium (MEM, 61100061, Invitrogen, Grand Island, NY) with 10% (v/v) fetal bovine serum (FBS, 10437028, Invitrogen) supplemented with 200 µ g/mL G418 (345810, Calbiochem, Dornstadt, Germany) and passaged every 4 days. For fluorescence microscopy, cells were cultured in 35 mm glass-bottom cell culture dishes (P35G-1.5-14-C, MatTek, Ashland, MA). For live cell imaging, the growth medium was replaced with Leibovitz’s L-15 medium (21083-027, Invitrogen). Nuclei were stained with 27 µ M 4′,6-diamidino-2-phenylindole dilactate (DAPI, D3571, Invitrogen) at 37°C in growth medium for 30 minutes. For static imaging, cells were fixed with 4% (v/v) formaldehyde (28908, Thermo Scientific, Rockford, IL) and imaged in PBS. For sucrose-mediated enlargement of lysosomes, BS-C-1 cells were incubated with 50 mM sucrose (4072–01, J. T. Baker, Phillipsburg, NJ) in MEM containing 10% (v/v) FBS for 12 h. A description of the HeLa cell culture is provided in Text S1 .
Confocal Microscopy
Confocal microscopy images were collected with a FluoView 1000 laser scanning confocal microscope (Olympus, Hunt Optics and Imaging, Pittsburgh, PA) using a 1.42 NA, 60x, oil immersion objective. EYFP was excited with the 514 nm line of an argon ion laser. DAPI was excited with a 405 nm solid state laser. The 535–565 nm and 430–470 nm band pass filters were used to filter emission for EYFP and DAPI, respectively. For all images, the pinhole was set to obtain a 1 µ m thick optical slice. Static images were acquired using Kalman integration with an integration count of 10 for each image. For live cell imaging, the cells were maintained at 37°C using a stage top incubator and objective heater (Tokai Hit, Fujinomiya-shi, Shizuoka-ken, Japan). Images were collected in one way scanning mode with a sampling speed of 2 µs/pixel and a frame captured every 0.307 s.
Show full methods section
Cell Culture
BS-C-1 monkey kidney epithelial cells (CCL-26, ATCC, Manassas, VA) transfected to stably express LAMP1-EYFP have been described previously [21] , [22] . The cells were maintained in a 37°C, 5% carbon dioxide environment in Minimum Essential Medium (MEM, 61100061, Invitrogen, Grand Island, NY) with 10% (v/v) fetal bovine serum (FBS, 10437028, Invitrogen) supplemented with 200 µ g/mL G418 (345810, Calbiochem, Dornstadt, Germany) and passaged every 4 days. For fluorescence microscopy, cells were cultured in 35 mm glass-bottom cell culture dishes (P35G-1.5-14-C, MatTek, Ashland, MA). For live cell imaging, the growth medium was replaced with Leibovitz’s L-15 medium (21083-027, Invitrogen). Nuclei were stained with 27 µ M 4′,6-diamidino-2-phenylindole dilactate (DAPI, D3571, Invitrogen) at 37°C in growth medium for 30 minutes. For static imaging, cells were fixed with 4% (v/v) formaldehyde (28908, Thermo Scientific, Rockford, IL) and imaged in PBS. For sucrose-mediated enlargement of lysosomes, BS-C-1 cells were incubated with 50 mM sucrose (4072–01, J. T. Baker, Phillipsburg, NJ) in MEM containing 10% (v/v) FBS for 12 h. A description of the HeLa cell culture is provided in Text S1 .
Confocal Microscopy
Confocal microscopy images were collected with a FluoView 1000 laser scanning confocal microscope (Olympus, Hunt Optics and Imaging, Pittsburgh, PA) using a 1.42 NA, 60x, oil immersion objective. EYFP was excited with the 514 nm line of an argon ion laser. DAPI was excited with a 405 nm solid state laser. The 535–565 nm and 430–470 nm band pass filters were used to filter emission for EYFP and DAPI, respectively. For all images, the pinhole was set to obtain a 1 µ m thick optical slice. Static images were acquired using Kalman integration with an integration count of 10 for each image. For live cell imaging, the cells were maintained at 37°C using a stage top incubator and objective heater (Tokai Hit, Fujinomiya-shi, Shizuoka-ken, Japan). Images were collected in one way scanning mode with a sampling speed of 2 µs/pixel and a frame captured every 0.307 s.
Data Analysis
Lysosome diameter was measured using ImageJ ( http://rsb.info.nih.gov/ij/ ) with lysosomes approximated as circles. The selection of circular, enlarged, lysosomes was carried out using a size mask of 0.5 µ m 2 to 5.0 µ m 2 . Punctate lysosomes were selected with a size mask of 0.1 µ m 2 to 1.5 µ m 2 . Thresholds were kept the same for all images. Clustered lysosomes were not included in the size analysis. Particle detection and trajectory linking was carried out using the u-track MATLAB (The MathWorks, Natick, MA) software package [35] . For diffusive motion, the average mean square displacement (MSD) curve of 200 randomly selected lysosomes was fit to a line with a slope of 4D where D is the diffusion coefficient. Standard error was calculated and then propagated through to the average MSD curves. Trajectory segments showing consistent motion toward or away from the nucleus for more than 5 frames were considered active transport. Velocities were measured as the frame to frame displacement per second. Velocity distribution were compared using a Kolmogorov-Smirnov test (KS test). A p-value of 0.01 was used as the threshold to determine if two data sets had the same distribution. The null hypothesis is that the two data sets for comparison have the same distribution. A p-value below 0.01 rejects the null hypothesis indicating that the two data sets are from different distributions.
Supporting Information Figure S1 Sucrose-mediated enlargement of lysosomes in HeLa cells. ( A ) Confocal fluorescence microscopy image of untreated HeLa cells shows the normal cellular distribution and punctate appearance of lysosomes (green) labeled with EYFP. The nuclei are stained with DAPI (blue). ( B ) Incubation with sucrose (50 mM, 24 h) leads to enlargement and clustering of lysosomes. The increased diameter gives the lysosomes a circular appearance. The inset shows an expanded view of the region in the red box. The scale bar in the inset is 2 µm. (TIF) Click here for additional data file. Figure S2 Diffusion coefficients of punctate and enlarged lysosomes in sucrose-treated cells. Averaged MSDs from 50 punctate and 50 enlarged lysosomes in 10 sucrose-treated cells. Both MSD curves are fit to a line with a slope of 4D. Error bars show standard error. The ∼2x decrease in diffusion coefficient for enlarged lysosomes is identical to that observed for enlarged lysosomes in sucrose-treated cells compared to punctate lysosomes in untreated cells ( Figure 4 ). The absolute values are a function of cell passage number and cell confluency. The viscosity of 50 mM sucrose is nearly identical to that of water (CRC Handbook of Chemistry and Physics 91 st Edition, 2010) making it unlikely that the decreased diffusion coefficient of the enlarged lysosomes in sucrose-treated cells ( Figure 4 ) is an artifact of increased cytosolic viscosity. These results confirm that sucrose treatment does not affect the overall viscosity of the cell. (TIF) Click here for additional data file. Figure S3 Increased lysosome diameter decreases diffusive lysosome motion in HeLa cells. ( A ) Diffusion coefficients from 200 punctate lysosomes in 3 untreated cells. ( B ) Diffusion coefficients from 200 enlarged lysosomes in 4 sucrose-treated cells. ( C ) Averaged MSDs from the lysosomes shown in ( A) and ( B) . Both MSD curves are fit to a line with a slope of 4D. Error bars show standard error. (TIF) Click here for additional data file. Text S1 Supporting Information. (DOCX) Click here for additional data file.
📊 Figures
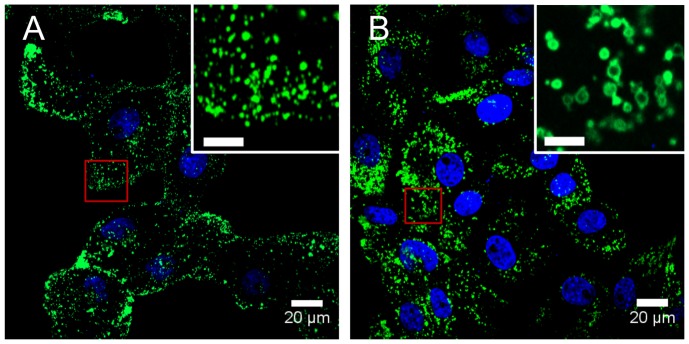
Figure 1
Incubation of cells with sucrose results in enlargement of lysosomes.
( A ) Confocal fluorescence microscopy image of untreated BS-C-1 cells shows the normal cellular distribution and punctate appearance of lysosomes (green) labeled with EYFP. The nuclei are stained wit...
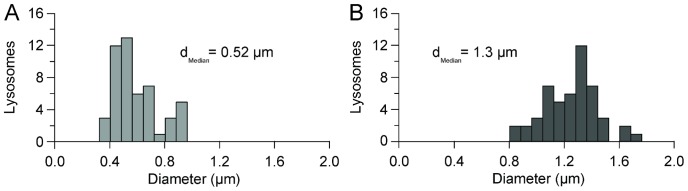
Figure 2
Distribution of lysosome diameters.
( A ) Distribution of lysosome diameters measured in control, untreated cells. ( B ) Incubation with sucrose shifts the distribution of lysosome diameters to greater values. For both plots, nu200a=u20...
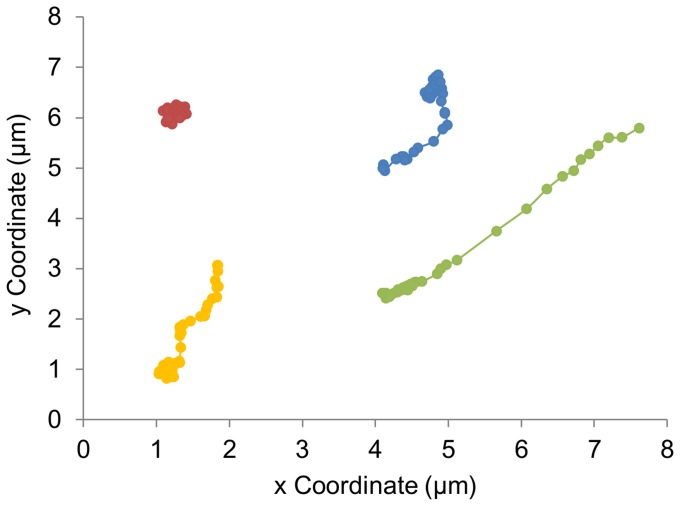
Figure 3
Lysosomes undergo both active transport and diffusive motion.
Representative trajectories of 4 untreated lysosomes. Trajectories show periods of long-range transport and periods of diffusion. An image was recorded every 0.3 seconds.
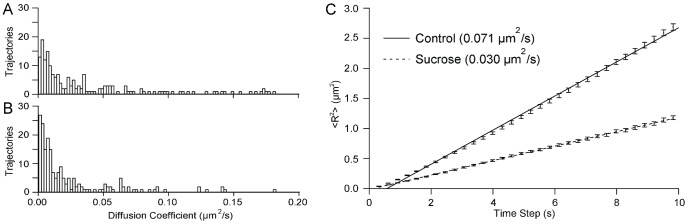
Figure 4
Increased lysosome diameter decreases diffusive lysosome motion.
( A ) Diffusion coefficients from 200 punctate lysosomes in 7 untreated cells. ( B ) Diffusion coefficients from 200 enlarged lysosomes in 7 sucrose-treated cells. ( C ) Averaged MSDs from the lysosom...
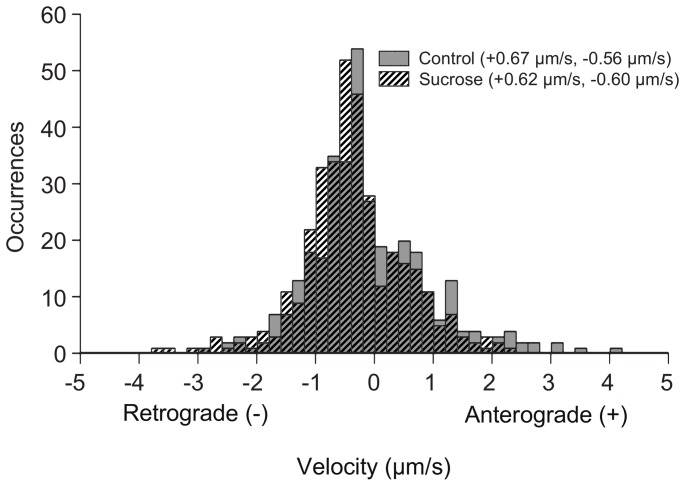
Figure 5
Active transport is unaffected by increased lysosome diameter.
Histogram showing the distribution of lysosome velocities for punctate lysosomes in control cells (solid gray) and enlarged lysosomes in sucrose-treated cells (black stripes) cells. Data for each dist...
Figure images are served from the NIH/NLM PubMed Central Open Access Subset or Europe PMC; copyright remains with the publishers and authors.
💬 Discussion
0 commentsNo comments yet. Be the first to start a discussion!
Leave a Comment