Abstract
This study was designed to identify metalloproteinase determinants of macrophage migration and led to the specific hypothesis that matrix metalloproteinase 10 (MMP10/stromelysin-2) facilitates macrophage migration. We first profiled expression of all MMPs in LPS-stimulated primary murine bone marrow-derived macrophages and Raw264.7 cells and found that MMP10 was stimulated early (3 h) and down-regulated later (24 h). Based on this pattern of expression, we speculated that MMP10 plays a role in macrophage responses, such as migration. Indeed, using time lapse microscopy, we found that RNAi silencing of MMP10 in primary macrophages resulted in markedly reduced migration, which was reversed with exogenous active MMP10 protein. Mmp10 (-/-) bone marrow-derived macrophages displayed significantly reduced migration over a two-dimensional fibronectin matrix. Invasion of primary wild-type macrophages into Matrigel supplemented with fibronectin was also markedly impaired in Mmp10 (-/-) cells. MMP10 expression in macrophages thus emerges as an important moderator of cell migration and invasion. These findings support the hypothesis that MMP10 promotes macrophage movement and may have implications in understanding the control of macrophages in several pathologies, including the abnormal wound healing response associated with pro-inflammatory conditions.
🔬 Techniques
🧬 Organisms
💻 Software
✨ Fluorophores
🧪 Sample Preparation
🔬 Cell Lines
🏭 Microscope Brands
🧪 Reagent Suppliers
📷 Detectors
💻 Software Details
🏛️ Research Organizations (ROR)
Affiliated research institutions:
📋 Methods
Materials Unless otherwise stated all chemical reagents were purchased from Sigma-Aldrich Corp. (St. Louis, MO, USA), all tissue culture reagents from Gibco Invitrogen Corp. (Paisley, Scotland, UK) and all tissue culture plastics from Nunc Thermo Fisher Scientific (Rochester, NY, USA). Bone Marrow-derived Macrophages Bone Marrow-derived Macrophages (BMDM) were isolated from the femurs and tibias of C57Bl/6 mice (according to institutional guidelines and UK Home Office requirements) essentially as previously described [28] . Briefly, bone marrow was flushed from the bone cavity with a 21 g needle and syringe (BD, Oxford, UK) containing macrophage medium consisting of Roswell Park Memorial Institute (RPMI) 1640 liquid medium containing 100 units/ml penicillin/streptomycin antibiotic, 5 mM L-glutamine, 1% (v/v) sodium pyruvate, 0.5% (v/v) nonessential amino acids, 24 µM tissue culture grade β-mercaptoethanol, supplemented with 10% (v/v) fetal bovine serum (FBS; BioSera, East Sussex, UK) and 10% (v/v) L929-cell-conditioned medium (LCM) as a source of Colony Stimulating Factor-1 (CSF-1) [29] . Cells in the bone marrow flush were plated onto non-treated bacteriological petri dishes (BD Falcon, Oxford, UK) in macrophage medium. After three days of incubation at 37°C, 5% CO 2 , the non-adherent population was re-plated with fresh macrophage medium. The adherent population was discarded. After a further five days culture the non-adherent population was discarded, whilst remaining adherent BMDM were harvested for experimentation. BMDM from Mmp10 −/− mice [15] and wild-type littermates (protocols approved by the Institutional Animal Care and Use Committee at the University of Washington) were isolated as above. RNA Purification, Reverse Transcription and Quantitative Real Time – PCR For analysis of gene expression BMDM (5×10 5 ) were transferred into medium containing 0.2% FBS and exposed to 100 ng/mL γ-irradiated Lipopolysaccharide (LPS) purified from E. coli (0111:B4) for the duration of the experiment stated. Total RNA was purified from BMDM cell lysates using the RNeasy Minikit (Qiagen, West Sussex, UK) according to the manufacturer’s instructions and including an additional DNase 1 (Invitrogen Ltd, Paisley, UK) step. Purified mRNA (250 ng–1 µg) was reverse transcribed to complementary DNA (cDNA) using Superscript II Reverse Transcriptase (Invitrogen Ltd) according to the manufacturer’s instructions. Quantitative real-time PCR (qRT-PCR) reactions were performed using the 7500 Fast RT-PCR System and Taqman® primers and probes (Applied Biosystems, CA, USA) for murine metalloproteinases as described in [30] and [31] and QuantiTect probe PCR Master Mix (Qiagen) according to the manufacturer’s instructions. Forward and reverse primer and probe sequences for TNFα were designed using Primer Express software (Applied Biosystems; forward 5′ –AGACCCTCACACTCAGATCATCTTC–3′, reverse 5′ –CCACTTGGTGGTTTGCTACGA–3′, and probe 5′-FAM-CAAAATTCGAGTGACAAGCCTGTAGCCCA-TAMRA -3′). Steady state mRNA expression was normalized against 18 s ribosomal RNA expression using the comparative cycle threshold method (ΔΔC T ). Statistical analysis of change in gene expression between two sets of data was performed using the two-tailed Student’s T-test on sample groups no smaller than n = 3. MMP10 Protein Immunostaining BMDM (2×10 4 cells per 13 mm glass coverslip) under indicated conditions were treated with 5 µM Monensin Sodium Salt for 3 h to block intracellular protein transport [32] and then fixed with a 4% (w/v) Paraformaldehyde solution. Cell membranes were permeablised with 0.1% (v/v) Triton X-100 and non-specific binding was blocked with 10% (v/v) normal donkey serum (DAKO, Ely, UK) before incubation with Sheep anti-MMP10 polyclonal primary antibody [33] . BMDM were washed to remove unbound primary antibody before incubation with Donkey anti-Sheep Alexa-Fluor 488 conjugated polyclonal IgG secondary antibody (Molecular Probes/Invitrogen, Paisley, UK). Before mounting with Hydromount mounting medium (National Diagnostics, GA, USA), 4′,6-diamidino-2-phenylindole (DAPI) nuclear stain was applied. Gene Silencing BMDM (1.5×10 4 ) were seeded onto 10 µg/mL bovine plasma fibronectin (Calbiochem/Merck, Nottingham, UK) coated plastic wells 24 h prior to transfection. 15 nM lyophilised siGENOME SMARTpool siRNA targeting mouse MMP10 (siMMP10; 5′-GAAUUGAGCCACAAGUUGA-3′, 5′-GAGAUGUUCACUUCGAUGA-3′, 5′-CCUCAGGGACCAACUUAUU-3′. Dharmacon, CO, USA) and AllStars Negative Control (5′- GGGAAGUCCUAUUCUUUAA-3′. Qiagen, West Sussex, UK) were combined with HiPerfect Transfection Reagent (Qiagen) and added to BMDM a further 24 h before time-lapse microscopy began. Where stated, 3 ng/mL recombinant human (r)MMP10 [34] , was added to BMDM cultures for 6 h before time-lapse microscopy.
Show full methods section
Materials Unless otherwise stated all chemical reagents were purchased from Sigma-Aldrich Corp. (St. Louis, MO, USA), all tissue culture reagents from Gibco Invitrogen Corp. (Paisley, Scotland, UK) and all tissue culture plastics from Nunc Thermo Fisher Scientific (Rochester, NY, USA). Bone Marrow-derived Macrophages Bone Marrow-derived Macrophages (BMDM) were isolated from the femurs and tibias of C57Bl/6 mice (according to institutional guidelines and UK Home Office requirements) essentially as previously described [28] . Briefly, bone marrow was flushed from the bone cavity with a 21 g needle and syringe (BD, Oxford, UK) containing macrophage medium consisting of Roswell Park Memorial Institute (RPMI) 1640 liquid medium containing 100 units/ml penicillin/streptomycin antibiotic, 5 mM L-glutamine, 1% (v/v) sodium pyruvate, 0.5% (v/v) nonessential amino acids, 24 µM tissue culture grade β-mercaptoethanol, supplemented with 10% (v/v) fetal bovine serum (FBS; BioSera, East Sussex, UK) and 10% (v/v) L929-cell-conditioned medium (LCM) as a source of Colony Stimulating Factor-1 (CSF-1) [29] . Cells in the bone marrow flush were plated onto non-treated bacteriological petri dishes (BD Falcon, Oxford, UK) in macrophage medium. After three days of incubation at 37°C, 5% CO 2 , the non-adherent population was re-plated with fresh macrophage medium. The adherent population was discarded. After a further five days culture the non-adherent population was discarded, whilst remaining adherent BMDM were harvested for experimentation. BMDM from Mmp10 −/− mice [15] and wild-type littermates (protocols approved by the Institutional Animal Care and Use Committee at the University of Washington) were isolated as above. RNA Purification, Reverse Transcription and Quantitative Real Time – PCR For analysis of gene expression BMDM (5×10 5 ) were transferred into medium containing 0.2% FBS and exposed to 100 ng/mL γ-irradiated Lipopolysaccharide (LPS) purified from E. coli (0111:B4) for the duration of the experiment stated. Total RNA was purified from BMDM cell lysates using the RNeasy Minikit (Qiagen, West Sussex, UK) according to the manufacturer’s instructions and including an additional DNase 1 (Invitrogen Ltd, Paisley, UK) step. Purified mRNA (250 ng–1 µg) was reverse transcribed to complementary DNA (cDNA) using Superscript II Reverse Transcriptase (Invitrogen Ltd) according to the manufacturer’s instructions. Quantitative real-time PCR (qRT-PCR) reactions were performed using the 7500 Fast RT-PCR System and Taqman® primers and probes (Applied Biosystems, CA, USA) for murine metalloproteinases as described in [30] and [31] and QuantiTect probe PCR Master Mix (Qiagen) according to the manufacturer’s instructions. Forward and reverse primer and probe sequences for TNFα were designed using Primer Express software (Applied Biosystems; forward 5′ –AGACCCTCACACTCAGATCATCTTC–3′, reverse 5′ –CCACTTGGTGGTTTGCTACGA–3′, and probe 5′-FAM-CAAAATTCGAGTGACAAGCCTGTAGCCCA-TAMRA -3′). Steady state mRNA expression was normalized against 18 s ribosomal RNA expression using the comparative cycle threshold method (ΔΔC T ). Statistical analysis of change in gene expression between two sets of data was performed using the two-tailed Student’s T-test on sample groups no smaller than n = 3. MMP10 Protein Immunostaining BMDM (2×10 4 cells per 13 mm glass coverslip) under indicated conditions were treated with 5 µM Monensin Sodium Salt for 3 h to block intracellular protein transport [32] and then fixed with a 4% (w/v) Paraformaldehyde solution. Cell membranes were permeablised with 0.1% (v/v) Triton X-100 and non-specific binding was blocked with 10% (v/v) normal donkey serum (DAKO, Ely, UK) before incubation with Sheep anti-MMP10 polyclonal primary antibody [33] . BMDM were washed to remove unbound primary antibody before incubation with Donkey anti-Sheep Alexa-Fluor 488 conjugated polyclonal IgG secondary antibody (Molecular Probes/Invitrogen, Paisley, UK). Before mounting with Hydromount mounting medium (National Diagnostics, GA, USA), 4′,6-diamidino-2-phenylindole (DAPI) nuclear stain was applied. Gene Silencing BMDM (1.5×10 4 ) were seeded onto 10 µg/mL bovine plasma fibronectin (Calbiochem/Merck, Nottingham, UK) coated plastic wells 24 h prior to transfection. 15 nM lyophilised siGENOME SMARTpool siRNA targeting mouse MMP10 (siMMP10; 5′-GAAUUGAGCCACAAGUUGA-3′, 5′-GAGAUGUUCACUUCGAUGA-3′, 5′-CCUCAGGGACCAACUUAUU-3′. Dharmacon, CO, USA) and AllStars Negative Control (5′- GGGAAGUCCUAUUCUUUAA-3′. Qiagen, West Sussex, UK) were combined with HiPerfect Transfection Reagent (Qiagen) and added to BMDM a further 24 h before time-lapse microscopy began. Where stated, 3 ng/mL recombinant human (r)MMP10 [34] , was added to BMDM cultures for 6 h before time-lapse microscopy.
2D Cell Migration Assay and Time-lapse Microscopy
BMDM were seeded onto plastic wells (24 well plates) coated with rat tail collagen I (BD Biosciences, Oxford, UK), human plasma fibrinogen (Calbiochem/Merck) or bovine plasma fibronectin (all ECM components at 10 µg/mL). BMDM in 24 well plates (alone or transfected with siRNA for MMP10 as indicated) were transferred to a motorised stage within a controlled environment chamber, also at 37°C, 5% CO 2 . Cells were imaged every 10 minutes for 17 h with the AxioCam ICm 1 monochrome CCD camera attached to the Axiovert 200M wide field inverted light microscope using Axiovision 4.8.2 software (all Carl Zeiss Ltd, Herts, UK). Cell migration speed was determined following measurement of distance translocated by cells using ImageJ software [35] with gel-ins ‘Manual Tracking’ (F. Cordelières, Institute Curie, France) and ‘Chemotaxis and Migration Tool’ (Trapp and Horn, Ibidi GmbH, Germany). 3D Inverted Invasion Assay and Confocal Imaging The 3D inverted invasion assay was performed as described previously [36] with some modifications. Briefly, 100 µL of Matrigel (BD Biosciences; stock mixed 1∶1 with ice-cold PBS and supplemented with bovine plasma fibronectin to a final concentration of 50 µg/mL), was transferred to a Transwell™ insert (8 µm pore; Corning, NY, USA) to polymerise at 37°C, 5% CO 2 . After polymerisation, Transwell™ inserts were inverted and 5×10 4 wild-type or Mmp10 −/− BMDM were applied directly to the underside of the insert filter and allowed to adhere for 2 h, before further inversion and gentle washing to remove any non-adherent cells. Finally, Transwell™ inserts were placed into a chamber containing macrophage medium whilst 100 ng/mL LPS was applied to the upper Transwell™ chamber to establish a chemotactic gradient through the Matrigel/fibronectin gel. Transwell™ cultures were incubated for 72 h to allow invasion into the gel. Cells were then stained with 4 µM Calcein-AM (Molecular Probes/Invitrogen). Confocal images of cells adherent to the filter were obtained, to confirm cell adhesion had remained constant across conditions during the experiment. These cells were then removed with a cotton swab to ensure only migrating cells were analysed. Serial confocal optical sections (20 µm) of the Matrigel/fibronectin gel were captured with a Leica TCS SP2 laser scanning confocal microscope and LCS software package (Leica Microsystems Ltd, Bucks, UK). For each experimental condition the inverted invasion assay was performed in duplicate Transwells and confocal data was collected from 3 fields of view per Transwell (6 fields of view in total). Experiments were repeated with cells independently isolated from 2 mice per genotype. Invasion data was quantified using ImageJ software (NIH) with gel-in ‘Area Calculator’ (Sergio Caballero, University of Florida, USA). Unless otherwise stated all experiments were performed at least 3 times, with a representative experiment shown. Statistical analysis was performed using Student’s t -test.
Materials Unless otherwise stated all chemical reagents were purchased from Sigma-Aldrich Corp. (St. Louis, MO, USA), all tissue culture reagents from Gibco Invitrogen Corp. (Paisley, Scotland, UK) and all tissue culture plastics from Nunc Thermo Fisher Scientific (Rochester, NY, USA).
Supporting Information Figure S1 An extended time course of macrophage MMP10 expression following treatment with LPS. Steady state mRNA levels for MMP10 are elevated at 4 h, return to basal levels by 8 h and are repressed at 24 h. By 48 h MMP10 expression levels return to untreated levels and a similar level of expression is observed at 72 h. (TIF) Click here for additional data file. Figure S2 Typical examples to demonstrate approximately equal numbers of wild-type and Mmp10 −/− BMDM adhering to the lower surface of the Transwell™ filters for the inverted invasion assay. BMDM were stained with Calcein-AM and visualised by confocal microscopy. (TIF) Click here for additional data file.
📊 Figures
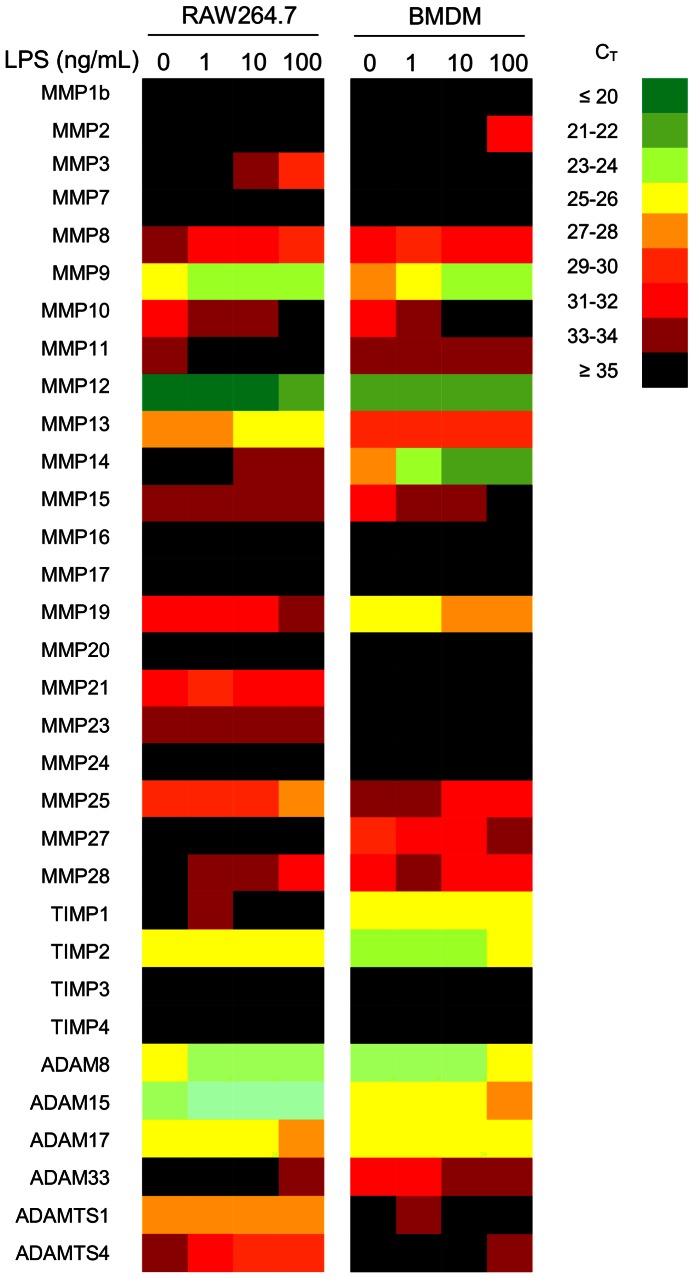
Figure 1
LPS regulates steady state expression of metalloproteinases and TIMPs in Raw264.7 macrophages and in BMDM.
Macrophages were cultured alone or in indicated concentrations of LPS for 24 h prior to RNA extraction, reverse transcription and qRT-PCR analysis. A heat map represents the mean expression in C T val...
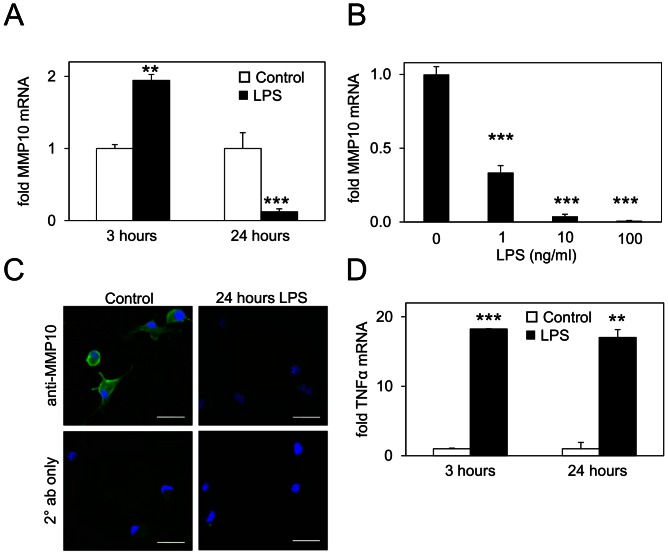
Figure 2
Macrophage MMP10 expression is modulated in a time-dependent manner in response to LPS.
(A) Increased steady-state levels of MMP10 mRNA 3 h post-LPS treatment in BMDM and decreased levels of MMP10 mRNA 24 h post-LPS treatment as determined by qRT-PCR. (B) Repression of MMP10 mRNA express...
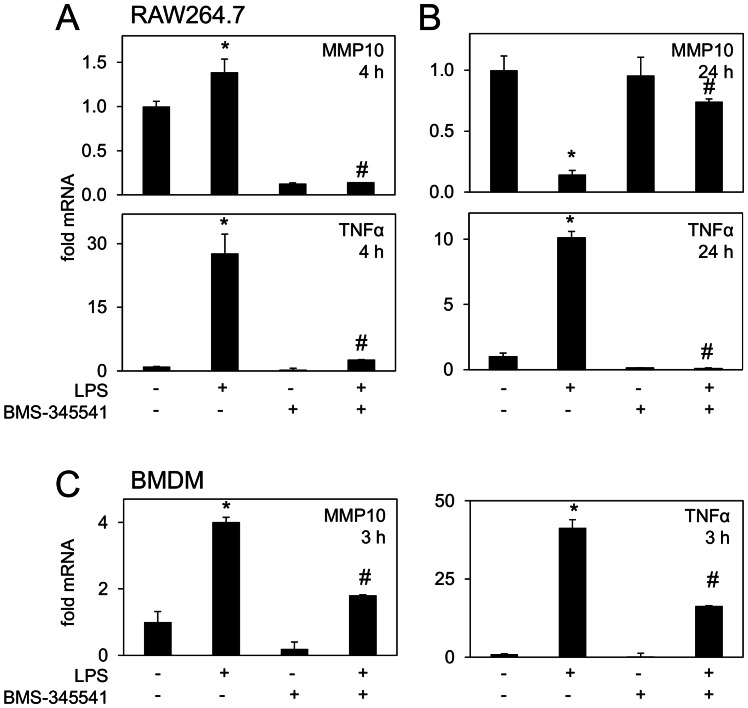
Figure 3
The time-dependant effects of LPS on macrophage MMP10 expression are sensitive to NF-u03baB inhibition.
(A) Induction of MMP10 (above) and TNFu03b1 mRNA (below) in LPS-treated Raw264.7 macrophages was abrogated by IKK inhibitor BMS-345541 at 4 h as determined by qRT-PCR (B) The repression of MMP10 mRNA ...
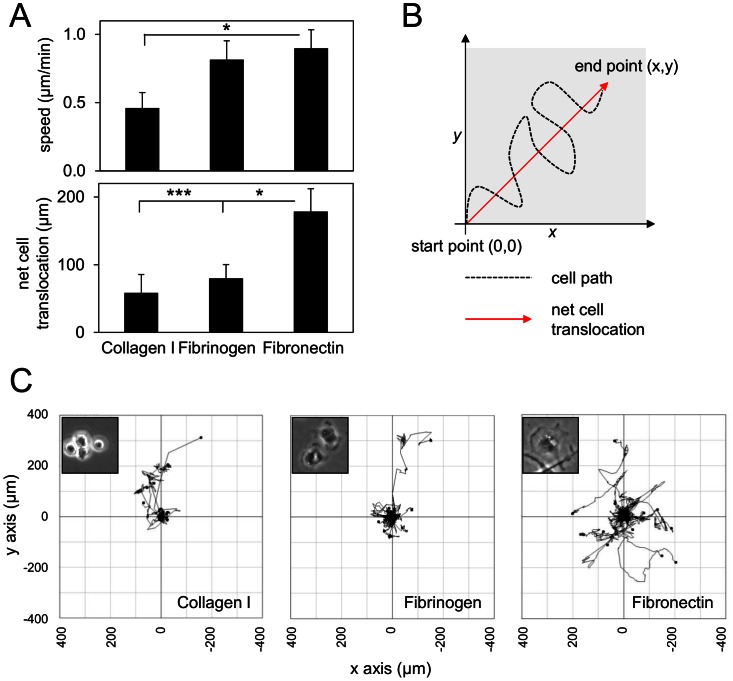
Figure 4
Fibronectin is a good substrate for random migration of primary macrophages.
BMDM were cultured on thin coatings of collagen I, fibrinogen or fibronectin for 24 h. (A) Time-lapse microscopy analysis reveals no significant variation in speed of macrophage migration (above), how...
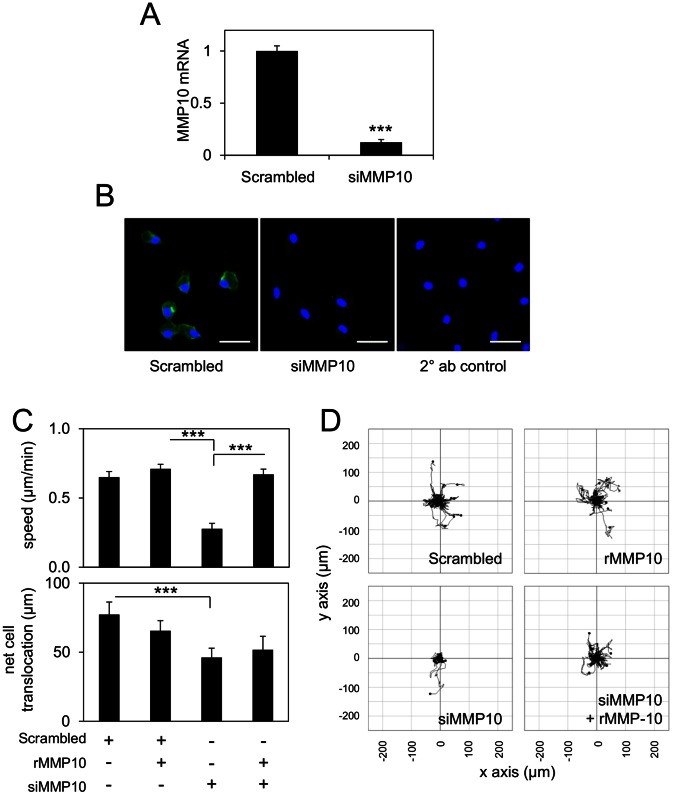
Figure 5
Repression of random macrophage migration on fibronectin by gene silencing of MMP10 and rescue by the exogenous application of soluble rMMP10.
(A) qRT-PCR analysis reveals successful repression of MMP10 mRNA expression in BMDM transfected with siMMP10 compared to scrambled control siRNA. ***pu22640.001. Each bar represents mean u00b1 S.E.M. ...
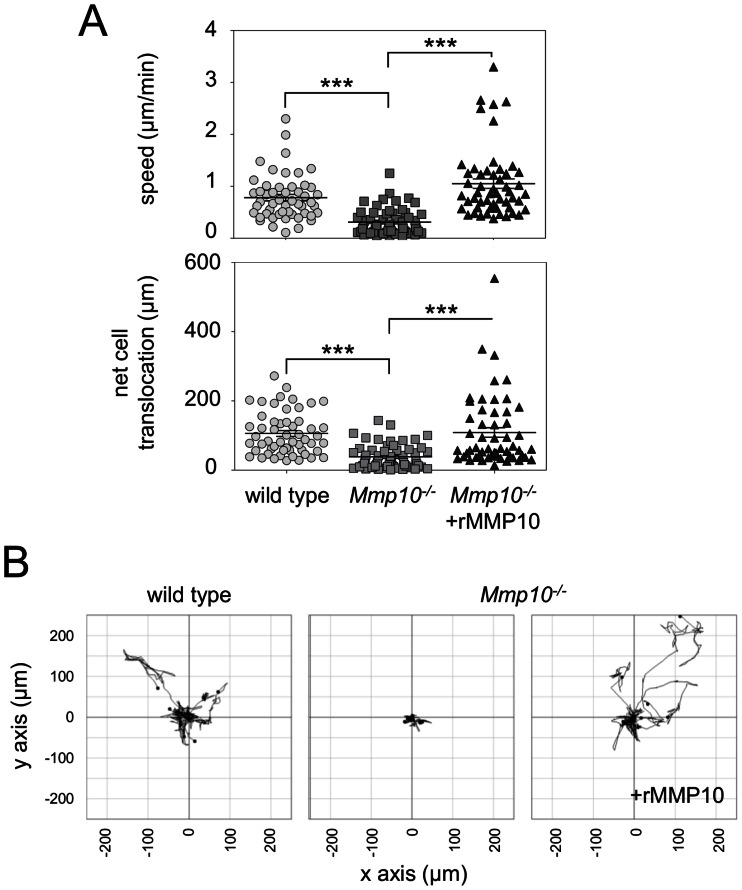
Figure 6
Mmp10 u2212/u2212 macrophages display reduced migration that can be rescued with the exogenous application of soluble rMMP10.
BMDM from the Mmp10 u2212/u2212 mouse and their back-crossed wild-type (WT) litter-mates were cultured on fibronectin for 24 h before the addition of rMMP10 as indicated. (A) Time-lapse microscopy ana...
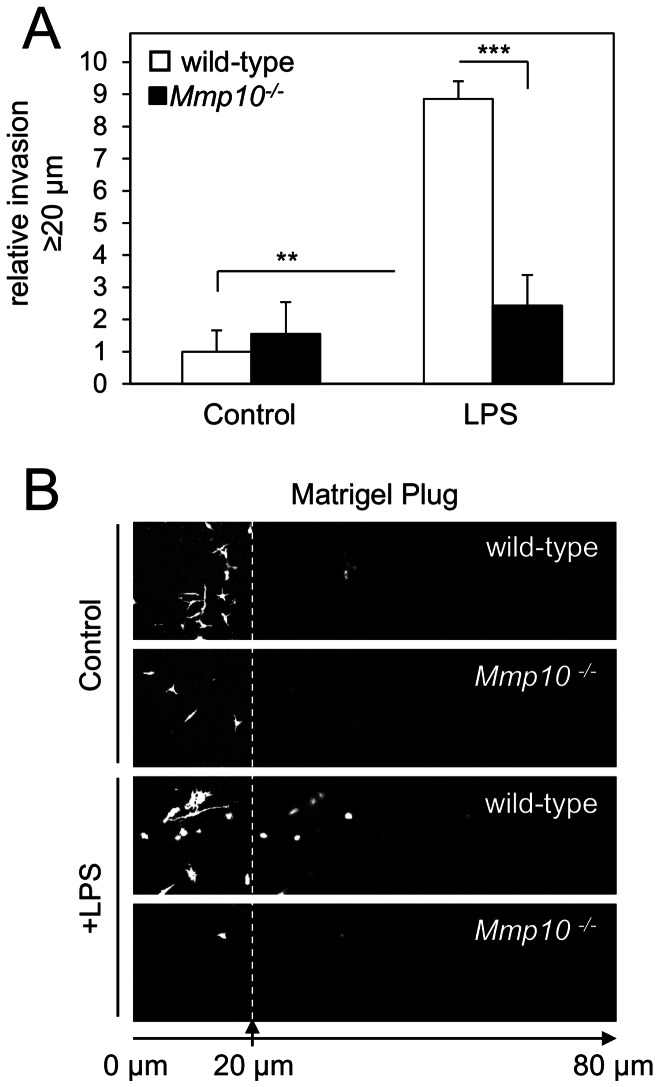
Figure 7
Invasion through a 3D Matrigel/fibronectin gel is impaired in Mmp10 u2212/u2212 macrophages.
An inverted invasion assay was performed to compare 3D invasion of BMDM from the Mmp10 u2212/u2212 mouse and their back-crossed wild-type litter-mates. BMDM were allowed to invade into a Matrigel/fibr...
Figure images are served from the NIH/NLM PubMed Central Open Access Subset or Europe PMC; copyright remains with the publishers and authors.
💬 Discussion
0 commentsNo comments yet. Be the first to start a discussion!
Leave a Comment