Metal-catalyzed uncaging of DNA-binding agents in living cells†Electronic supplementary information (ESI) available: Synthesis and characterization of the studied molecules and required precursors. NMR, UV, and fluorescence spectra, titrations, control experiments, and detailed procedures for cell uptake and co-staining experiments. See DOI: 10.1039/c3sc53317dClick here for additional data file.
Abstract
Attachment of alloc protecting groups to the amidine units of fluorogenic DNA-binding bisbenzamidines or to the amino groups of ethidium bromide leads to a significant reduction of their DNA affinity. More importantly, the active DNA-binding species can be readily regenerated by treatment with ruthenium catalysts in aqueous conditions, even in cell cultures. The catalytic chemical uncaging can be easily monitored by fluorescence microscopy, because the protected products display both different emission properties and cell distribution to the parent compounds.
🔬 Techniques
✨ Fluorophores
🧪 Sample Preparation
🔬 Cell Lines
🏛️ Research Organizations (ROR)
Affiliated research institutions:
📊 Figures
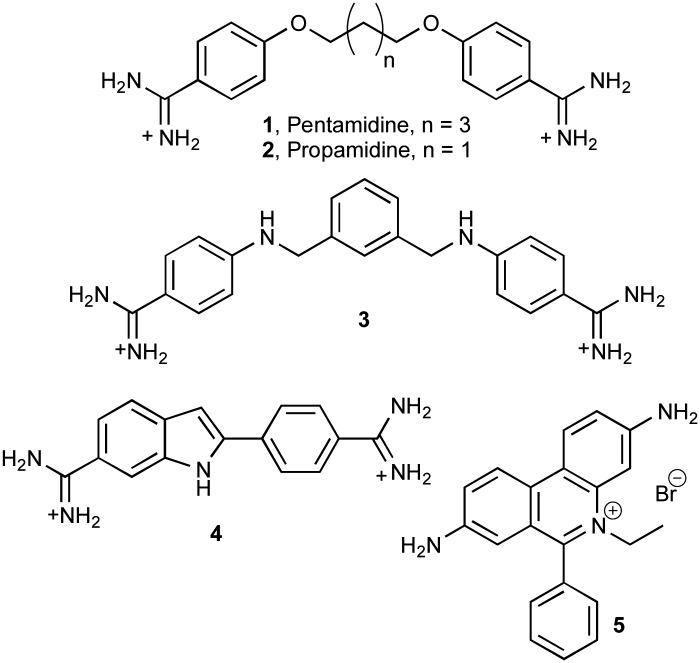
Fig. 1
Structure of selected DNA binders: pentamidine ( 1 ), propamidine ( 2 ), phenyl azapentamidine ( 3 ), DAPI ( 4 ) ethidium bromide ( 5 ).
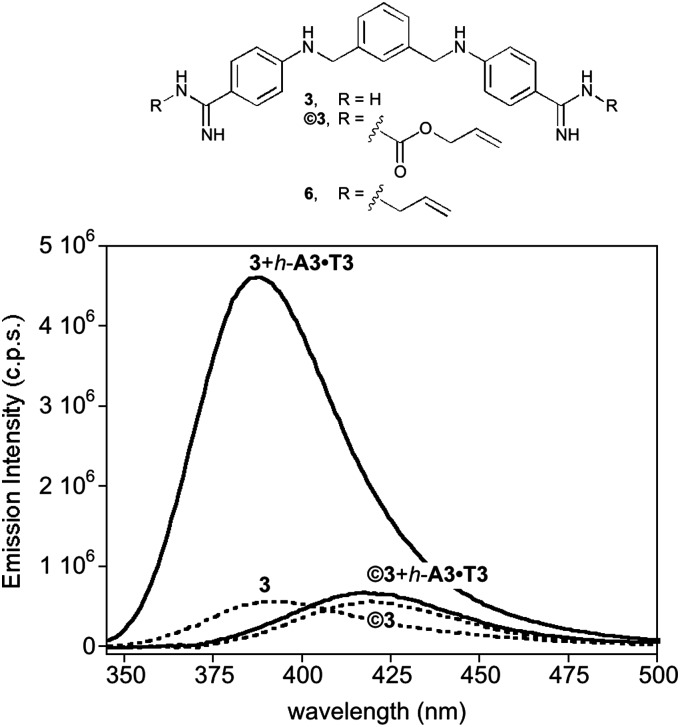
Fig. 2
Top: Structures of the alloc ( u00a93 ), and allyl ( 6 ) protected derivatives of bisbenzamidine 3 . Bottom: fluorescence emission of 5 u03bcM solutions of 3 and u00a93 in Trisu2013HCl 20 mM, 100 mM NaCl, pH 7.5 (dashed lines), and in the presence of 1 equiv. of h - A3u00b7T3 (solid lines). h -A3u00b7T3 : 5u2032-GGC- AAATTT -CAGTTTTTCTG- AAATTT -GCC-3u2032.
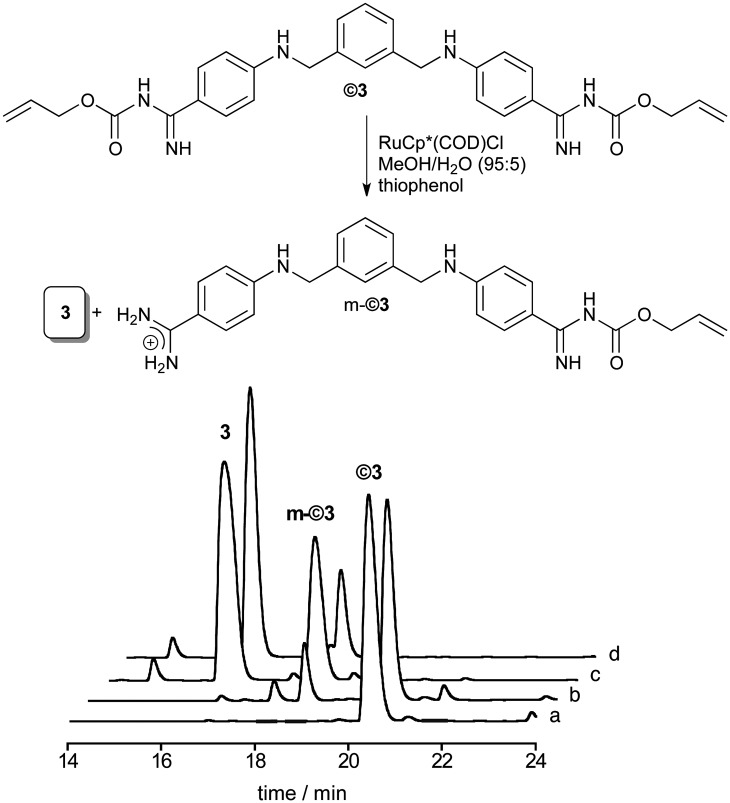
Fig. 3
Top: catalytic deprotection in phosphate buffer and 10% DMSO. Bottom: HPLC trace of the uncaging reaction in phosphate buffer 100 mM pH 7.5, and 10% DMSO. (a) u00a93 (75 mM); (b) u00a93 + PhSH (325 mM); (c) u00a93 + PhSH + [Ru] (10%), t = 1 min; (d) u00a93 + PhSH + [Ru], t = 20 min.
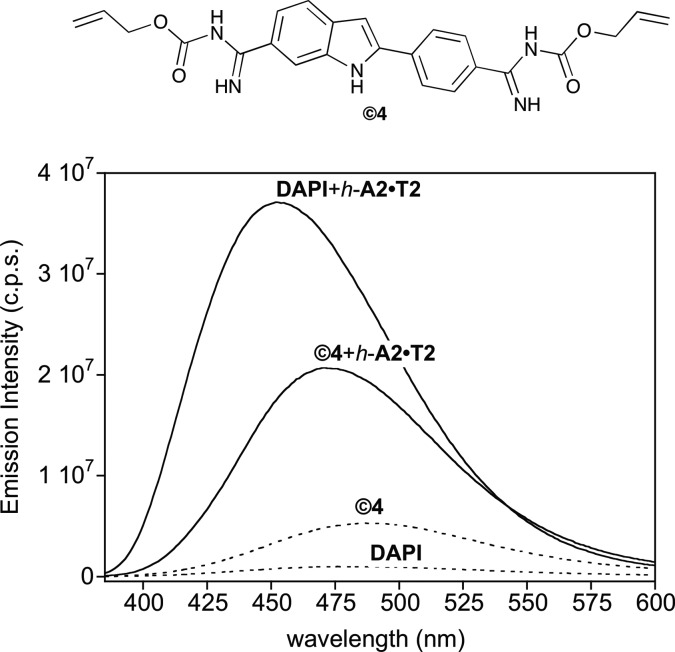
Fig. 4
Top: Structure of u00a94 . Bottom: fluorescence spectra of DAPI ( 4 ) and u00a94 in the absence (dashed lines) and in the presence of 1 equiv. of h - A2u00b7T2 (solid lines). Experiments were carried out using 0.2 u03bcM of u00a94 and 4 in TrisHCl 20 mM, 100 mM NaCl, pH 7.5 at 20 u00b0C. Sequence of: h - A2u00b7T2 : 5u2032-GGCG AATT CAGCTTTTTGCTG AATT GCC-3u2032.
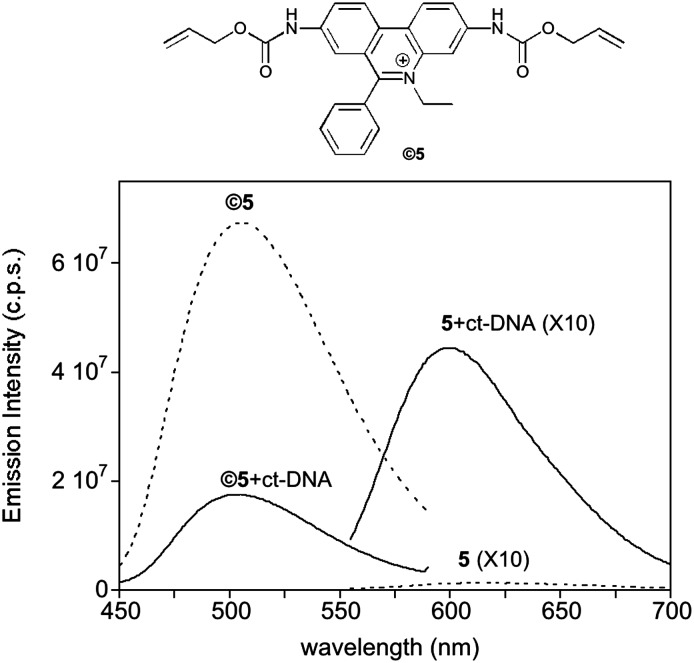
Fig. 5
Top: Structure of u00a95 . Bottom: fluorescence emission spectra of 1 u03bcM 5 and u00a95 (dashed lines), and spectra of both compounds in the presence of 0.3 mg mL u20131 of ct-DNA (solid lines). Spectra of 5 and of 5 in the presence of ct-DNA are represented multiplied by a factor of 10 for comparison. u03bb exc 5 = 545 nm, u03bb exc u00a95 = 300 nm.
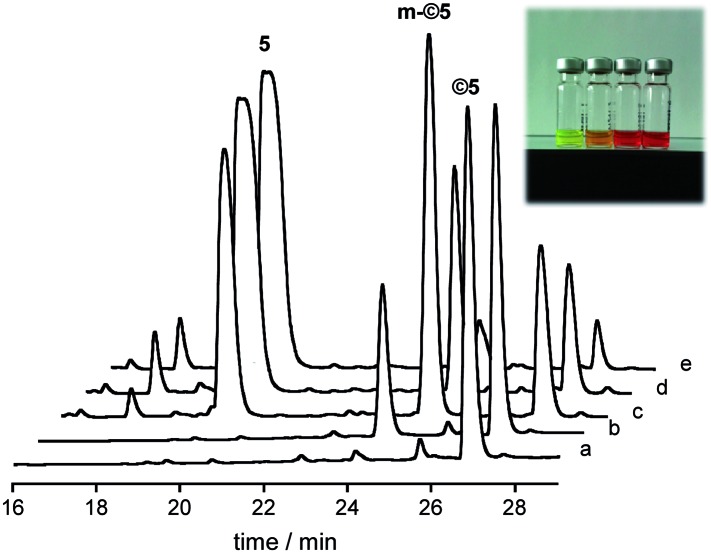
Fig. 6
HPLC trace of the deprotection reaction of u00a95 . (a) u00a95 in buffer (50 mM); (b) u00a95 + PhSH (250 mM) + ct-DNA (0.1 mg ml u20131 ); (c) u00a95 + PhSH + ct-DNA + Ru (10%) t = 0; (d) u00a95 + PhSH + ct-DNA + Ru t = 20 min; (e) u00a95 + PhSH + ct-DNA + Ru t = 1 h. Inset: picture (left to right) of the aliquots a, b, c and e.
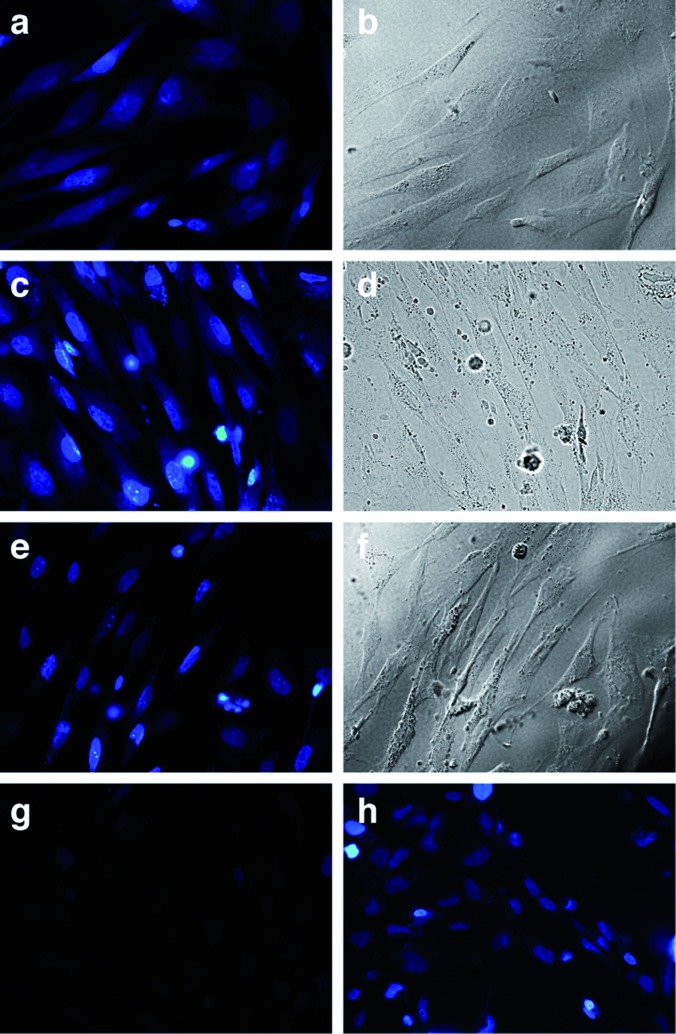
Fig. 7
Ru-catalyzed deprotection of 2.5 u03bcM u00a94 in CEF cells: (a) u00a94 , 30 min at 37 u00b0C, blue channel; (b) u00a94 , 30 min at 37 u00b0C, brightfield; (c) u00a94 treated with 2.5 u03bcM [Ru] and 100 u03bcM PhSH, 8 min, blue channel; (d) u00a94 treated with 2.5 u03bcM [Ru] and 100 u03bcM PhSH, 8 min, brightfield; (e) u00a94 treated 20 min with 2.5 u03bcM [Ru] and 100 u03bcM PhSH, 20 min, blue channel; (f) u00a94 treated 20 min with 2.5 u03bcM [Ru] and 100 u03bcM PhSH, 20 min, brightfield. (g) control with 2.5 u03bcM 4 after 30 min at 37 u00b0C, blue channel; (h) control with 15 u03bcM 4 after 30 min, 37 u00b0C, blue channel. Blue channel fluorescence microscopy settings: excitation filter 360u2013370 nm, emission filter 420 nm and dichromatic mirror 400 nm.
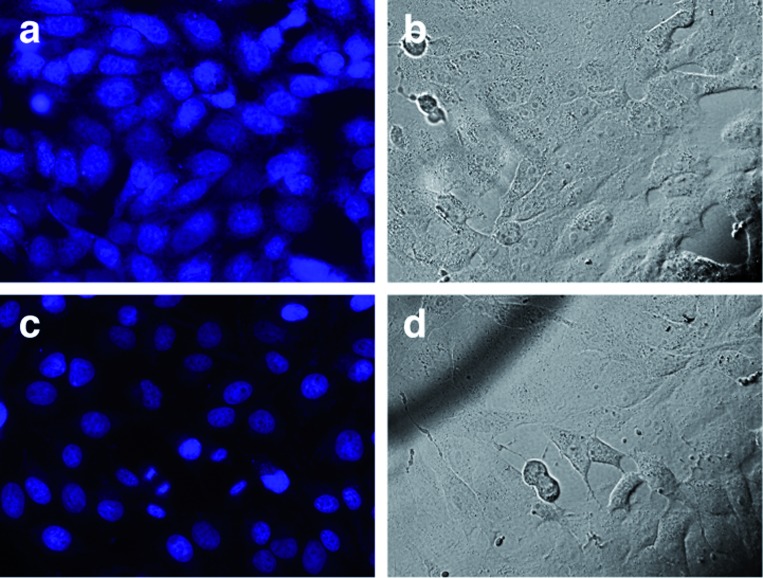
Fig. 8
Ru-catalyzed deprotection of 2.5 u03bcM of u00a94 in Vero cells. Top row: u00a94 , 30 min at 37 u00b0C (a) blue channel; (b) brightfield. Bottom row: u00a94 with 2.5 u03bcM [Ru] and 100 u03bcM PhSH, 20 min; (c) blue channel; (d) brightfield.
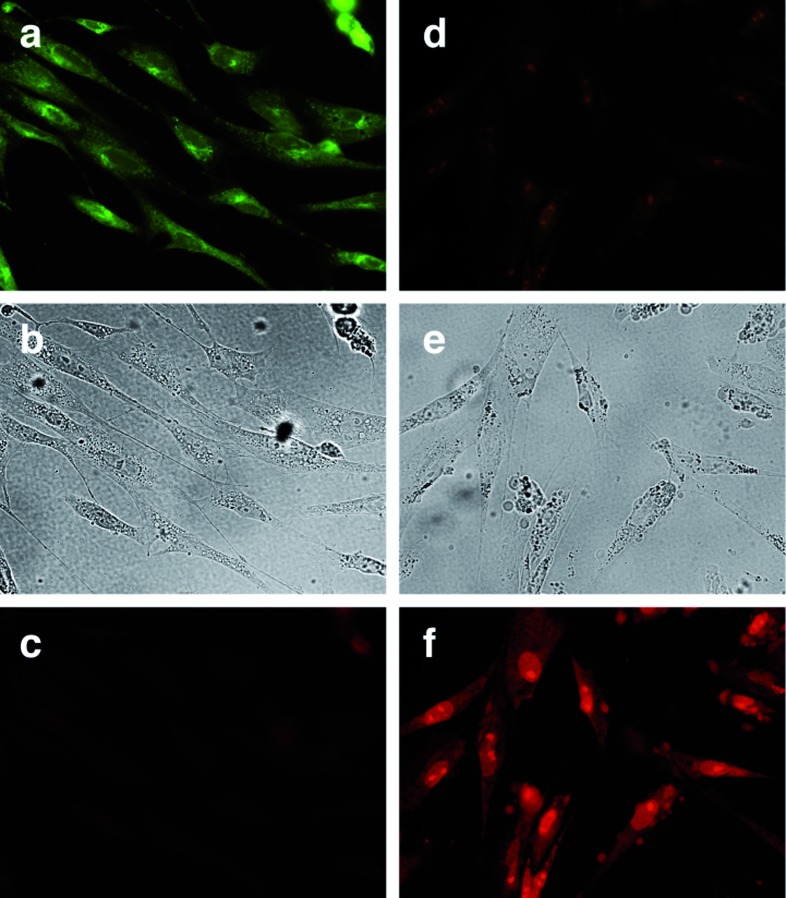
Fig. 9
Ru-catalyzed deprotection of 10 u03bcM u00a95 in CEF cells. Left column: u00a95 , 30 min at 37 u00b0C; (a) green channel; (b) brightfield; (c) red channel. Right column: u00a95 incubated with 20 u03bcM [Ru] and 100 u03bcM PhSH, 20 min; (d) green channel; (e) brightfield; (f) red channel. Fluorescence microscopy settings for green channel: filter 530u2013550 nm, emission filter 590 nm and dichromatic mirror 570 nm; and for red channel: filter 530u2013550 nm, emission filter 590 nm and dichromatic mirror 570 nm.
Figure images are served from the NIH/NLM PubMed Central Open Access Subset or Europe PMC; copyright remains with the publishers and authors.
💬 Discussion
0 commentsNo comments yet. Be the first to start a discussion!
Leave a Comment