Abstract
Microglial calcium signaling underlies a number of key physiological and pathological processes in situ, but has not been studied in vivo in awake mice. Using multiple GCaMP6 variants targeted to microglia, we assessed how microglial calcium signaling responds to alterations in neuronal activity across a wide range. We find that only a small subset of microglial somata and processes exhibited spontaneous calcium transients in a chronic window preparation. However, hyperactive shifts in neuronal activity (kainate status epilepticus and CaMKIIa Gq DREADD activation) triggered increased microglial process calcium signaling, often concomitant with process extension. Additionally, hypoactive shifts in neuronal activity (isoflurane anesthesia and CaMKIIa Gi DREADD activation) also increased microglial process calcium signaling. Under hypoactive neuronal conditions, microglia also exhibited process extension and outgrowth with greater calcium signaling. Our work reveals that microglia have highly distinct microdomain signaling, and that processes specifically respond to bi-directional shifts in neuronal activity through increased calcium signaling.
🔬 Techniques
🧬 Organisms
💻 Software
✨ Fluorophores
🧪 Sample Preparation
🔬 Cell Lines
🏭 Microscope Brands
🧪 Reagent Suppliers
🔴 Lasers
🎨 Filters
💻 Software Details
💾 Data Repositories
🏷️ Research Resource Identifiers (RRIDs)
Verified research resources used in this paper:
🏛️ Research Organizations (ROR)
Affiliated research institutions:
📋 Methods
Key resources table
Reagent type (species) or resource Designation Source or reference Identifiers Additional information Strain, strain background ( M. musculus ; male and female) C57BL/6J Jackson labs #016962 Strain, strain background ( M. musculus ; male and female) CX3CR1 CreER-IRES-eYFP Jackson labs #021160 Strain, strain background ( M. musculus ; male and female) GCaMP6s (cytosolic) Jackson labs #024106 Strain, strain background ( M. musculus ; male and female) Lck-GCaMP6f Jackson labs #029626 Transfected construct ( M. musculus ) pENN.AAV.CaMKII.GCaMP6f.WPRE.SV40 Addgene Cat #: 105537-AAV9; RRID: Addgene_100834 Transfected construct ( M. musculus ) pAAV.CaMKIIa.hM3D(Gq)-mCherry Addgene Cat #: 50476-AAV5; RRID: Addgene_50476 Transfected construct ( M. musculus ) pAAV.CaMKIIa.hM4D(Gi)-mCherry Addgene Cat #: 50477-AAV5; RRID: Addgene_50477 Chemical compound, drug Clozapine N-Oxide Cayman Cat #: 16882 Chemical compound, drug Isoflurane Terrell Cat #: 66794-019-10 Chemical compound, drug Kainic acid Tocris Cat #: 0222 Chemical compound, drug Tamoxifen chow Envigo Cat #: TD.130856 Software, algorithm Excel Microsoft Software, algorithm ImageJ NIH Java 1.8.0_172 Software, algorithm Prism GraphPad Version 8 Other 5.2 mm Headplate Neurotar Model 2 Other Closed-loop temperature controller Physitemp TCAT-2DF Used during isoflurane imaging Other VivoScope Galvo Multiphoton Scientifica Other Mai-Tai DeepSee Spectra-Physics MAI TAI HP DS 2-P laser Other Mobile HomeCage Neurotar Cat #: NTR000289-01 Air table for in vivo imaging Other UMP3 Ultra Micro Pump WPI Cat #: UMP3-4 Used in AAV delivery Mice GCaMP6s (Rosa26-CAG-LSL-GCaMP6s; 024106), Lck-GCaMP6f (Rosa26-CAG-LSL-Lck-GCaMP6f; 029626), and CX3CR1 CreER-eYFP (021160) knock-in mouse lines can be obtained from the Jackson Laboratory. Neuronal calcium activity was studied in C57BL/6J WT mice using AAV injections. Both male and female offspring were used across all studies at an age ranging from 3 to 5 months. Mice were group housed in an AAALAC-approved facility in climate-controlled rooms with a 12 hr light/dark cycle (lights on at 6am) and had free access to food and water. All experimental procedures were approved by the Mayo Clinic’s Institutional Animal Care and Use Committee (IACUC). Administration of tamoxifen in chow In CreER lines, tamoxifen was administered through chow to activate GCaMP expression in microglia. Mice were weaned at P21 and then provided tamoxifen in chow for a two-week period (250 mg tamoxifen per 1 kg of chow; Envigo). Notably, chronic window studies occurred no sooner than 4 weeks after tamoxifen administration ended, which is sufficient to label microglia but not peripheral CX3CR1 cell types due to differences in their turnover rates ( Parkhurst et al., 2013 ).
Show full methods section
Key resources table
Reagent type (species) or resource Designation Source or reference Identifiers Additional information Strain, strain background ( M. musculus ; male and female) C57BL/6J Jackson labs #016962 Strain, strain background ( M. musculus ; male and female) CX3CR1 CreER-IRES-eYFP Jackson labs #021160 Strain, strain background ( M. musculus ; male and female) GCaMP6s (cytosolic) Jackson labs #024106 Strain, strain background ( M. musculus ; male and female) Lck-GCaMP6f Jackson labs #029626 Transfected construct ( M. musculus ) pENN.AAV.CaMKII.GCaMP6f.WPRE.SV40 Addgene Cat #: 105537-AAV9; RRID: Addgene_100834 Transfected construct ( M. musculus ) pAAV.CaMKIIa.hM3D(Gq)-mCherry Addgene Cat #: 50476-AAV5; RRID: Addgene_50476 Transfected construct ( M. musculus ) pAAV.CaMKIIa.hM4D(Gi)-mCherry Addgene Cat #: 50477-AAV5; RRID: Addgene_50477 Chemical compound, drug Clozapine N-Oxide Cayman Cat #: 16882 Chemical compound, drug Isoflurane Terrell Cat #: 66794-019-10 Chemical compound, drug Kainic acid Tocris Cat #: 0222 Chemical compound, drug Tamoxifen chow Envigo Cat #: TD.130856 Software, algorithm Excel Microsoft Software, algorithm ImageJ NIH Java 1.8.0_172 Software, algorithm Prism GraphPad Version 8 Other 5.2 mm Headplate Neurotar Model 2 Other Closed-loop temperature controller Physitemp TCAT-2DF Used during isoflurane imaging Other VivoScope Galvo Multiphoton Scientifica Other Mai-Tai DeepSee Spectra-Physics MAI TAI HP DS 2-P laser Other Mobile HomeCage Neurotar Cat #: NTR000289-01 Air table for in vivo imaging Other UMP3 Ultra Micro Pump WPI Cat #: UMP3-4 Used in AAV delivery Mice GCaMP6s (Rosa26-CAG-LSL-GCaMP6s; 024106), Lck-GCaMP6f (Rosa26-CAG-LSL-Lck-GCaMP6f; 029626), and CX3CR1 CreER-eYFP (021160) knock-in mouse lines can be obtained from the Jackson Laboratory. Neuronal calcium activity was studied in C57BL/6J WT mice using AAV injections. Both male and female offspring were used across all studies at an age ranging from 3 to 5 months. Mice were group housed in an AAALAC-approved facility in climate-controlled rooms with a 12 hr light/dark cycle (lights on at 6am) and had free access to food and water. All experimental procedures were approved by the Mayo Clinic’s Institutional Animal Care and Use Committee (IACUC). Administration of tamoxifen in chow In CreER lines, tamoxifen was administered through chow to activate GCaMP expression in microglia. Mice were weaned at P21 and then provided tamoxifen in chow for a two-week period (250 mg tamoxifen per 1 kg of chow; Envigo). Notably, chronic window studies occurred no sooner than 4 weeks after tamoxifen administration ended, which is sufficient to label microglia but not peripheral CX3CR1 cell types due to differences in their turnover rates ( Parkhurst et al., 2013 ).
Stereotaxic delivery of AAV
Under isoflurane anesthesia (4% induction, 1.5–2.5% maintenance), AAVs were injected into the somatosensory cortex (AP: −4.5, ML: +2.0) using a glass pipette and micropump (World Precision Instruments). AAVs were targeted to both layer V neurons (DV: −0.5) and layer II/III neurons (DV: −0.2). A 250 nL volume was dispensed at each level at a 40 nL/min rate followed by a 10-min rest period for diffusion. pENN.AAV9.CaMKII.GCaMP6s.WPRE.SV40, AAV5.CaMKIIa.hM3D(Gq)-mCherry, and AAV5.CaMKIIa.hM4D(Gi)-mCherry were either injected alone (1:1 dilution in PBS) or in conjunction (1:1 ratio of DREADD and GCaMP virus). All viruses were used at a titer of 10 12 GC/mL and acquired from Addgene.
Cranial window surgery
Cranial windows were implanted following standard techniques. Under isoflurane anesthesia (4% induction, 1.5–2.5% maintenance), a circular craniotomy (9 µm 2 ). Second, each process was visually inspected in the T-series for extension, retraction, or stability. Finally, processes needed to display at least a 50% area enlargement to be considered an extension (e.g. 10 µm 2 to 15 µm 2 ) or 50% area decrease to be considered a retraction (e.g. 10 µm 2 to 5 µm 2 ). Stable processes had less than a 50% change in area in either direction. After confirmation, these ROIs were also used to generate ∆F/F calcium traces to determine signal area and associated calcium activity based on each motility characteristic ( Figures 3I , 5G , 6K and L ). A process was considered to be associated with calcium activity if it had a signal area of >5 ∆F/F∙s. To determine temporal correlations between process extension/retraction and calcium events ( Figure 5H ), processes were selected as previously described using a manual ROI. We determined the start and end time of an extension/retraction event by using the threshold tool to create a frame-by-frame assessment of process area. The start of extension was defined as the first frame in a series of frames where process area became sequentially larger, while the end of extension was defined by a plateau in process area. The start of retraction was defined as the first frame in a series in which the process area began to reduce, while the end of retraction was defined by a plateau at a minimum value. We determined the temporal relationship between this extension/retraction start time and calcium events by determining the closest calcium event before and after the start time (if present, see Figure 5—figure supplement 2 for examples). A calcium event needed to have a peak ∆F/F value of 0.5 to be considered, and only the nearest event before or after was considered. The latency between the peak of these calcium events relative to the start of extension/retraction was calculated for all extending/retracting processes in the Figure 5 analysis and then binned by processes with an
📊 Figures
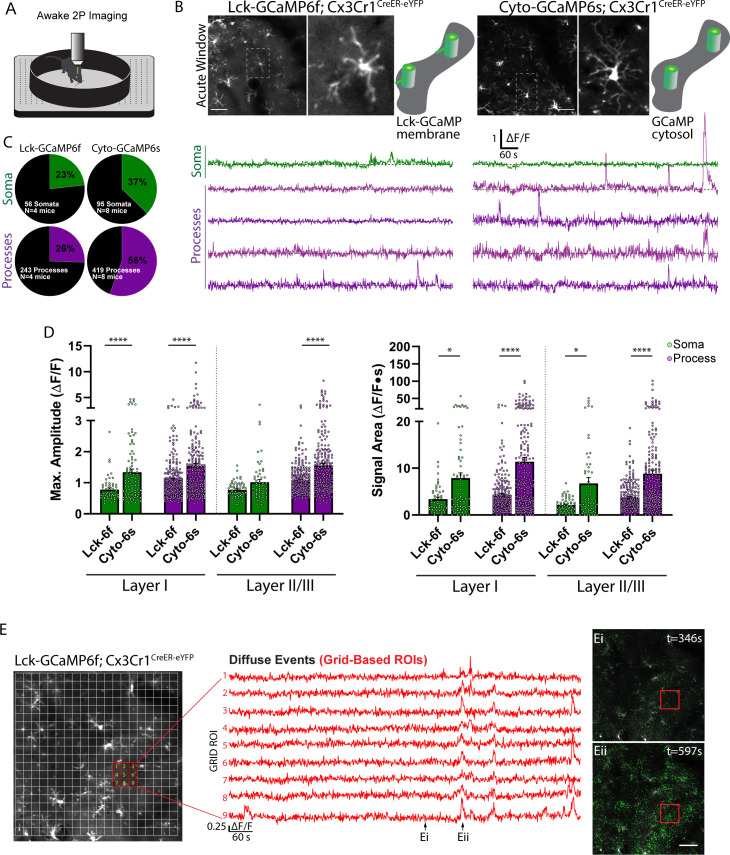
Figure 1.
Spontaneous microglial calcium activity reported in the Lck-GCaMP6f and cytosolic GCaMP6s mouse.
( A ) Imaging setup: in vivo two-photon imaging of microglial calcium activity in the awake, head-restrained animal.u00a0( B ) Average intensity projection images and microglial u2206F/F calcium trace...
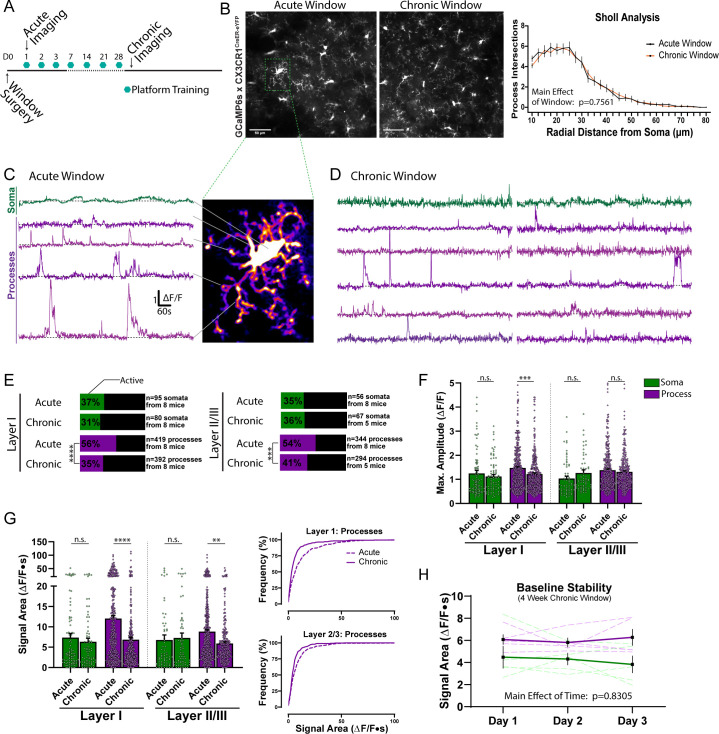
Figure 2.
Spontaneous microglial calcium activity differs between acute and chronic window preparations.
( A ) Timeline of acute and chronic window imaging and animal training. ( B ) eYFP average intensity images of microglia morphology in acute and chronic window preparations. Sholl analysis of microgli...
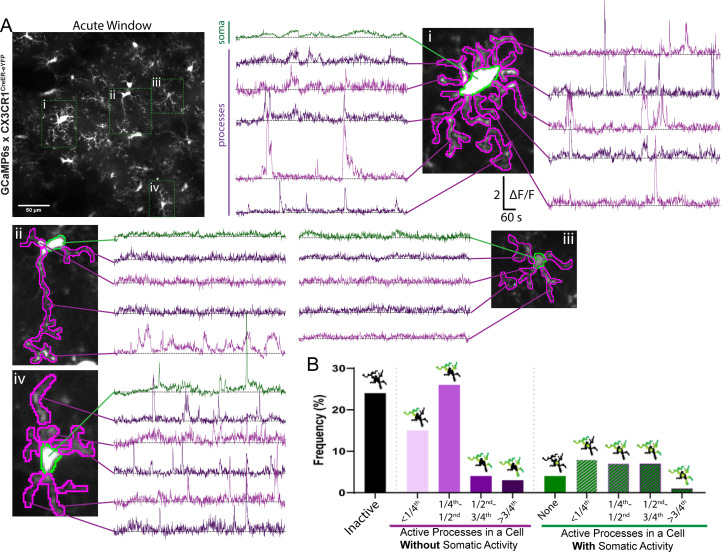
Figure 2u2014figure supplement 1.
Variability in spontaneous microglial calcium activity in acute window preparations.
( A ) A full field of view in an acute window animal with four outlined cells (i-iv, from Figure 2B ). Each outlined cell (iu2013iv) is shown with higher magnification and representative examples of h...
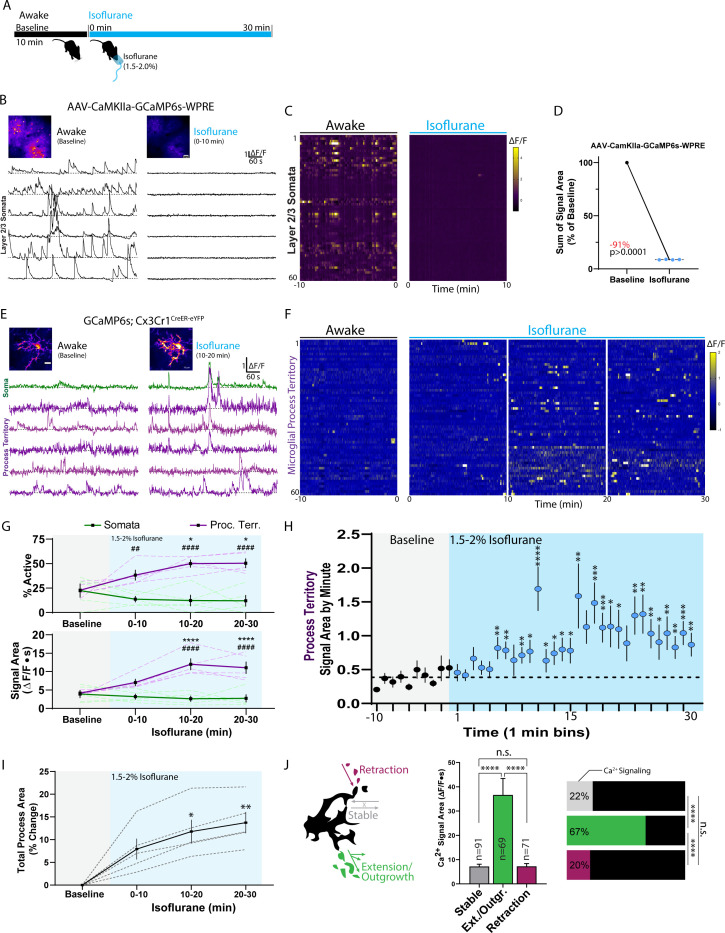
Figure 3.
Isoflurane anesthesia increases microglial calcium activity.
( A ) Timeline of experiment in a chronic window animal. ( Bu2013D ) Control studies of excitatory neuronal calcium activity before and after isoflurane induction. ( B ) Representative u2206F/F traces...
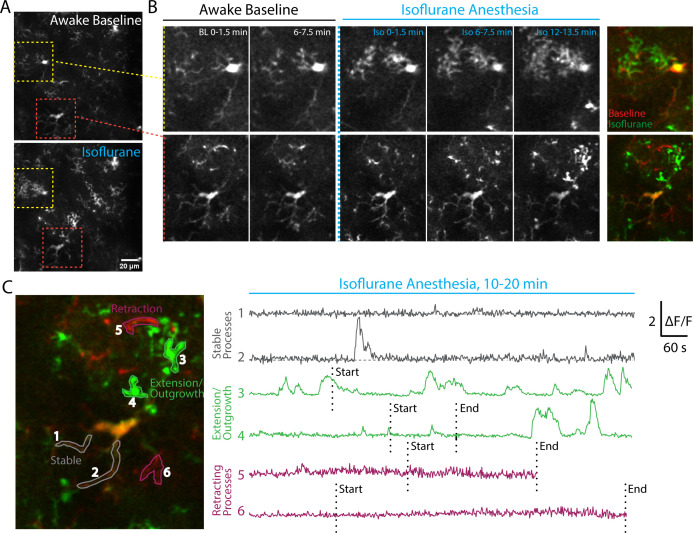
Figure 3u2014figure supplement 1.
Isoflurane anesthesia results in process extension/outgrowth with high calcium activity.
( A ) A field of view with multiple microglia under awake baseline and isoflurane conditions.u00a0( B ) Higheru00a0magnification changes in microglial morphology for two representative cells from ( A ...
Figure 3u2014video 1.
Microglial calcium changes in the awake mouse and during 30 min isoflurane administration.
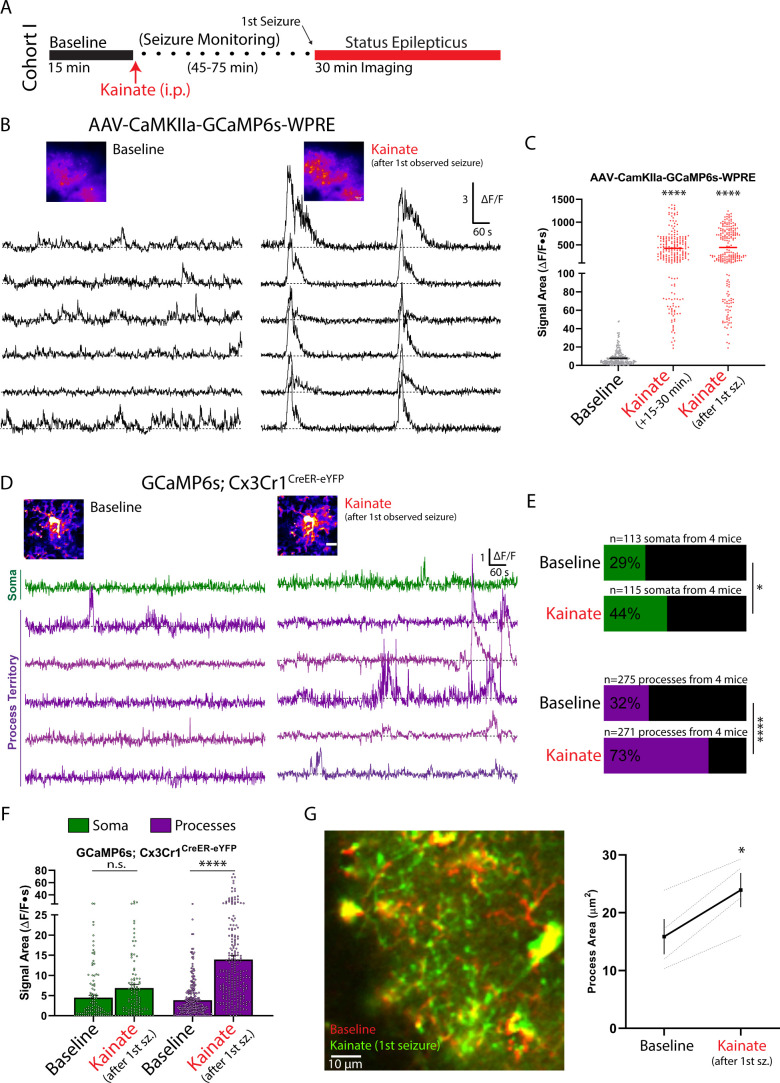
Figure 4.
Increased microglial process calcium activity immediately following the observation of kainate-induced seizures.
( A ) Outline of the experimental timeline. Mice experienced a first seizure 45u201375 min after kainate injection, which marked the beginning of imaging during periods labelled as u2018kainate.u2019 ...
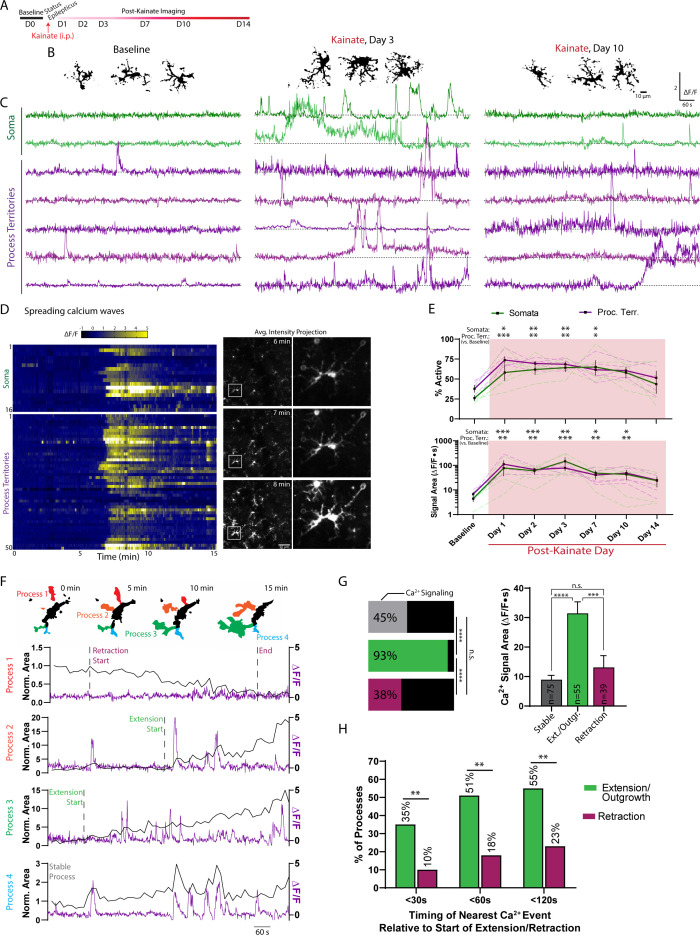
Figure 5.
Kainate administration leads to longitudinal modulation of microglial calcium signaling.
( A ) Timeline of experiment. ( B ) Representative images of microglia morphology at baseline and following kainate status epilepticus. See also: Figure 5u2014figure supplement 1 . ( C ) u2206F/F trac...
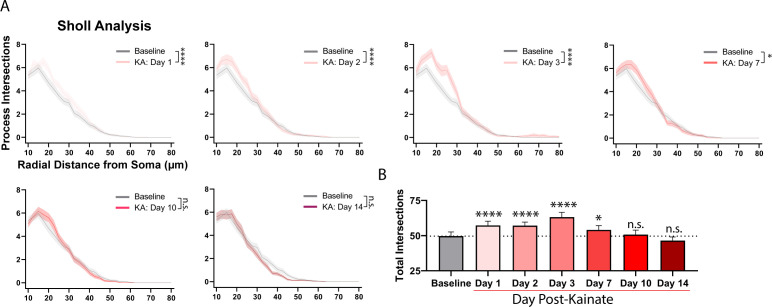
Figure 5u2014figure supplement 1.
Full Sholl analysis quantification of morphology changes, related to panel 5B.
( A ) Sholl analysis profiles of microglial morphology 1, 2, 3, 7, 10, and 14 days following kainate status epilepticus plotted against the baseline period (two-way ANOVA). ( B ) Summary of longitudin...
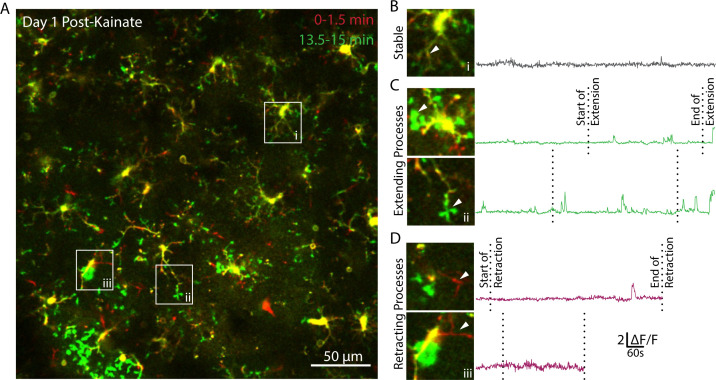
Figure 5u2014figure supplement 2.
One day after kainate status epilepticus, process extension is closely coordinated with microglial calcium activity.
( A ) A field of view showing microglial dynamics 1 day after kainate status epilepticus (red: beginning of video; green: end of video).u00a0( Bu2013D ) Example images of ( B ) a stable process, ( C )...
Figure 5u2014video 1.
Spreading microglial calcium waves recorded 1 day after kainate status epilepticus.
Figure 5u2014video 2.
Microglial process extension co-occurring with increased calcium activity.
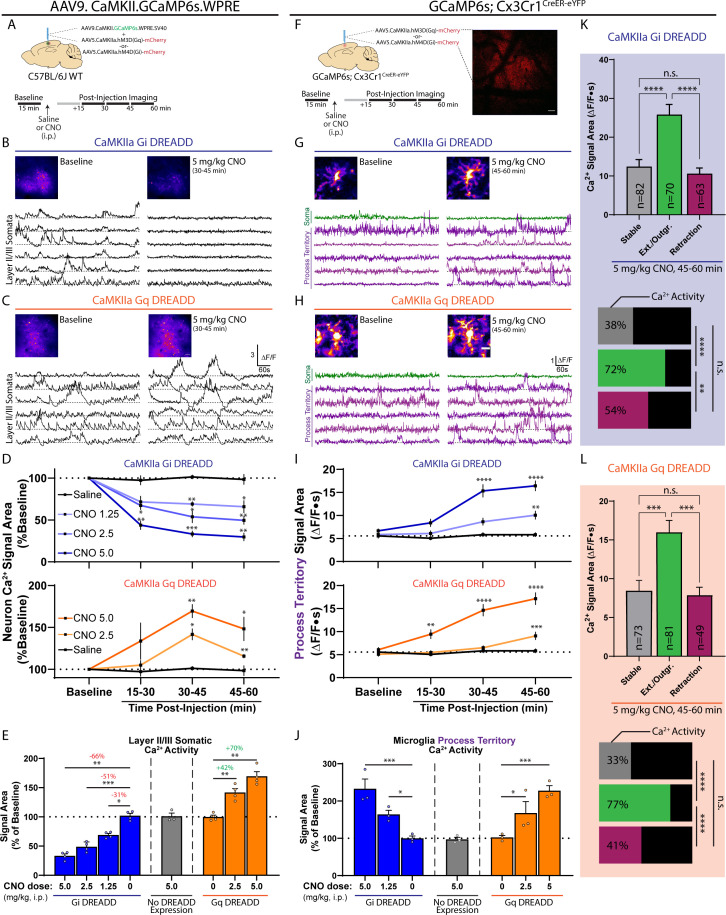
Figure 6.
DREADD-based modulation of excitatory neuronal activity is sufficient to induce microglial calcium signaling.
( A ) AAVs injected into the somatosensory cortex of WT mice in order to study DREADD-based changes in neuronal calcium activity (top). Experiment outline (bottom). ( Bu2013C ) Representative u2206F/F...
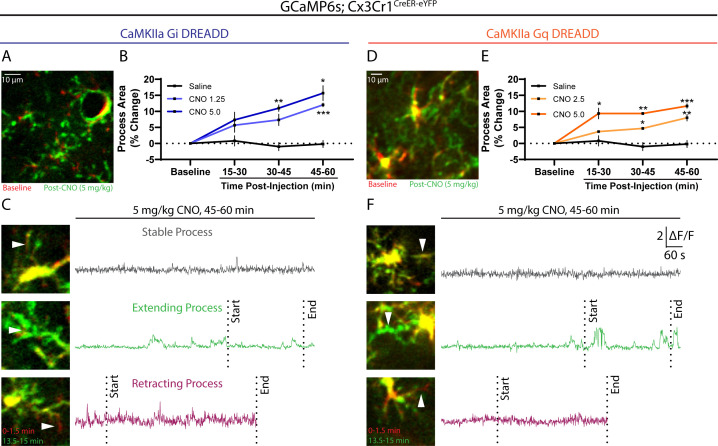
Figure 6u2014figure supplement 1.
CaMKIIa Gi and Gq activation results in microglial process extension and coordinated process calcium activity.
( A ) A field of view with multiple microglia under awake baseline (red) and 45-60 min following Gi DREADD activation (green).u00a0( B )u00a0Quantification of the microglial process area across imagin...
Figure 6u2014video 1.
Microglial calcium activity at baseline and following CNO administration in Gi and Gq systems.
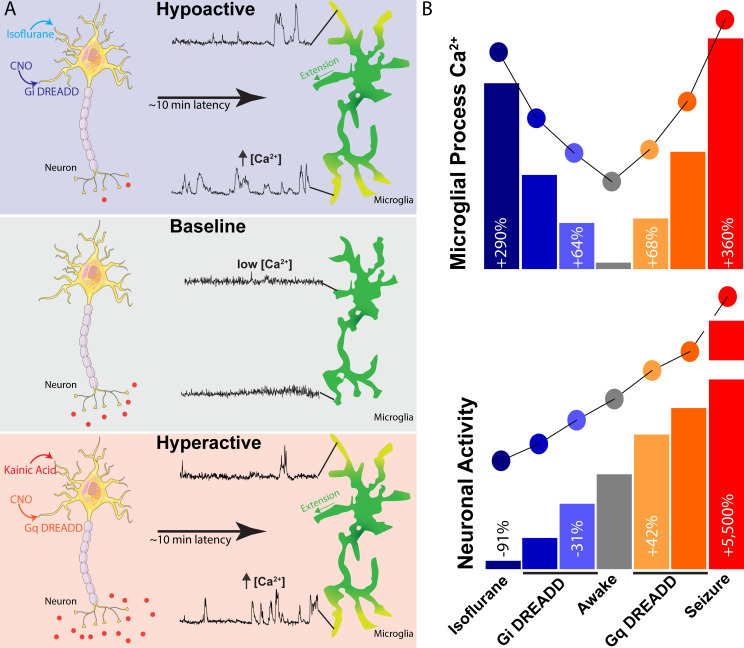
Figure 7.
Summary of findings and observed relationship between neuronal activity and microglial calcium signaling.
( A ) During u2018baselineu2019 levels of neuronal activity in the awake mouse (middle panel), microglia demonstrate the lowest level of process calcium activity. However, shifts towards neuronal hypo...
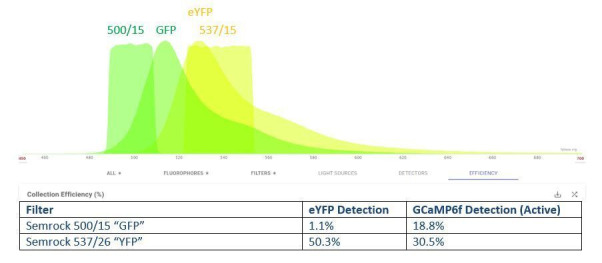
Author response image 1.
Estimated collection efficiency of GCaMP6 and eYFP with a u201cGFP/YFPu201d filter set.
Our initial approach to split these close spectra resulted in stronger GCaMP fluorescence in the YFP channel than the GFP channel and resulted in significant signal attenuation. Note that GCaMP6s was ...
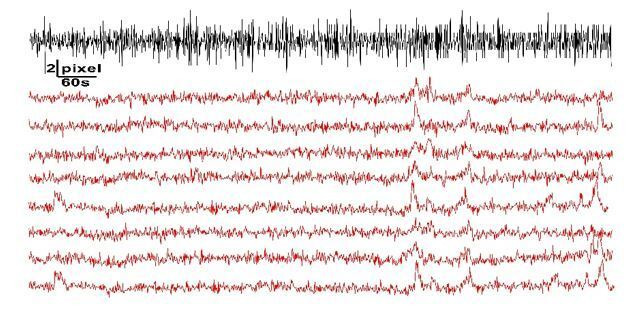
Author response image 2.
Exploring movements and potential erroneous calcium detection.
Adapted from Figure 1E, we do not see that frame-by-frame shifts (black line, pixel displacement detected by registration plugin) correlates with increases in calcium activity.
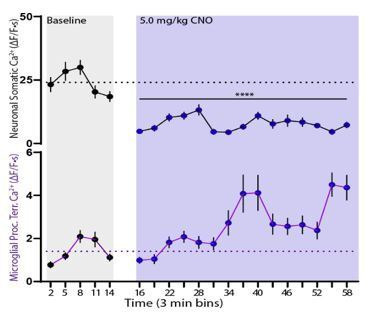
Author response image 3.
Minute-by-Minute relationship between microglial calcium activity and neuronal activity changes.
An example of breaking down neuronal calcium activity (top) into 3 min bins correlated with changes in microglial calcium activity. Neuronal calcium changes are significant as soon as 15 min after inj...
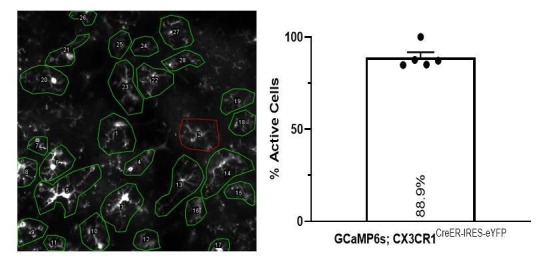
Author response image 4.
Longitudinal survey of active microglia in the kainate cohort.
(Left) The survey method was used to observe any clear calcium event within any part of a cell (green outline) or confirm no observable event in the 15-minute recording (red outline). This example ima...
Figure images are served from the NIH/NLM PubMed Central Open Access Subset or Europe PMC; copyright remains with the publishers and authors.
💬 Discussion
0 commentsNo comments yet. Be the first to start a discussion!
Leave a Comment