Abstract
The ABCG1 homodimer (G1) and ABCG5-ABCG8 heterodimer (G5G8), two members of the adenosine triphosphate (ATP)-binding cassette (ABC) transporter G family, are required for maintenance of cellular cholesterol levels. G5G8 mediates secretion of neutral sterols into bile and the gut lumen, whereas G1 transports cholesterol from macrophages to high-density lipoproteins (HDLs). The mechanisms used by G5G8 and G1 to recognize and export sterols remain unclear. Here, we report cryoelectron microscopy (cryo-EM) structures of human G5G8 in sterol-bound and human G1 in cholesterol- and ATP-bound states. Both transporters have a sterol-binding site that is accessible from the cytosolic leaflet. A second site is present midway through the transmembrane domains of G5G8. The Walker A motif of G8 adopts a unique conformation that accounts for the marked asymmetry in ATPase activities between the two nucleotide-binding sites of G5G8. These structures, along with functional validation studies, provide a mechanistic framework for understanding cholesterol efflux via ABC transporters.
🔬 Techniques
🧪 Sample Preparation
🔬 Cell Lines
🏭 Microscope Brands
🧪 Reagent Suppliers
💻 Software Details
🏛️ Research Organizations (ROR)
Affiliated research institutions:
📋 Methods
Generation of Anti-Human G5G8 Antibody. Immunoglobulin G (IgG)-2C7, a mouse monoclonal anti-human G5G8 antibody, was prepared by fusion of SP2-mIL6 mouse myeloma cells with splenic B lymphocytes obtained from BALB/c mice ( n = 2). Mice were immunized with one primary and eight boosts of purified recombinant human G5G8 heterodimers (50 μg) in 10 mM Hepes (pH 7.5), 100 mM NaCl, 0.1% n-dodecyl-β-D-maltopyranoside (DDM), 0.05% cholate, and 0.1 mM tris(2-carboxyethyl)phosphine (TCEP) combined with the Sigma Adjuvant System. Hybridoma culture supernatants were screened by enzyme-linked immunosorbent assay (ELISA) and counterscreened by dot blot to select ELISA-positive, dot blot–negative clones. One such hybridoma, designated IgG-2C7 (subclass 1, k), was subcloned by serial dilution three times and purified from hybridoma culture supernatant by gravity-flow affinity chromatography on protein G Sepharose 4 Fast Flow columns. Protein Expression and Purification. The complementary DNA (cDNA) of human ABCG1 (GenBank accession no. BC029158.1 ) was cloned into pFastBac with an N-terminal Flag tag. The G1 WT protein was expressed using baculovirus-mediated transduction of Sf9 insect cells (ATCC). At 48 h post infection, the cells were disrupted by sonication in buffer A, containing 20 mM Hepes (pH 7.5), 150 mM NaCl, with 1 mM phenylmethanesulfonylfluoride and 5 μg/mL leupeptin. After low-speed centrifugation, the resulting supernatant was incubated in buffer B with 1% (weight/volume; wt/vol) lauryl maltose neopentyl glycol (LMNG; Anatrace) for 1 h at 4 °C. The lysate was centrifuged at 18,000 rpm for 30 min, and the supernatant was loaded onto a Flag-M2 affinity column (Sigma-Aldrich). After washing three times, the protein was eluted in 20 mM Hepes (pH 7.5), 150 mM NaCl, 100 μg/mL 3×Flag peptide, and 0.01% LMNG and concentrated. The concentrated protein was purified by a Superose 6 Increase size-exclusion chromatography column (GE Healthcare) in a buffer containing buffer A and 0.06% (wt/vol) digitonin (ACROS Organics). The cDNA of the E242Q mutant was generated using the primers 5′-AGTCATGTTCTTCGATCAGCCCACCAGCGGCCT-3′ and 5′-AGGCCGCTGGTGGGCTGATCGAAGAACATGACT-3′ and cloned into pEG BacMam with an N-terminal Flag tag. The protein was expressed using baculovirus-mediated transduction of mammalian HEK-293S GnTI − cells (ATCC). The cells were harvested at 48 h post infection and the protein was purified the same as G1 WT . The cloning and expression of recombinant human G5G8 in P. pastoris were performed as described previously ( 23 ). The expression of human G5G8 in mammalian HEK-293S cells was performed by cloning the cDNAs for human ABCG5 (National Center for Biotechnology Information [NCBI] accession no. NM_022436 ) and ABCG8 (NCBI accession no. NM_022437 ) into separate pEG BacMam, respectively, and they were coexpressed using baculovirus-mediated transduction of mammalian HEK-293S GnTI − cells (ATCC). A tandem tag of six histidines separated by glycine (His 6 GlyHis 6 ) was added to the C terminus of G5, and a tag encoding a rhinovirus 3C protease site followed by a calmodulin-binding peptide was added to the C terminus of G8, for purification purposes. At 72 h post infection, the cells were collected by centrifugation and the recombinant protein was solubilized and purified as previously described ( 23 ). The expressed human G5G8 was purified as described ( 23 ) except that cholesteryl hemisuccinate Tris was not added to any buffer, and one more purification step was added using Superdex 200 Increase 10/300 GL for gel filtration with a buffer containing 20 mM Hepes (pH 7.5), 150 mM NaCl, 2 mM MgCl 2 , 2 mM ATP, and 0.06% (wt/vol) digitonin (Calbiochem). ATPase Assays. The ATPase activity of purified G5G8 was determined as described ( 23 , 45 ). Briefly, 4 to 10 µg proteins was mixed with 100 µg liver polar lipids (Avanti), 5 mM dithiothreitol (DTT), and 1% sodium cholate for 10 min at room temperature. Reactions were carried out in a final volume of 100 μL containing 50 mM Tris⋅HCl (pH 7.5), 60 mM NaCl, 30 mM KCl, 2.5 mM MgCl 2 , and 2.5 mM γ-[ 32 P]ATP at 37 °C for 30 min. Released inorganic [ 32 P]phosphate was extracted by molybdate and the radioactivity was measured to calculate its specific activity in three independent experiments. The ATPase activity of G1 was measured using an NADH consumption-coupled method ( 46 , 47 ). The assay was performed at 37 °C in a 96-well plate with a total reaction volume of 100 μL. Absorbance at 340 nm was monitored to measure the concentration of NADH which was coupled to that of ATP. The final reaction included 0.3 to 0.5 μM G1, 0.2 mM NADH, 4 mM phosphoenolpyruvate, 60 μg/mL pyruvate kinase, 33 μg/mL lactate dehydrogenase, 1 mM DTT, 2 mM MgCl 2 , 0.06% digitonin, 150 mM NaCl, and 20 mM Hepes (pH 7.5). For the ATP titration assay ( Fig. 4 A ), 0.5 to 20 mM ATP was included in the final reaction, with the presence of 0.25 mM cholesterol and 0.25 mM epi-cholesterol or an equal volume of ethanol. For measuring the effect of cholesterol ATPase activity ( Fig. 5 C ), 8 mM ATP and 0.5 μM G1 protein were supplemented across all reactions. Due to its instability, NADH was dissolved and added right before the start of the reaction. The plate and reaction stock solution were prewarmed before the different reacting components were mixed. The absorbance was measured every 20 s for 60 min using a BioTek Synergy Neo plate reader. The V max of absorbance change (min −1 ) was calculated by the built-in software using 20 to 30 points in the linear region, which was converted to the rate of ATP hydrolysis (nmol ATP⋅min −1 ⋅mg protein −1 ) by dividing the product of the extinction coefficient of NADH, the length of the light path, and the concentration of G1. An identical reaction containing buffer instead of G1 protein was measured in the same plate and was deducted from the corresponding experimental group. In Vivo Functional Reconstitution Cholesterol Transport Assay. Point mutations were introduced into the human G5 and G8 cDNAs using the QuikChange II Site-Directed Mutagenesis Kit (Agilent). The recombinant adenoviruses expressing human WT or mutant were generated using the AdenoVator Adenoviral Vector System (QBioGene). Eight- to 12-wk-old total knockout ( G5 −/− G8 −/− ) mice were maintained on a regular chow diet ( 48 ). Adenoviral particles (5 × 10 12 particles per kilogram), containing no external gene (RR5) or WT or mutant human G5G8, were injected into the tail veins of the mice. After 72 h, the mice were fasted for 4 h, anesthetized with halothane, and killed by exsanguination. Bile was collected, and neutral sterol levels were measured using gas liquid chromatography and mass spectrometry as described ( 23 ). Liver tissue was snap-frozen in liquid nitrogen and stored at −80 °C. All animal experiments described in this manuscript were approved and conducted under oversight of the UT Southwestern Institutional Animal Care and Use Committee.
Show full methods section
Generation of Anti-Human G5G8 Antibody. Immunoglobulin G (IgG)-2C7, a mouse monoclonal anti-human G5G8 antibody, was prepared by fusion of SP2-mIL6 mouse myeloma cells with splenic B lymphocytes obtained from BALB/c mice ( n = 2). Mice were immunized with one primary and eight boosts of purified recombinant human G5G8 heterodimers (50 μg) in 10 mM Hepes (pH 7.5), 100 mM NaCl, 0.1% n-dodecyl-β-D-maltopyranoside (DDM), 0.05% cholate, and 0.1 mM tris(2-carboxyethyl)phosphine (TCEP) combined with the Sigma Adjuvant System. Hybridoma culture supernatants were screened by enzyme-linked immunosorbent assay (ELISA) and counterscreened by dot blot to select ELISA-positive, dot blot–negative clones. One such hybridoma, designated IgG-2C7 (subclass 1, k), was subcloned by serial dilution three times and purified from hybridoma culture supernatant by gravity-flow affinity chromatography on protein G Sepharose 4 Fast Flow columns. Protein Expression and Purification. The complementary DNA (cDNA) of human ABCG1 (GenBank accession no. BC029158.1 ) was cloned into pFastBac with an N-terminal Flag tag. The G1 WT protein was expressed using baculovirus-mediated transduction of Sf9 insect cells (ATCC). At 48 h post infection, the cells were disrupted by sonication in buffer A, containing 20 mM Hepes (pH 7.5), 150 mM NaCl, with 1 mM phenylmethanesulfonylfluoride and 5 μg/mL leupeptin. After low-speed centrifugation, the resulting supernatant was incubated in buffer B with 1% (weight/volume; wt/vol) lauryl maltose neopentyl glycol (LMNG; Anatrace) for 1 h at 4 °C. The lysate was centrifuged at 18,000 rpm for 30 min, and the supernatant was loaded onto a Flag-M2 affinity column (Sigma-Aldrich). After washing three times, the protein was eluted in 20 mM Hepes (pH 7.5), 150 mM NaCl, 100 μg/mL 3×Flag peptide, and 0.01% LMNG and concentrated. The concentrated protein was purified by a Superose 6 Increase size-exclusion chromatography column (GE Healthcare) in a buffer containing buffer A and 0.06% (wt/vol) digitonin (ACROS Organics). The cDNA of the E242Q mutant was generated using the primers 5′-AGTCATGTTCTTCGATCAGCCCACCAGCGGCCT-3′ and 5′-AGGCCGCTGGTGGGCTGATCGAAGAACATGACT-3′ and cloned into pEG BacMam with an N-terminal Flag tag. The protein was expressed using baculovirus-mediated transduction of mammalian HEK-293S GnTI − cells (ATCC). The cells were harvested at 48 h post infection and the protein was purified the same as G1 WT . The cloning and expression of recombinant human G5G8 in P. pastoris were performed as described previously ( 23 ). The expression of human G5G8 in mammalian HEK-293S cells was performed by cloning the cDNAs for human ABCG5 (National Center for Biotechnology Information [NCBI] accession no. NM_022436 ) and ABCG8 (NCBI accession no. NM_022437 ) into separate pEG BacMam, respectively, and they were coexpressed using baculovirus-mediated transduction of mammalian HEK-293S GnTI − cells (ATCC). A tandem tag of six histidines separated by glycine (His 6 GlyHis 6 ) was added to the C terminus of G5, and a tag encoding a rhinovirus 3C protease site followed by a calmodulin-binding peptide was added to the C terminus of G8, for purification purposes. At 72 h post infection, the cells were collected by centrifugation and the recombinant protein was solubilized and purified as previously described ( 23 ). The expressed human G5G8 was purified as described ( 23 ) except that cholesteryl hemisuccinate Tris was not added to any buffer, and one more purification step was added using Superdex 200 Increase 10/300 GL for gel filtration with a buffer containing 20 mM Hepes (pH 7.5), 150 mM NaCl, 2 mM MgCl 2 , 2 mM ATP, and 0.06% (wt/vol) digitonin (Calbiochem). ATPase Assays. The ATPase activity of purified G5G8 was determined as described ( 23 , 45 ). Briefly, 4 to 10 µg proteins was mixed with 100 µg liver polar lipids (Avanti), 5 mM dithiothreitol (DTT), and 1% sodium cholate for 10 min at room temperature. Reactions were carried out in a final volume of 100 μL containing 50 mM Tris⋅HCl (pH 7.5), 60 mM NaCl, 30 mM KCl, 2.5 mM MgCl 2 , and 2.5 mM γ-[ 32 P]ATP at 37 °C for 30 min. Released inorganic [ 32 P]phosphate was extracted by molybdate and the radioactivity was measured to calculate its specific activity in three independent experiments. The ATPase activity of G1 was measured using an NADH consumption-coupled method ( 46 , 47 ). The assay was performed at 37 °C in a 96-well plate with a total reaction volume of 100 μL. Absorbance at 340 nm was monitored to measure the concentration of NADH which was coupled to that of ATP. The final reaction included 0.3 to 0.5 μM G1, 0.2 mM NADH, 4 mM phosphoenolpyruvate, 60 μg/mL pyruvate kinase, 33 μg/mL lactate dehydrogenase, 1 mM DTT, 2 mM MgCl 2 , 0.06% digitonin, 150 mM NaCl, and 20 mM Hepes (pH 7.5). For the ATP titration assay ( Fig. 4 A ), 0.5 to 20 mM ATP was included in the final reaction, with the presence of 0.25 mM cholesterol and 0.25 mM epi-cholesterol or an equal volume of ethanol. For measuring the effect of cholesterol ATPase activity ( Fig. 5 C ), 8 mM ATP and 0.5 μM G1 protein were supplemented across all reactions. Due to its instability, NADH was dissolved and added right before the start of the reaction. The plate and reaction stock solution were prewarmed before the different reacting components were mixed. The absorbance was measured every 20 s for 60 min using a BioTek Synergy Neo plate reader. The V max of absorbance change (min −1 ) was calculated by the built-in software using 20 to 30 points in the linear region, which was converted to the rate of ATP hydrolysis (nmol ATP⋅min −1 ⋅mg protein −1 ) by dividing the product of the extinction coefficient of NADH, the length of the light path, and the concentration of G1. An identical reaction containing buffer instead of G1 protein was measured in the same plate and was deducted from the corresponding experimental group. In Vivo Functional Reconstitution Cholesterol Transport Assay. Point mutations were introduced into the human G5 and G8 cDNAs using the QuikChange II Site-Directed Mutagenesis Kit (Agilent). The recombinant adenoviruses expressing human WT or mutant were generated using the AdenoVator Adenoviral Vector System (QBioGene). Eight- to 12-wk-old total knockout ( G5 −/− G8 −/− ) mice were maintained on a regular chow diet ( 48 ). Adenoviral particles (5 × 10 12 particles per kilogram), containing no external gene (RR5) or WT or mutant human G5G8, were injected into the tail veins of the mice. After 72 h, the mice were fasted for 4 h, anesthetized with halothane, and killed by exsanguination. Bile was collected, and neutral sterol levels were measured using gas liquid chromatography and mass spectrometry as described ( 23 ). Liver tissue was snap-frozen in liquid nitrogen and stored at −80 °C. All animal experiments described in this manuscript were approved and conducted under oversight of the UT Southwestern Institutional Animal Care and Use Committee.
Immunoblot Analysis of Expression of G5G8 in Mouse
Liver and G1 in CHO-K1 Cells. Mouse livers were cut into small pieces, washed with ice-cold buffer containing 0.2 M sucrose, 50 mM Tris-4-morpholineethanesulfonic acid (MES) (pH 7.0), and 0.1 M NaCl, and homogenized in a 3× volume of buffer. The homogenate was centrifuged at 1,500 × g for 10 min. The resulting postnuclear membrane was centrifuged at 100,000 rpm in a TLA100.4 rotor for 15 min at 4 °C. The pellets were resuspended in the same buffer and protein concentration was measured. For Western blot, 25 µg protein of pooled membranes for each group of samples was used for each lane.
Antibodies
(Abs) used were as follows: for human G5: monoclonal Ab 13H11, 10 µg/mL (made in-house); for human G8: monoclonal Ab 8E3, 10 µg/mL (made in-house); and for calnexin (CNX), polyclonal Ab (Enzo; ADI-SPA-860-F), 4,000× dilution. To detect expression of G1 in CHO-K1 cells, a total of 2.5 × 10 5 cells were resuspended in RIPA buffer. After a high-speed centrifugation, the supernatant was incubated with solubilization buffer (62 mM Tris⋅HCl, pH 6.9, 15% sodium dodecyl sulfate, 8 M urea, 10% glycerol, and 100 mM DTT, at a 1:1 volume ratio) at 37 °C for 30 min. After electrophoresis the proteins were transferred to nitrocellulose filters. The filters were incubated with anti-G1 rabbit polyclonal antibodies (1:500; Novus Biologicals; NB400-132) at 4 °C overnight, followed by horseradish peroxidase (HRP)–linked anti-rabbit IgG (1:5,000; Cell Signaling Technology) at room temperature for 30 min. HRP-conjugated β-actin antibody (1:5,000; Cell Signaling Technology) was used to visualize the proteins using a SuperSignal West Pico PLUS Chemiluminescent Substrate Kit (Thermo Fisher Scientific). Images were scanned and analyzed using an Odyssey Fc Imaging System (LI-COR Biosciences). Luciferase Reporter Assay. The cDNA of human ABCG1 was cloned into pcDNA3.1 without a tag. Cells were transfected using FuGENE HD (Promega) according to the manufacturer’s instructions. On day 0, CHO-K1 cells were maintained in medium A, a 1:1 mixture of Ham’s F-12 medium and Dulbecco’s modified Eagle’s medium (DMEM) containing 2.5 mM l -glutamine,100 U/mL penicillin, 100 μg/mL streptomycin sulfate, and 5% fetal calf serum (FCS) at a density of 8 × 10 4 cells per well on 24-well plates. On day 1, monolayers were replaced with medium A and each well was transfected with 100 ng pSynSRE (Addgene), plus 5 ng of each expression plasmid, and 50 ng pRL-TK (Promega) as a control to normalize for changes in transfection efficiency according to a previously published protocol ( 40 ). After 5 h, the culture medium was switched to medium A with 10% FCS. On day 3, after being cultured for 22 h, cells were washed with phosphate-buffered saline. Firefly and Renilla luciferase activities were measured using the Dual-Luciferase Reporter Assay System (Promega). The data analysis was performed using Prism 7 (GraphPad Software). Results are shown as mean ± SD from three biologically independent experiments. EM Imaging Processing, Three-Dimensional Refinement, and Molecular Dynamics Simulation. The details are in SI Appendix . Reproducibility. All animal experiments were repeated at least two times on different days. All cell biological and biochemical experiments were repeated at least three times on different days. Similar results were obtained.
📊 Figures
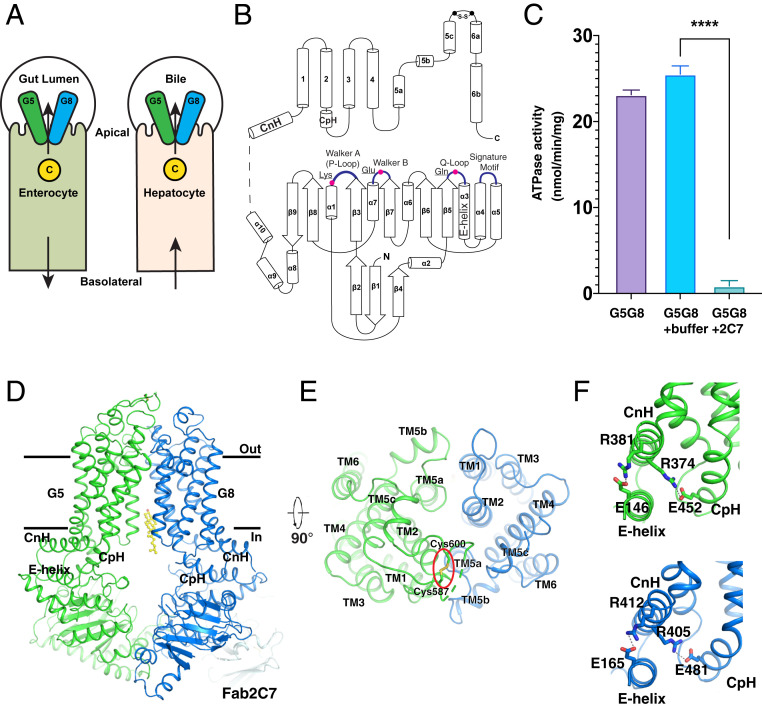
Fig. 1.
Overview of human G5G8 and the effect of Fab2C7 binding on ATPase activity. ( A ) Localization of G5G8 on apical (biliary) membrane of hepatocytes and enterocytes. The cellular cholesterol (C) is indi...
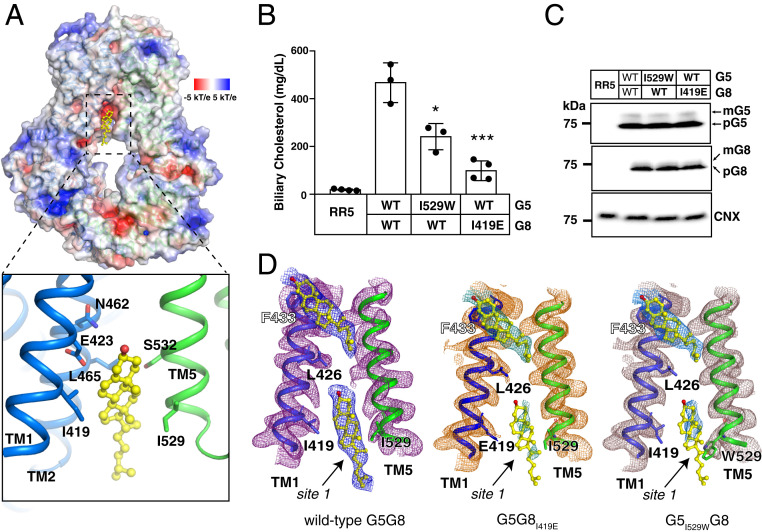
Fig. 2.
Overall structure of G5G8 reveals an inward-facing cholesterol-binding site. ( A ) Electrostatic surface representation of cholesterol-binding site 1 of G5G8 and the locations of interactions with cho...
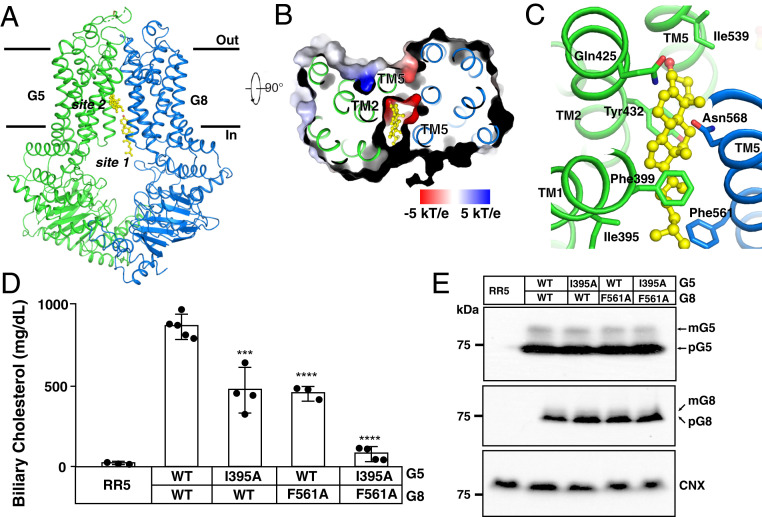
Fig. 3.
Cholesterol binding to a second site in G5G8. ( A ) Overall structure showing G5G8 bound to cholesterol (yellow sticks) viewed from the side of the membrane. ( B ) Electrostatic surface representation...
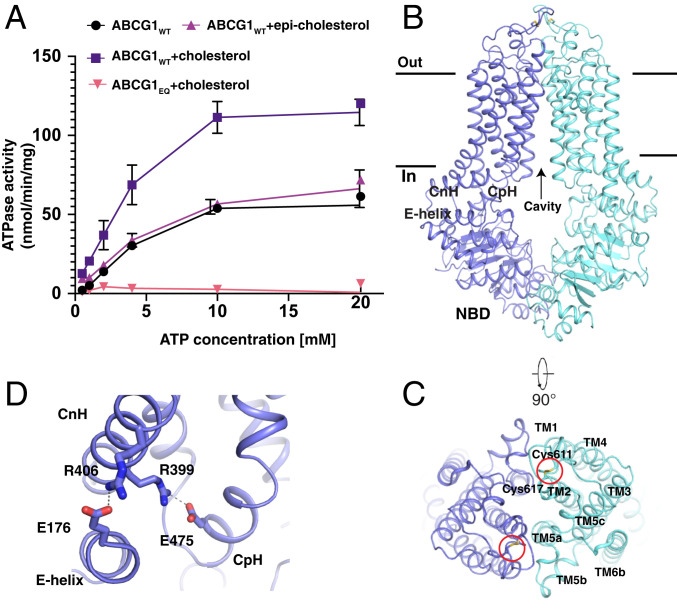
Fig. 4.
Overall structure of inward-facing G1 in the apo state. ( A ) Cholesterol stimulates the ATPase activity of G1 WT . By nonlinear regression of the Michaelisu2013Menten equation, G1 WT has a K m of 5.2...
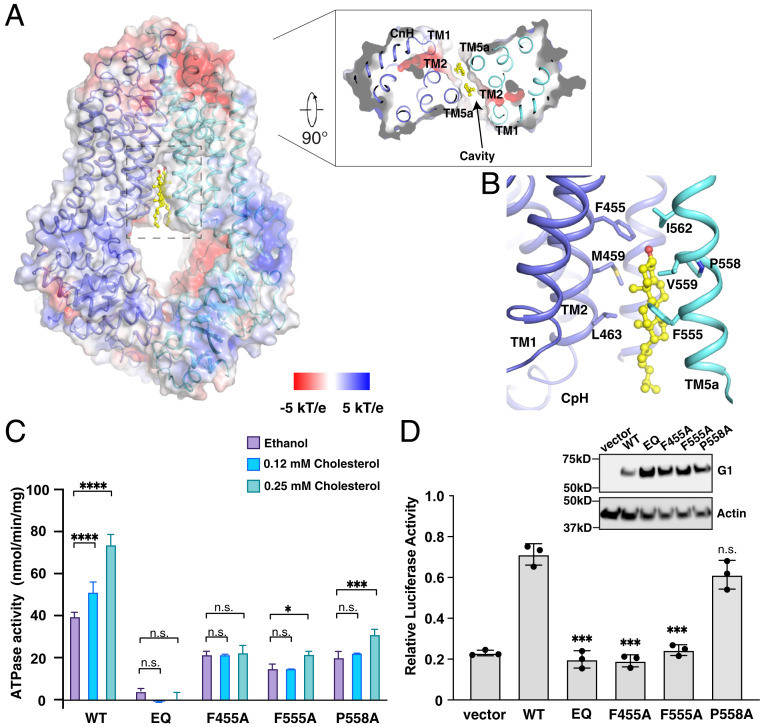
Fig. 5.
Overall structure of cholesterol-bound G1 EQ . ( A ) The electrostatic surface representation of the cholesterol-binding cavity from membrane and cytosol. The cholesterol is shown as yellow sticks. ( ...
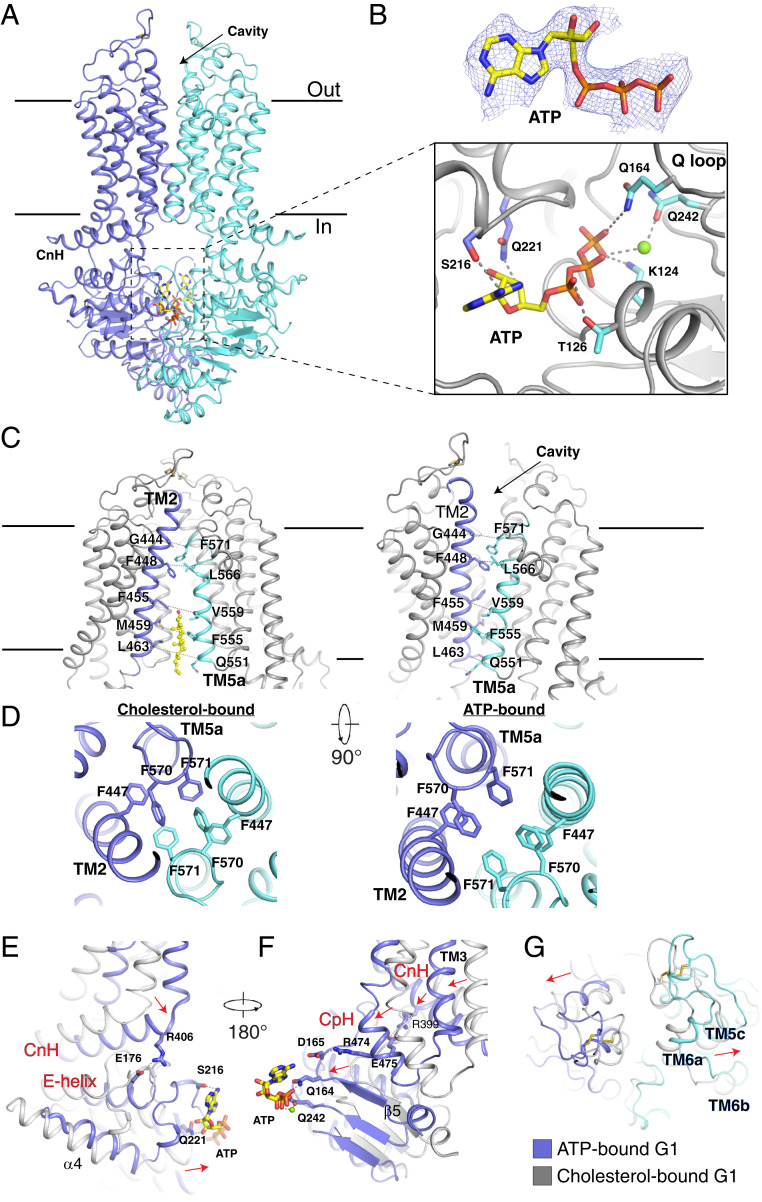
Fig. 6.
Overall structure of ATP-bound G1 EQ . ( A ) Overall structure of ATP-bound G1 EQ . The cryo-EM map of ATP is shown at 5u03c3 level. ( B ) The interaction details between ATP and G1 EQ . The residues ...
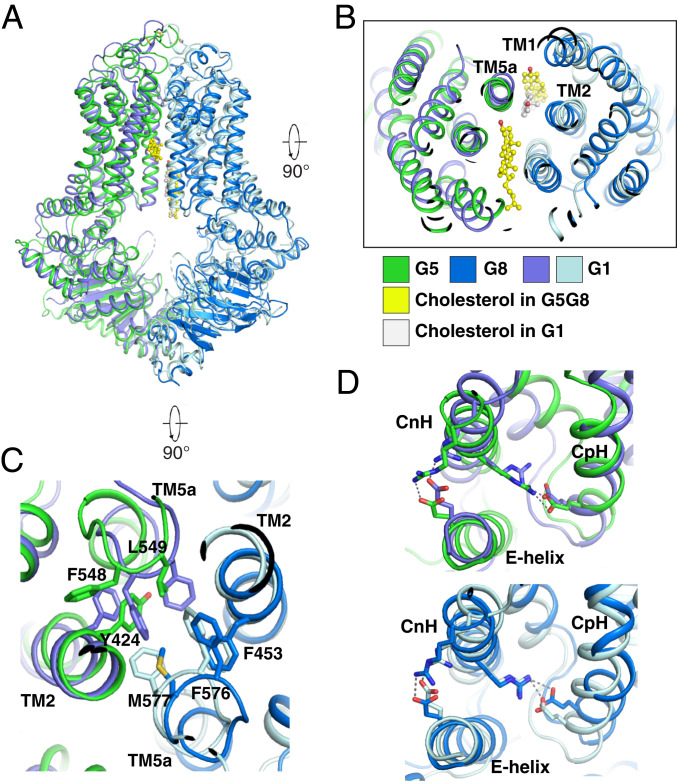
Fig. 7.
Structural comparison of cholesterol-bound G5G8 with G1. ( A ) Overall structural comparison of cholesterol-bound G5G8 with cholesterol-bound G1 EQ . ( B ) The extracellular view showing that TM1 of G...
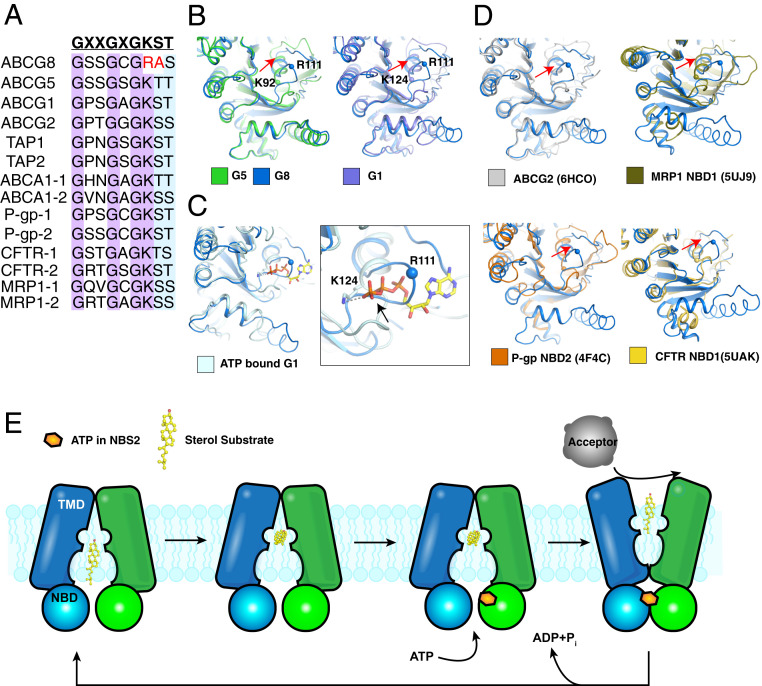
Fig. 8.
Unique feature of the G8 P loop and a model for G5G8-mediated sterol export. ( A ) The sequence alignment of the P loop of human ABC transporters. The conserved residues are highlighted. ( B ) Structu...
Figure images are served from the NIH/NLM PubMed Central Open Access Subset or Europe PMC; copyright remains with the publishers and authors.
💬 Discussion
0 commentsNo comments yet. Be the first to start a discussion!
Leave a Comment