Abstract
Diverse processes-e.g., environmental pollution, groundwater remediation, oil recovery, filtration, and drug delivery-involve the transport of colloidal particles in porous media. Using confocal microscopy, we directly visualize this process in situ and thereby identify the fundamental mechanisms by which particles are distributed throughout a medium. At high injection pressures, hydrodynamic stresses cause particles to be continually deposited on and eroded from the solid matrix-notably, forcing them to be distributed throughout the entire medium. By contrast, at low injection pressures, the relative influence of erosion is suppressed, causing particles to localize near the inlet of the medium. Unexpectedly, these macroscopic distribution behaviors depend on imposed pressure in similar ways for particles of different charges, although the pore-scale distribution of deposition is sensitive to particle charge. These results reveal how the multiscale interactions between fluid, particles, and the solid matrix control how colloids are distributed in a porous medium.
🔬 Techniques
🔭 Microscopes
✨ Fluorophores
🧪 Sample Preparation
🏭 Microscope Brands
🧪 Reagent Suppliers
🏛️ Research Organizations (ROR)
Affiliated research institutions:
📋 Methods
Experimental platform for visualization of colloidal dynamics
We prepare rigid 3D porous media by lightly sintering dense, disordered packings of hydrophilic glass beads, with diameters d between 38 and 45 μm, in thin-walled square quartz capillaries of cross-sectional area A = 1 mm 2 . The experimental geometry is schematized in Fig. 1 . The packings have lengths L ranging from 5 mm to 2 cm and porosity ϕ 0 ≈ 0.41 as measured previously using confocal microscopy ( 47 ). Scattering of light from the surfaces of the beads typically precludes direct observation of flow and transport within the medium. Following our previous work ( 47 , 48 ), we overcome this limitation by formulating a fluid mixture with a refractive index matching that of the glass beads—enabling full characterization of pore space structure and subsequent visualization of colloidal deposition using confocal microscopy (Materials and Methods). Fig. 1 Schematic of experimental setup. Our experiments are performed using 3D porous media composed of glass beads of diameter d between 38 and 45 μm, densely packed within thin-walled square quartz capillaries with cross-sectional length w = 1 mm. A dilute colloidal suspension containing particles of diameter d p = 1 μm is injected through the pore space at a fixed imposed pressure drop. The fluorescent particles are visualized at scales ranging from that of individual pores to the overall porous medium using confocal microscopy. Before each experiment, we map the pore space by saturating the medium with the fluorescently dyed fluid and acquiring a cross-sectional image of the full pore space at a fixed depth in the medium. We identify the glass beads by their contrast with the dyed fluid, with cross sections shown by the black circles in Fig. 2 , and the fluid-saturated pore space by the bright region between the beads. Thus, this protocol enables us to characterize the pore space structure at subpore resolution before colloidal injection. Fig. 2 Macroscopic deposition profile of positively charged colloidal particles is tuned by injection pressure. Confocal micrographs show extended ( A ) and localized ( C ) deposition profiles after t = 3.1 and 1.9 hours for amine-functionalized polystyrene particles injected at 260 or 80 kPa, respectively. Black circles show cross sections through the beads making up the porous media, white space shows pore space, and red shows deposited colloidal particles. Corresponding line traces in ( B ) and ( D ) show the amount of deposition at each position along the flow direction, quantified by A d / A pore,0 , where A d is the laterally averaged area occupied by deposited particles and A pore,0 is the pore space area before colloidal injection. Traces show A d with a running average over every 100 μm along the length of the medium to minimize noise; different traces are shown for images obtained every 2 min in (B) and 3 min in (D), which we represent by the total number of suspension PVs injected. The traces exhibit some spatial fluctuations that likely reflect the influence of packing heterogeneities in the disordered media. In some cases, A d / A pore,0 slightly exceeds one due to the nonzero thickness of the optical slice. For clarity, we only show the deposition profile for the first 4000 μm of the media, shorter than their full lengths. Flow direction is from left to right, and the scale bars represent 200 μm. We then inject the undyed fluid, laden with fluorescent colloidal particles of diameter d p = 1 μm at a concentration of ∼10 9 particles/ml = 0.05 volume %, at a fixed pressure drop Δ P across the overall medium. The magnitude of the characteristic interstitial flow velocity ranges from ∼0.5 to 5 cm/min, or ∼7 to 70 m/day, comparable to that of forced-gradient groundwater flow in a sand aquifer. We denote the time t at which particles begin to enter the medium as t = 0 and represent subsequent times by the total number of suspension PVs injected, ∫ 0 t Q ( t ) dt / [ AL ϕ ( t ) ] , where Q ( t ) and ϕ( t ) are the time-dependent volumetric flow rate and porosity, respectively. To characterize particle deposition in the pore space, we continually acquire successive images spanning the entire cross section of the medium; in parallel, we measure the effluent mass, providing a direct measure of the flow rate. The Reynolds number characterizing our experiments is ∼10 −4 to 10 −3 , indicating that the flow is laminar. The particle Péclet number Pe, quantifying the importance of advection relative to diffusion in determining the particle motion, is >10 4 ; hence, particle transport is primarily due to fluid advection. Because our experiments explore the injection of up to thousands of PVs of particle suspension, they range from “clean bed” conditions characterized by minimal prior deposition to nearly clogged conditions. Furthermore, our experiments test two different colloidal particle chemistries characterized by “favorable” attractive electrostatic interactions or “unfavorable” repulsive interactions with the solid matrix of the medium. Thus, our work complements previous characterization of these distinct conditions and modes of interaction using transport measurements, magnetic resonance imaging, X-ray microtomography, optical imaging, and static light scattering ( 13 , 14 , 29 – 36 ).
Show full methods section
Experimental platform for visualization of colloidal dynamics
We prepare rigid 3D porous media by lightly sintering dense, disordered packings of hydrophilic glass beads, with diameters d between 38 and 45 μm, in thin-walled square quartz capillaries of cross-sectional area A = 1 mm 2 . The experimental geometry is schematized in Fig. 1 . The packings have lengths L ranging from 5 mm to 2 cm and porosity ϕ 0 ≈ 0.41 as measured previously using confocal microscopy ( 47 ). Scattering of light from the surfaces of the beads typically precludes direct observation of flow and transport within the medium. Following our previous work ( 47 , 48 ), we overcome this limitation by formulating a fluid mixture with a refractive index matching that of the glass beads—enabling full characterization of pore space structure and subsequent visualization of colloidal deposition using confocal microscopy (Materials and Methods). Fig. 1 Schematic of experimental setup. Our experiments are performed using 3D porous media composed of glass beads of diameter d between 38 and 45 μm, densely packed within thin-walled square quartz capillaries with cross-sectional length w = 1 mm. A dilute colloidal suspension containing particles of diameter d p = 1 μm is injected through the pore space at a fixed imposed pressure drop. The fluorescent particles are visualized at scales ranging from that of individual pores to the overall porous medium using confocal microscopy. Before each experiment, we map the pore space by saturating the medium with the fluorescently dyed fluid and acquiring a cross-sectional image of the full pore space at a fixed depth in the medium. We identify the glass beads by their contrast with the dyed fluid, with cross sections shown by the black circles in Fig. 2 , and the fluid-saturated pore space by the bright region between the beads. Thus, this protocol enables us to characterize the pore space structure at subpore resolution before colloidal injection. Fig. 2 Macroscopic deposition profile of positively charged colloidal particles is tuned by injection pressure. Confocal micrographs show extended ( A ) and localized ( C ) deposition profiles after t = 3.1 and 1.9 hours for amine-functionalized polystyrene particles injected at 260 or 80 kPa, respectively. Black circles show cross sections through the beads making up the porous media, white space shows pore space, and red shows deposited colloidal particles. Corresponding line traces in ( B ) and ( D ) show the amount of deposition at each position along the flow direction, quantified by A d / A pore,0 , where A d is the laterally averaged area occupied by deposited particles and A pore,0 is the pore space area before colloidal injection. Traces show A d with a running average over every 100 μm along the length of the medium to minimize noise; different traces are shown for images obtained every 2 min in (B) and 3 min in (D), which we represent by the total number of suspension PVs injected. The traces exhibit some spatial fluctuations that likely reflect the influence of packing heterogeneities in the disordered media. In some cases, A d / A pore,0 slightly exceeds one due to the nonzero thickness of the optical slice. For clarity, we only show the deposition profile for the first 4000 μm of the media, shorter than their full lengths. Flow direction is from left to right, and the scale bars represent 200 μm. We then inject the undyed fluid, laden with fluorescent colloidal particles of diameter d p = 1 μm at a concentration of ∼10 9 particles/ml = 0.05 volume %, at a fixed pressure drop Δ P across the overall medium. The magnitude of the characteristic interstitial flow velocity ranges from ∼0.5 to 5 cm/min, or ∼7 to 70 m/day, comparable to that of forced-gradient groundwater flow in a sand aquifer. We denote the time t at which particles begin to enter the medium as t = 0 and represent subsequent times by the total number of suspension PVs injected, ∫ 0 t Q ( t ) dt / [ AL ϕ ( t ) ] , where Q ( t ) and ϕ( t ) are the time-dependent volumetric flow rate and porosity, respectively. To characterize particle deposition in the pore space, we continually acquire successive images spanning the entire cross section of the medium; in parallel, we measure the effluent mass, providing a direct measure of the flow rate. The Reynolds number characterizing our experiments is ∼10 −4 to 10 −3 , indicating that the flow is laminar. The particle Péclet number Pe, quantifying the importance of advection relative to diffusion in determining the particle motion, is >10 4 ; hence, particle transport is primarily due to fluid advection. Because our experiments explore the injection of up to thousands of PVs of particle suspension, they range from “clean bed” conditions characterized by minimal prior deposition to nearly clogged conditions. Furthermore, our experiments test two different colloidal particle chemistries characterized by “favorable” attractive electrostatic interactions or “unfavorable” repulsive interactions with the solid matrix of the medium. Thus, our work complements previous characterization of these distinct conditions and modes of interaction using transport measurements, magnetic resonance imaging, X-ray microtomography, optical imaging, and static light scattering ( 13 , 14 , 29 – 36 ).
MATERIALS AND METHODS Experimental setup
We prepare rigid 3D porous media by lightly sintering dense, disordered packings of hydrophilic glass beads, with diameters d between 38 and 45 μm, in thin-walled square quartz capillaries of cross-sectional area A = 1 mm 2 for under a minute at 900 ∘ C. The packings have lengths L ranging from 5 mm to 2 cm and porosity ϕ 0 ≈ 0.41 as measured previously using confocal microscopy ( 47 ). Before each experiment, the pore space is saturated with the particle-free fluid before the homogenized colloidal suspension is injected into the medium. We impose a constant pressure drop across the medium using a Teledyne ISCO LC-5000 syringe pump, and use an OMEGA differential pressure sensor to independently verify the pressure drop across the medium. We continually image the pore space, as detailed below; in parallel, we measure the volumetric flow rate by measuring the effluent mass over time using a Mettler Toledo balance with an accuracy of 1 mg and converting to a volume using a density ρ ≈ 1.23 g/cm 3 , calculated as a weighted average of the densities of the different fluid components. The experiments last until a filter cake of particles begins to form at the inlet of the medium. Fluid and colloid properties We formulate an index-matched aqueous fluid composed of 82 weight % (wt %) glycerol (Sigma-Aldrich), 12 wt % dimethyl sulfoxide (Sigma-Aldrich), and 6 wt % ultrapure water. This fluid has a density ρ ≈ 1.23 g/cm 3 , calculated as a weighted average of the densities of the different fluid components, and a dynamic shear viscosity μ ≈ 60 mPa-s, as previously determined using a shear rheometer ( 47 ). The colloids used are fluorescent amine-functionalized (Sigma-Aldrich) and carboxyl-functionalized polystyrene particles (FluoSpheres, Thermo Fisher Scientific) with a mean diameter of d p = 1 μm; DLVO analysis of the colloidal interactions is given in the Supplementary Materials. Stock suspensions are sonicated to uniformly disperse the particles, diluted to 0.05 volume % (for the experiments described in Figs. 2 to 5 ) or 0.1 volume % (for additional experiments shown in Fig. 6 ) in the fluid mixture, and further homogenized by vortexing and additional sonication. The zeta potentials of the amine- and carboxyl-functionalized particles are +25 ± 8 and −34 ± 5 mV, respectively, as measured in the fluid mixture itself using a Malvern Zetasizer Nano ZS. We verify that the magnitudes of these zeta potentials are sufficiently large to maintain particle stability in the suspension over the entire course of injection, as detailed in the Supplementary Materials. We also do not observe any noticeable deformation or swelling of the polystyrene particles in the presence of glycerol and dimethyl sulfoxide at the ratios used in our tests; this observation is consistent with previous reports indicating that polystyrene does not swell or soften when exposed to these solvents ( 56 – 58 ). The Reynolds number characterizing our experiments is ρ vd b /μ ≤ 3 × 10 −4 , where d b is the diameter of a pore body, indicating that the flow is laminar. The particle Péclet number Pe = 6πμ v ( d p /2) 2 /( k B T ) ∼ 10 4 to 10 5 , where k B is Boltzmann’s constant and T is temperature, and the ratio of viscous forces to gravitational forces on the particles is given by 9μ v /[2Δρ g ( d p /2) 2 ] ∼ 10 5 to 10 6 , where Δρ ≈ 0.17 g/cm 3 is the density difference between particles and fluid and g is gravitational acceleration, indicating that particle transport is primarily due to advection by the fluid.
Confocal microscopy
Before each experiment, we saturate the pore space with the particle-free fluid, dyed with rhodamine 6G (Sigma-Aldrich). We use a laser scanning Nikon A1R+ confocal microscope to acquire high-resolution optical slices at a fixed depth within the pore space; these span the entire width and length of the medium and thus provide a full cross-sectional image. The acquisition time for the entire cross section is ∼2 min. We identify the glass beads by their contrast with the dyed fluid, with cross sections shown by the black circles in Fig. 2 , and the fluid-saturated pore space by the bright region between the beads. Hence, this protocol enables us to characterize the pore space structure before colloidal injection. We then inject the colloidal suspension, composed of fluorescent particles dispersed in the same but undyed fluid, and acquire successive cross-sectional images of particles in the pore space. We adjust laser power and gain amplitude to avoid pixel saturation for each experiment. The time required to raster across the width of each optical slice is longer than the time required for individual particles to be advected across; as a result, the images primarily reflect deposited particles, not particles dispersed in the suspension. The focal depth in each experiment is 7 μm except for tests with the carboxyl-functionalized polystyrene particles at 80 kPa, where focal depth is 38 μm due to the use of a lower-magnification objective lens to scan the longer porous medium; the pore space area A pore and area of deposited particles A d determined from the images thus correspond to a 2D projection of a volume spanning ∼1 pore body to ∼1 bead in depth. For all experiments, we restrict our analysis of the images to a distance ∼60 μm away from the transverse boundaries of the capillary to minimize edge effects. Simulations of particle deposition and erosion To explore the influence of hydrodynamic and colloidal interactions on particle deposition and erosion, we use the Parti-Suite software package ( 59 ) to examine the trajectories of single particles or clusters of particles as they flow through the pore space. Specifically, we simulate Lagrangian trajectories that explicitly incorporate the forces and torques on particles ( 49 ) in a Happel sphere-in-cell model of the pore space surrounding an individual bead ( 37 ). Previous work has established the ability of this framework to quantitatively model particle deposition and erosion from surfaces under the influence of imposed flow ( 49 ). Specifically, the particles are initialized at random points at the entrance of the pore upstream of the bead. We choose the flow velocity to match that of the experiments. Before particle-bead contact, the particle velocity is computed from the action of hydrodynamic forces exerted by the imposed flow, computed using the parameter values given in table S2. Upon contact with the bead surface, particle movement is dictated by the balance between hydrodynamic and attachment torques ( 49 ), computed using the parameter values given in tables S1 and S2, respectively. Multiparticle clusters are treated as larger 4-μm-diameter particles and are simulated in the same way, but using physicochemical parameters that describe the relevant colloid-colloid interactions. We use these simulations to assess deposition and erosion of amine- and carboxyl-functionalized particles and particle clusters, at high and low imposed pressures, and both in the refractive index–matched fluid mixture and in pure water. These results are detailed in the Supplementary Materials.
Calculation of permeability of deposit-filled region
To determine k ~ d ( t ) ≡ k d / k 0 , we use the images in a square region near the inlet of the medium approximately 400 μm × 400 μm across to determine the time-dependent pore space area A pore ( t ), the deposited particle cross-sectional area A d ( t ), the pore space perimeter P pore ( t ), and the porosity ϕ( t ) in the particle deposit-filled region. We then calculate k ~ d ( t ) by modeling the pore space as a parallel bundle of cylindrical capillary tubes, each of which has a hydraulic diameter d h and length l . The pressure drop across each tube is then given by the Hagen-Poiseuille equation as 32 μ lv / d h 2 , where v = Q /(ϕ A ) is the interstitial flow speed in the medium. This pressure drop is also given by Darcy’s law as μ v ϕ l/k d . Equating these two relations for pressure drop yields k d = ϕ d h 2 / 32 . Hence, k ~ d ( t ) = [ ϕ ( t ) / ϕ 0 ] [ d h ( t ) / d h , 0 ] 2 . We follow typical convention ( 60 ) in defining the hydraulic diameter d h ( t ) ∼ A pore ( t )/ P pore ( t ), which we directly measure using confocal micrographs in a square region near the inlet of the medium approximately 400 μm × 400 μm across.
Experimental setup
We prepare rigid 3D porous media by lightly sintering dense, disordered packings of hydrophilic glass beads, with diameters d between 38 and 45 μm, in thin-walled square quartz capillaries of cross-sectional area A = 1 mm 2 for under a minute at 900 ∘ C. The packings have lengths L ranging from 5 mm to 2 cm and porosity ϕ 0 ≈ 0.41 as measured previously using confocal microscopy ( 47 ). Before each experiment, the pore space is saturated with the particle-free fluid before the homogenized colloidal suspension is injected into the medium. We impose a constant pressure drop across the medium using a Teledyne ISCO LC-5000 syringe pump, and use an OMEGA differential pressure sensor to independently verify the pressure drop across the medium. We continually image the pore space, as detailed below; in parallel, we measure the volumetric flow rate by measuring the effluent mass over time using a Mettler Toledo balance with an accuracy of 1 mg and converting to a volume using a density ρ ≈ 1.23 g/cm 3 , calculated as a weighted average of the densities of the different fluid components. The experiments last until a filter cake of particles begins to form at the inlet of the medium.
Supplementary Material http://advances.sciencemag.org/cgi/content/full/6/46/eabc2530/DC1 Movie S1 Movie S2 Movie S3 Movie S4 Movie S5 Movie S6 Movie S7 Movie S8 Supplementary Materials Multiscale dynamics of colloidal deposition and erosion in porous media
📊 Figures
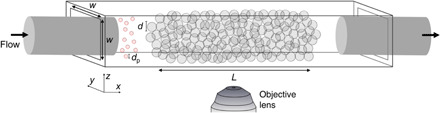
Fig. 1
Schematic of experimental setup.
Our experiments are performed using 3D porous media composed of glass beads of diameter d between 38 and 45 u03bcm, densely packed within thin-walled square quartz capillaries with cross-sectional len...
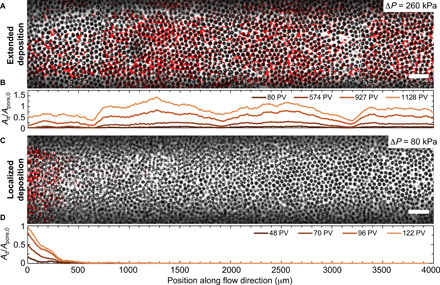
Fig. 2
Macroscopic deposition profile of positively charged colloidal particles is tuned by injection pressure.
Confocal micrographs show extended ( A ) and localized ( C ) deposition profiles after t = 3.1 and 1.9 hours for amine-functionalized polystyrene particles injected at 260 or 80 kPa, respectively. Bla...
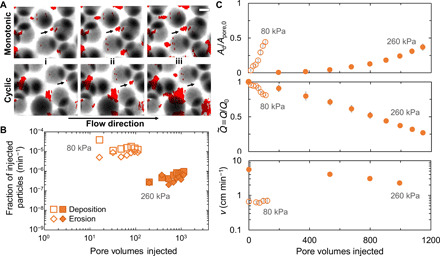
Fig. 3
Deposition and erosion of positively charged colloidal particles at the pore scale.
( A ) Arrows in the upper and lower sequences of micrographs show monotonic deposition and cyclic depositionu2013erosion of particles upstream of a bead, respectively, at 260 kPa. (i) to (iii) show mi...
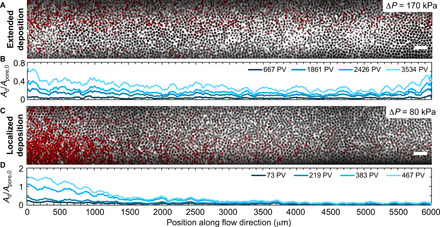
Fig. 4
Macroscopic deposition profile of negatively charged colloidal particles is tuned by injection pressure.
Confocal micrographs show extended ( A ) and localized ( C ) deposition profiles after t = 5.6 and 16.7 hours for carboxyl-functionalized polystyrene particles injected at 170 or 80 kPa, respectively....
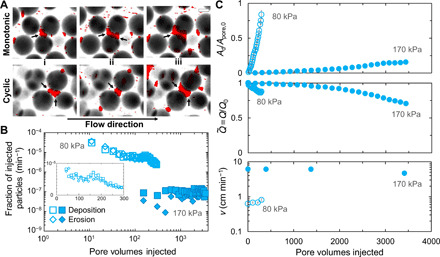
Fig. 5
Deposition and erosion of negatively charged colloidal particles at the pore scale.
( A ) Arrows in the upper and lower sequences of micrographs show monotonic deposition and cyclic depositionu2013erosion of particles upstream of a bead, respectively, at 170 kPa. (i) to (iii) show mi...
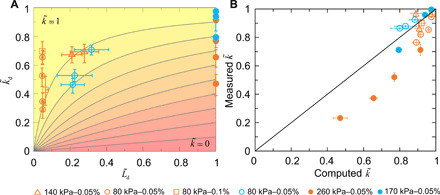
Fig. 6
Pore-scale and macroscopic features of colloidal deposition control overall flow behavior.
( A ) Color map showing the normalized overall permeability of the medium, k u02dc u2261 k / k 0 , calculated using Eq. 2 of the main text for different values of the normalized permeability and lengt...
Figure images are served from the NIH/NLM PubMed Central Open Access Subset or Europe PMC; copyright remains with the publishers and authors.
💬 Discussion
0 commentsNo comments yet. Be the first to start a discussion!
Leave a Comment