Abstract
AbstractNanofibrous materials are widely investigated as a replacement for the extracellular matrix, the 3D foundation for cells in all tissues. However, as with every medical material, nanofibers too must pass all safety evaluations like in vitro cytotoxicity assays or in vivo animal tests. Our literature research showed that differences in results of widely used cytotoxicity assays applied to evaluate nanofibrous materials are poorly understood. To better explore this issue, we prepared three nanofibrous materials with similar physical properties made of poly-L-lactic acid, polyurethane, and polycaprolactone. We tested five metabolic cytotoxicity assays (MTT, XTT, CCK-8, alamarBlue, PrestoBlue) and obtained different viability results for the same nanofibrous materials. Further, the study revealed that nanofibrous materials affect the reaction of cytotoxicity assays. Considering the results of both described experiments, it is evident that validating all available cytotoxicity assays for nanofibrous materials and possibly other highly porous materials should be carefully planned and verified using an additional analytical tool, like scanning electron microscopy or, more preferably, confocal microscopy.
🔬 Techniques
🔭 Microscopes
✨ Fluorophores
🧪 Sample Preparation
🔬 Cell Lines
🏭 Microscope Brands
🧪 Reagent Suppliers
💻 Software Details
🏛️ Research Organizations (ROR)
Affiliated research institutions:
📋 Methods
Reagents
Three polymers commonly used in tissue engineering and medical device fabrication were chosen for this study to produce nanofibrous mats: poly-L-lactic acid (PLLA, Biomer L9000, M w = 200,000 Da, Krailing), polyurethane (PU, Elastollan 1185A, M w = 108,500 Da, BASF), and ε-polycaprolactone (PCL, M n = 80,000 Da, Sigma Aldrich). Solvents for polymers include chloroform, acetone, tetrahydrofuran (Chempur) and 2,2,2-trifluoroethanol (TCI). The mouse fibroblast cell line L929 (ATCC CCL-1) was purchased from American Type Culture Collection. L929 fibroblasts were maintained in Dulbecco's Modified Eagle Medium (DMEM, Thermo Fisher Scientific) supplemented with 10% fetal bovine serum (FBS, Thermo Fisher Scientific) and antibiotics (100 U ∙ mL -1 penicillin, 100 µg ∙ mL -1 streptomycin, Thermo Fisher Scientific). Trypsin–EDTA 0.25% solution (Thermo Fisher Scientific) and Phosphate buffer saline without magnesium and calcium ions (PBS, Thermo Fisher Scientific) were used for cell passaging. Viability/Cytotoxicity assays: MTT (thiazolyl blue tetrazolium bromide, Sigma-Aldrich), XTT (The Cell Proliferation Kit II [XTT], Roche), CCK-8 (Cell Counting Kit-8™, Dojindo Molecular Technologies Inc.), alamarBlue (alamarBlue™ Cell Viability Reagent, Invitrogen), PrestoBlue (PrestoBlue™ Cell Viability Reagent, Invitrogen), Live/Dead (LIVE/DEAD Viability/Cytotoxicity Kit, for mammalian cells, Thermo Fisher Scientific). Other used reagents: Triton X-100 (Sigma Aldrich), isopropanol (Chempur), ethanol 96% (P.P.H. Stanlab). Solution blow spinning and characterization of nanofibrous scaffolds The solution blow spinning process and methods for characterization of the nanofibrous scaffold are reported in Supplementary Information S1 .
Show full methods section
Reagents
Three polymers commonly used in tissue engineering and medical device fabrication were chosen for this study to produce nanofibrous mats: poly-L-lactic acid (PLLA, Biomer L9000, M w = 200,000 Da, Krailing), polyurethane (PU, Elastollan 1185A, M w = 108,500 Da, BASF), and ε-polycaprolactone (PCL, M n = 80,000 Da, Sigma Aldrich). Solvents for polymers include chloroform, acetone, tetrahydrofuran (Chempur) and 2,2,2-trifluoroethanol (TCI). The mouse fibroblast cell line L929 (ATCC CCL-1) was purchased from American Type Culture Collection. L929 fibroblasts were maintained in Dulbecco's Modified Eagle Medium (DMEM, Thermo Fisher Scientific) supplemented with 10% fetal bovine serum (FBS, Thermo Fisher Scientific) and antibiotics (100 U ∙ mL -1 penicillin, 100 µg ∙ mL -1 streptomycin, Thermo Fisher Scientific). Trypsin–EDTA 0.25% solution (Thermo Fisher Scientific) and Phosphate buffer saline without magnesium and calcium ions (PBS, Thermo Fisher Scientific) were used for cell passaging. Viability/Cytotoxicity assays: MTT (thiazolyl blue tetrazolium bromide, Sigma-Aldrich), XTT (The Cell Proliferation Kit II [XTT], Roche), CCK-8 (Cell Counting Kit-8™, Dojindo Molecular Technologies Inc.), alamarBlue (alamarBlue™ Cell Viability Reagent, Invitrogen), PrestoBlue (PrestoBlue™ Cell Viability Reagent, Invitrogen), Live/Dead (LIVE/DEAD Viability/Cytotoxicity Kit, for mammalian cells, Thermo Fisher Scientific). Other used reagents: Triton X-100 (Sigma Aldrich), isopropanol (Chempur), ethanol 96% (P.P.H. Stanlab). Solution blow spinning and characterization of nanofibrous scaffolds The solution blow spinning process and methods for characterization of the nanofibrous scaffold are reported in Supplementary Information S1 .
Scanning electron microscopy
Nanofibers sizes, morphology, pore sizes, and morphology of cells cultured on the scaffolds' surface were measured and investigated based on the scanning electron microscopic (SEM, Phenom G1®, PhenomWorld, Netherlands) microphotographs. A rectangular sample was cut and put on the SEM stub using conductive carbon tape from each nanofibrous mat. As prepared, samples were coated with a 15 nm layer of gold (K550X Emitech, Quorum Technologies, UK) to avoid charging of fibers' surface. At least ten randomly chosen spots of each sample were analyzed. L929 Cell line culture maintaining L929 cells were cultured in a DMEM medium with 10% (v/v) FBS, 100 U ∙ mL -1 penicillin, 100 µg mL -1 streptomycin in 75 cm 2 cell culture flasks kept at 37 °C in an incubator with 5% CO 2 . The culture was monitored under the microscope every two days, dissociated, and divided when the cell was near 100% confluent. Cell dissociation protocol was based on a trypsin–EDTA solution procedure. Cells concentration was counted in the Thoma cell counting chamber (Marienfeld, Germany). Nanofibrous scaffolds extract cytotoxicity A nanofibrous scaffold made of PCL (n = 3), PLLA (n = 3), and PU (n = 3) was immobilized by polypropylene insert (Fig. S1) in a 24-well plate and sunk in 1.3 mL of supplemented DMEM for 24 h for obtaining scaffolds extracts. Additionally, a sterile solution of 0.1% Triton X-100 in supplemented DMEM was prepared and incubated in the same periods to obtain positive control (n = 3). Supplemented DMEM stored in an incubator for 24 h (n = 3) was treated as a negative control. L929 cell line was maintained in 96-well plates for 24 h in concentration 10 5 cells ∙ mL -1 and 100 μL of culture medium per well. After this time, the DMEM was replaced by extracts. After 24 h of cultivation with extracts, cells were rinsed two times by adding 100 μL of PBS, and following cytotoxicity assays were performed. Detailed protocols for indirect MTT, XTT, CCK-8, alamarBlue, and PrestoBlue cytotoxicity assays are reported in Supplementary Information S1 . In all cases, the relative cell viability was defined as the absorbance/fluorescence ratio from the sample to the absorbance/fluorescence measured for negative control and represented as a mean value ± standard deviation. Direct contact cytotoxicity Nanofibrous scaffolds made of PCL (n = 4), PLLA (n = 4), PU (n = 4) were immobilized by polypropylene inserts (Fig. S1) in 24-well plates. Cells in wells with polypropylene inserts (n = 4) were treated as a negative cytotoxicity control. 1 mL of cell suspension (1 ∙ 10 5 cells ∙ mL -1 ) was added to each well, and plates were kept for 24 h at 37 °C in an incubator with 5% CO 2 . Before each cytotoxicity assay, the DMEM medium was removed, and each well with cells was rinsed twice with PBS. Detailed protocols for direct MTT, XTT, CCK-8, alamarBlue, and PrestoBlue cytotoxicity assays are reported in Supplementary Information S1 . In all cases, the cell viability was defined as the ratio of the absorbance/fluorescence/ of samples to the absorbance/fluorescence/ of negative cytotoxicity control and represented as a mean value ± standard deviation. Proliferation study A sterile nanofibrous scaffold made of PCL (n = 3), PLLA (n = 3), PU (n = 3) was immobilized by polypropylene insert (Fig. S1) in 24-well plate. To each well, 1 mL of cell suspension (1 ∙ 10 4 cells ∙ mL -1 ) in supplemented DMEM was added and kept for 24 h, 72 h, and 7 days at 37 °C in an incubator with 5% CO 2 with exchanging culture medium every 48 h. Cell seeded to wells without scaffolds was treated as negative cytotoxicity control. After each incubation period, the culture medium was removed from the wells, and samples were washed twice with PBS solution to the culture medium. For the Live/Dead cell viability assay, 2 µM of calcein AM and 4 µM of Ethidium Homodimer-1 part (both parts of Live/Dead assay kit) in PBS solution were added in a volume of 200 µL directly to each well and incubated 30 min in 37 °C. After staining, wet scaffolds were put between two microscopic slides, and the whole surface of each scaffold was scanned by confocal laser scanning microscopy (CLSM, LSM 880, Zeiss, Germany). To account for the uneven distribution of cells, central areas of 4.3 × 4.3 mm for each sample were observed for statistics. A full-area image was taken for each material as proof of even cell distribution. Control was scanned by putting a 24-well plate into CLSM. For each sample, the obtained image was converted in ImageJ software 50 into two binary images—one for each used dye, then watershed for cell separation, and finally, cells were counted by particle analyzer. For SEM observation, samples were sunk in freeze cold (− 15 °C) methanol for 15 min to preserve cells on the scaffolds' surface. Then, to remove water, methanol-soaked scaffolds were sunk (5 min each step) in a cascade of EtOH solutions in distilled water with a concentration from 50% (first step) and a growing concentration of EtOH every 10% to the most concentrated 98% solution of EtOH. The dehydrated scaffolds were air-dried and prepared for SEM observation as described in the previous section of the paper. MTT, XTT, Cell Counting Kit-8, alamarBlue, and PrestoBlue viability assay procedures were the same as described in the direct contact cytotoxicity section above. Live/Dead direct contact cytotoxicity Nanofibrous scaffolds made of PCL (n = 4), PLLA (n = 4), PU (n = 4) were immobilized by polypropylene inserts (Fig. S1) in 24-well plates. Cells in wells with polypropylene inserts (n = 4) were treated as a negative cytotoxicity control. 1 mL of cell suspension (1 ∙ 10 5 cells ∙ mL -1 ) was added to each well, and plates were kept for 24 h at 37 °C in an incubator with 5% CO 2 . Before cytotoxicity evaluation using Live/Dead, DMEM medium was removed, and each well with cells was double rinsed with PBS. Next Live/Dead cell viability assay, 2 µM of calcein AM and 4 µM of Ethidium Homodimer-1 part (both parts of Live/Dead assay kit) in PBS solution were added in a volume of 200 µL directly to each well and incubated for 30 min in 37 °C. After staining, wet scaffolds were put between two microscopic slides, and the whole surface of each scaffold was scanned by CLSM. Negative cytotoxicity control was scanned by putting a 24-well plate into CLSM. For each sample, the obtained image was converted in ImageJ software into two binary images – one for each used dye, then watershed for cell separation, and finally, cells were counted by particle analyzer. In all cases, the cell viability was defined as the ratio of the counted live cells of samples to the live cells of negative cytotoxicity control and represented as a mean value ± standard deviation. The contrast and brightness of the obtained images have been improved for better visibility of dead cells.
Supplementary Information Supplementary Information.
📊 Figures
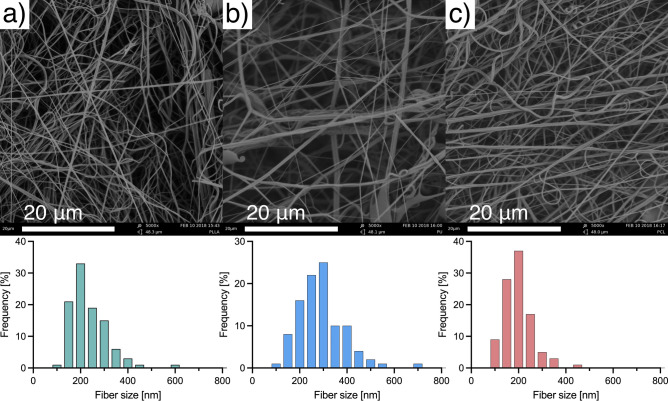
Figure 1
SEM images and fibers size distributions of ( a ) u2013 PLLA; ( b ) u2013 PU; ( c ) u2013 PCL.
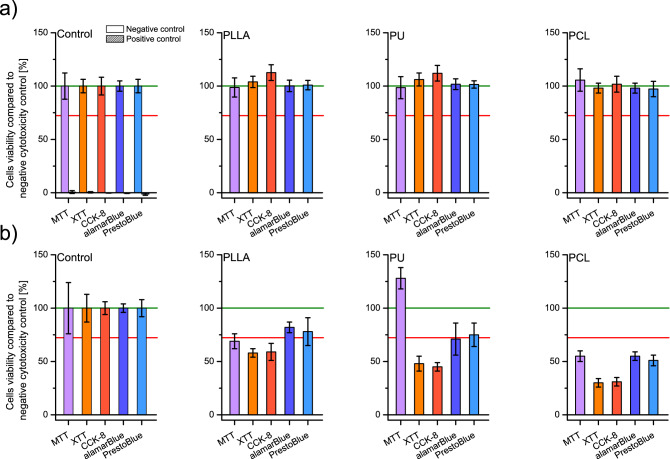
Figure 2
Cells viability was tested by MTT, XTT, CCK-8, alamarBlue, and PrestoBlue assays ( a )u00a0on scaffolds' liquid extracts after 24u00a0h of incubation with PLLA, PU, and PCL; and ( b ) after 24u00a0h o...
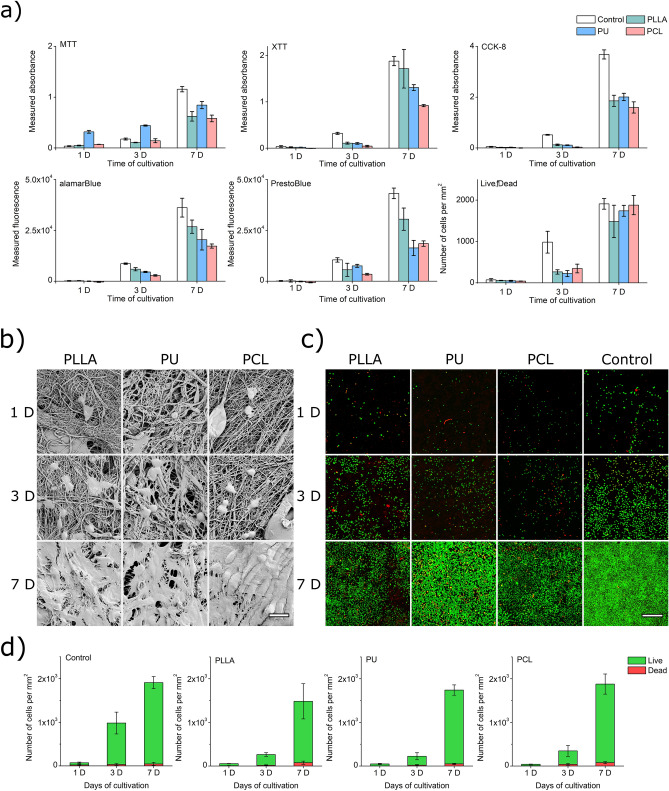
Figure 3
( a ) Dependency between the result of MTT, XTT, CCK-8, alamarBlue, PrestoBlue, and Live/Dead assay and time of cell cultivation on PLLA, PU, and PCL materials. ( b ) SEM images of L929 cell culture o...
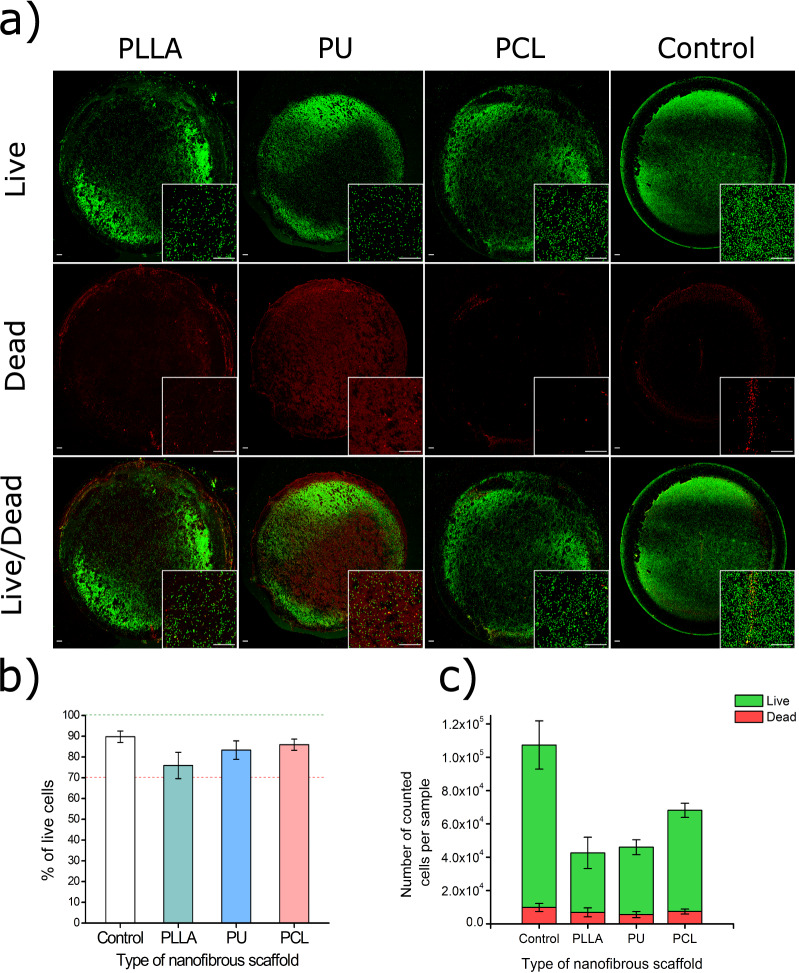
Figure 4
( a ) CLSM images of L929 cell culture on surfaces of PLLA, PU, and PCL scaffolds after 24u00a0h of cultivation. Green dots are live cells; red dots are dead cells. The scale bar represents 500u00a0u0...
Figure images are served from the NIH/NLM PubMed Central Open Access Subset or Europe PMC; copyright remains with the publishers and authors.
💬 Discussion
0 commentsNo comments yet. Be the first to start a discussion!
Leave a Comment