Abstract
Plants develop in a microbe-rich environment and must interact with a plethora of microorganisms, both pathogenic and beneficial. Indeed, such is the case of Pseudomonas, and its model organisms P. fluorescens and P. syringae, a bacterial genus that has received particular attention because of its beneficial effect on plants and its pathogenic strains. The present study aims to compare plant-beneficial and pathogenic strains belonging to the P. syringae species to get new insights into the distinction between the two types of plant-microbe interactions. In assays carried out under greenhouse conditions, P. syringae pv. syringae strain 260-02 was shown to promote plant-growth and to exert biocontrol of P. syringae pv. tomato strain DC3000, against the Botrytis cinerea fungus and the Cymbidium Ringspot Virus. This P. syringae strain also had a distinct volatile emission profile, as well as a different plant-colonization pattern, visualized by confocal microscopy and gfp labeled strains, compared to strain DC3000. Despite the different behavior, the P. syringae strain 260-02 showed great similarity to pathogenic strains at a genomic level. However, genome analyses highlighted a few differences that form the basis for the following hypotheses regarding strain 260-02. P. syringae strain 260-02: (i) possesses non-functional virulence genes, like the mangotoxin-producing operon Mbo; (ii) has different regulation pathways, suggested by the difference in the autoinducer system and the lack of a virulence activator gene; (iii) has genes encoding DNA methylases different from those found in other P. syringae strains, suggested by the presence of horizontal-gene-transfer-obtained methylases that could affect gene expression.
🔬 Techniques
🔭 Microscopes
🧬 Organisms
💻 Software
✨ Fluorophores
🏭 Microscope Brands
🧪 Reagent Suppliers
💻 Software Details
💾 Data Repositories
🏛️ Research Organizations (ROR)
Affiliated research institutions:
📋 Methods
Bacteria Isolation, Transformation and Cultivation In May 2012, as part of a survey on the apple proliferation disease caused by “ Candidatus Phytoplasma mali,” leaves were taken from apple trees ( Malus pumila Miller) at the Minoprio Foundation (Como, Italy) and endophytic bacteria were isolated from this material. Among the isolated strains was P. syringae pv. syringae strain 260-02. The plant showed no symptoms of the disease, and the pathogen was not detected by specific nested-PCR assays. Instead , P. syringae pv. tomato strain DC3000 was obtained from the collection of the University of Natural Resources and Life Sciences of Vienna (BOKU, Austria). Both strains were cultivated on LB High Salt Agar plates (tryptone 10 g/L, yeast extract 5 g/L, sodium chloride 10 g/L, agar 15 g/L) at 25°C, and were stored in a 20% glycerol solution at –80°C for long conservation periods. The strains were transformed with the integrative plasmid PUT gfp 2× ( Tombolini et al., 1997 ), carrying, as markers, the genes encoding for kanamycin resistance and the production of Green Fluorescent Protein. Several transformed colonies for strain DC3000 were compared to the wild-type to determine which ones had the most similar growth speed and behavior. The result of this protocol was the gfp -labeled strain, referred to in the manuscript as DC3000:: gfp . Since strain 260-02 did not express visible fluorescence after transformation with this method, it was transformed with the replicative plasmid pHM2-GFP ( Favia et al., 2007 ). The result of this protocol was the gfp -labeled strain, referred in the manuscript as 260-02: gfp . Fungi Isolation and Cultivation Strain MG53 of B. cinerea Pers. (BC) is used in fungal pathogen antagonism assays, the strain having been first isolated from wheat kernel in 2014. The strain was conserved in the fungal culture collection of the Mycology Laboratory at the Department of Agricultural and Environmental Sciences (DiSAA), University of Milan, Italy. The isolate was cultivated on potato dextrose agar (PDA, Difco TM ) at 20°C and stored at 4°C. Genome Sequencing and Assembly Genomic DNA was isolated from strain 260-02 as follows: the strain was cultivated in LB broth at 25°C overnight and the genomic DNA was extracted using GenElute TM Bacterial Genomic DNA Kit (Sigma-Aldich), following the manufacturer’s instruction. Genomic DNA was quantified with the Qubit dsDNA HS Assay kit (Life Technologies), purity and integrity were assessed with Nanodrop 1000 spectrophotometer (Thermo Fisher Scientific) and by agarose gel electrophoresis, respectively. Illumina libraries were produced starting from 1 μg of genomic DNA, which was sheared using the Covaris S220 instrument (Covaris Inc., Woburn, MA). Size selection of fragments 500 bp in length was conducted on agarose gel at 1.8% and libraries were produced using TruSeq DNA Sample Prep Kit (Illumina, San Diego, CA) according to manufacturer instructions. Sequencing was performed on a HiSeq1000 instrument with 100 × 2nt Pair end protocol using the TruSeq PE Cluster v3 kit (Illumina, San Diego, CA) according to manufacturer instructions. Illumina reads underwent a quality filtering process before being assembled de novo as follows: (1) low quality reads with more than 10% of undetermined bases (Ns) or with more than 50 bases called with a phred-scored basecall quality < 7 were filtered out; (2) reads were then de-duplicated using a custom in-house script; (3) sequencing adaptors were clipped with Scythe (version 0.994) using default parameters and low quality 3′ ends of reads were quality trimmed with Sickle using a quality threshold of 20 over a window of 10 bases and discarding reads under 25nt in length. Filtered reads were quality corrected with BayesHammer ( Nikolenko et al., 2012 ) and then assembled using SPAdes 2.9.0 ( Bankevich et al., 2012 ). Assembly was performed with multiple k-mer combinations in the 75 to 97 range, the best assembly occurring with k-mers 79, 83, 89, 91, 93: these showed the least fragmented sequences, the least number of contigs with the highest N50, mean and median scaffold lengths. The assembled sequences were investigated for putative assembled plasmid genomes by BLAST search, against the NCBI plasmid genomes database. Gene annotation was performed using the RAST web service, and the functional annotation of protein coding genes was improved with Blast2GO (ver. 2.8) ( Conesa et al., 2005 ). Gene clusters related to the production of secondary metabolites was predicted using the antiSMASH 3.0 online tool ( Weber et al., 2015 ). Phylogenesis Although running a BLAST of the full-length 16S rRNA gene sequence from the genome of 260-02 was sufficient to characterize the strain as P. syringae , more in-depth phylogenetic analyses were carried out. To discern the pathovar more similar to strain 260-02 a phylogenetic tree was computed, using a concatenated nucleotide sequence of the genes rpoD / gyrB ( Yamamoto et al., 2000 ) obtained from several complete genomes of bacteria from the Pseudomonas genus ( Supplementary Table S1 ). The species was also confirmed using the 40-markers approach of the software Phylosift ( Darling et al., 2014 ), and the average nucleotide identity among the full genomes of P. syringae ( Supplementary Table S1 ) was compared through ANI-MUMmer. The mangotoxin operon, a feature shared by strain 260-02, and its closest relative from the database, the strain UMAF0158, was also compared using a phylogenetic approach to determine similarity on the basis of a known pathogenesis-related function, focusing particularly on the amino acid sequence encoded by the gene mboE ( Supplementary Table S1 ). All the phylogenetic trees were obtained by aligning the sequences through the ClustalW algorithm, manually controlling the resulting alignments, and compiling the trees using MegaX software ( Kumar et al., 2018 ). Dual-Culture Inhibition Botrytis cinerea growth inhibition by the two bacterial strains was assessed through the dual-culture plate method described in Passera et al. (2017) . Briefly: droplets from an overnight liquid culture of either strain 260-02 or strain DC3000 (approximately 2 × 10 6 CFUs) were placed on four cellulose disks around the inside edge of a Petri dish containing a Tryptone Glucose Yeast Extract Agar medium (TGYA) – 5 g/L tryptone, 1 g/L glucose, 3 g/L yeast extract, 15 g/L agar. After 2 days of incubation, a BC plug (0.5 cm in diameter) was taken from actively growing mycelium of BC and was placed in the middle of the plate. As negative controls, plates containing (i) BC alone, (ii) BC with blank sterilized filter paper discs, and (iii) BC and discs inoculated with 20 μl of sterilized LB broth were used. Fungal growth, as mycelial growth diameter, was measured 5, 7, and 14 days post-inoculation (dpi). Each test was carried out with plates in triplicate and three independent measures were made for each plate at each measuring time. The Growth Inhibition Percentage (GIP) was calculated as [1–(D1/D2)] × 100, where D1 is the radial colony growth on the bacteria-treated plate, D2 is the radial colony growth on the control plate. Dual-Plate Inhibition To evaluate strains 260-02 and DC3000’s ability to inhibit fungal growth through the production of volatile compounds, a dual-plate assay was carried out ( Chaurasia et al., 2004 ). Briefly, 100 μl of an overnight strain of both the 260-02 and DC3000 cultures, in LB broth (approximately 10 7 CFU), were diffused on the surface of a TGYA plate and incubated at 25°C. After 2 days, a fungal mycelial plug (0.5 cm in diameter) was taken from actively growing mycelium of BC and was inoculated onto another TGYA plate. Under sterile conditions, the lid of the plate bearing the bacteria was replaced by the upturned plate containing the fungal inoculum, and the plates were sealed together with Parafilm. After fungal inoculation, all the plates were kept at 25°C in the dark, and the fungal growth was measured 14 dpi. Each test was made with plates in triplicate, three independent measures being made for each plate. The growth inhibition percentage, determined by volatile compounds (GIPv), was calculated as previously described. Production of Volatiles An analysis of the VOCs produced by strains 260-02 and DC3000 was carried out using a method that reproduces the dual-plate assay on the inside of a 20 ml headspace vial. Inside the vial, two layers of TGYA (described as before, except using 3% agar) were prepared on opposite sides of the vial, making sure that the layers did not touch one another. This permitted the inoculation of the different microorganisms on one layer, with no contact with the other. The vials were then sealed with a cap containing a membrane through which the extraction fiber was inserted, without coming into contact with the solid media or the microorganisms, only with the volatile compounds present in the space between the two. To test which volatiles were produced by the bacterial strain and by the fungal strain, the vials were prepared thus: (i) vials in which only strain 260-02, or strain DC3000, was growing, (ii) plates on which only BC was growing, (iii) vials in which both strain 260-02 and BC were growing, and (iv) vials with only TGYA medium, to be used as negative controls. The inoculation of both fungus and bacteria was carried out in quick succession, to avoid losing VOCs by opening the vial before the analysis. The vials, prepared in triplicates, were then closed with their cap and sealed with parafilm, and left in incubation at 25°C in the dark for 14 days before VOC analysis. This was performed using the Solid-Phase-Micro-Extraction technique, followed by Gas Chromatography-Mass Spectrometry (SPME-GC-MS). The VOCs were adsorbed on a Divinylbenzene/Carboxen/Polydimethylsiloxane (DVB/ CAR/PDMS) fiber and desorbed at 260°C in the injection port of an Agilent Technologies 6890N/5973N gas chromatograph-mass spectrometer equipped with a 60 m × 0.25 mm × 0.25 μm 100% polyethylene glycol column (Zebron ZB-WAX plus, Phenomenex). The carrier gas was helium, used in constant pressure mode (150 kPa). The oven was programmed at 45°C (5-min hold) and ramped up to 219°C at 6°C/min intervals (16-min hold). The transfer line to the mass spectrometer was maintained at 280°C, while the ion source was 230°C, and the quadrupole was 150°C. Acquisition was performed in electronic impact mode. VOCs were identified using the Wiley 7n-1 MS library on Agilent MSD ChemStation software (Agilent Technologies Inc.). Confirmation of the identity of the volatile compounds was achieved by comparing the GC retention indices and mass spectra of individual components with those of authentic reference compounds (Sigma-Aldrich Co.) under the same operating conditions. The data collected refer to the peak area of the quant ion of each compound, and are expressed as a natural logarithm, for this reason the determination must be considered semi-quantitative. Compounds were considered “absent” (i.e., not produced) when the signal to noise ratio was below 2:1. To check the presence of carry-over effects, blank extractions were conducted regularly. Inhibition by Filtrate To evaluate strains 260-02 and DC3000’s ability to inhibit fungal growth through non-volatile compounds secreted in the growth medium, an assay was carried out: TGYA plates containing the strain’s culture broth, previously purified of all cells, were prepared and used as substrate for the growth of the fungi, as described by Passera et al. (2017) . After 72 h of incubation, the liquid culture was purified of bacterial cells by centrifugation (6800 × g for 10 min) and filtration (0.2 μm pore size). The filtrate, at a final concentration of 50% v/v, was added to the TGYA medium to prepare the plates. To control the plate sterility, the plates were incubated at 25°C overnight and checked for bacterial growth. After preparing the plates with the culture filtrate, BC was inoculated under sterile conditions. The inoculum was a 0.5 cm diameter mycelial plug excised with a sterilized cork borer from the edges of an actively growing fungal culture. It was placed in the middle of the TGYA plates supplemented with filtrate. As negative control, TGYA plates, supplemented with sterile LB broth, were used for fungal culture. After fungal inoculation, all the plates were incubated at 25°C in the dark. Fungal growth was measured 14 dpi as mycelial growth diameter. Each test was carried out with plates in triplicate and three independent measures were made for each plate. Growth inhibition percentage from cultural filtrate (GIPf) was calculated as described previously. Biocontrol Against B. cinere a The ability of strains 260-02 and DC3000 to reduce infection from BC was evaluated in an experiment carried out on detached tomatoes in postharvest conditions. For this assay, ripe and healthy cherry tomatoes, grown organically in Italy and purchased in a local grocery, were used. Detached tomatoes of uniform size, free of visible blemishes, were surface sterilized in a 70% ethanol solution in water for 5 min, rinsed in water three times, and dried on filter paper under a laminar flow hood. After drying, the equatorial area of each was pierced 4 times by a needle. Bacterial strains 260-02 and DC3000 were inoculated singly by a 5 min soaking of each tomato in a bacterial suspension (approximately 10 6 CFUs/ml in Ringers solution, Sigma-Aldrich), and then left to dry on filter paper under a laminar flow hood. The BC conidia were inoculated by applying a 20 μl drop of conidial suspension (5 × 10 5 conidia/ml) into each puncture wound. For each treatment (non-treated, bacterial strains 260-02 or DC3000 alone, BC alone, bacterial strain 260-02 or DC3000 and BC) 10 tomatoes were put on a sterile ceramic tray in a glass chamber, containing a wet piece of filter paper to maintain a relative humidity of 95% inside the chamber, and incubated at 20°C in the dark. All the aforementioned procedures were carried out under sterile conditions. Each treatment was carried out in triplicate. The tomatoes were evaluated visually to determine fungal colonization at 7 days after inoculation. The results were expressed as visual classes, according to the scale presented in a previous work ( Vercesi et al., 2014 ). Visual classes were transformed into a percentage infection index (I%I) according to the formula proposed by Townsend and Heuberger (1943) . Plant-Growth Promotion The ability of strain 260-02 to promote growth of Solanum lycopersicum L. var. Sibari F1 (referred to as “tomato” in the rest of the study), and Capsicum annuum L. var Zebo F1 (referred to as “pepper” in the rest of the study) plants was assayed under greenhouse conditions. Fifteen days-old seedlings of both plant species were inoculated by root dipping with a PBS solution containing 10 5 CFU/ml of strain 260-02 or mock-inoculated using only PBS. The height of these plants, 7 per species per treatment, was monitored weekly over a period of 2 months and compared between treatments. The plants inoculated in this way were also used for biocontrol trials against different pathogens, described below. Biocontrol Against P. syringae pv. tomato DC3000 The tomato and pepper plants, either mock-treated or inoculated with strain 260-02, were inoculated by spraying a PBS cell suspension of the pathogen (10 5 CFU/ml) onto the plants leaves 2 weeks after the root-dip inoculation of bacteria. For each condition, 7 biological replicates were set up. Symptom development was monitored one and 2 weeks after inoculation with the pathogen, evaluated as the number of necrotic spots visible on the leaf surface, and compared with the non-treated control. Biocontrol Against Cymbidium Ring Spot Viru s The pepper plants, either mock-treated or inoculated with strain 260-02, were mechanically inoculated with Cymbidium Ring Spot Virus (CymRSV) 1 month after the root-dip inoculation of bacteria. Inoculum of the virus was obtained by grinding leaves of infected Nicotiana benthamiana plants in a 0.05 M phosphate buffer (pH 7, containing DIECA at 5 mM and EDTA at 1 mM). For each condition, 7 biological replicates were set up.
Show full methods section
Bacteria Isolation, Transformation and Cultivation In May 2012, as part of a survey on the apple proliferation disease caused by “ Candidatus Phytoplasma mali,” leaves were taken from apple trees ( Malus pumila Miller) at the Minoprio Foundation (Como, Italy) and endophytic bacteria were isolated from this material. Among the isolated strains was P. syringae pv. syringae strain 260-02. The plant showed no symptoms of the disease, and the pathogen was not detected by specific nested-PCR assays. Instead , P. syringae pv. tomato strain DC3000 was obtained from the collection of the University of Natural Resources and Life Sciences of Vienna (BOKU, Austria). Both strains were cultivated on LB High Salt Agar plates (tryptone 10 g/L, yeast extract 5 g/L, sodium chloride 10 g/L, agar 15 g/L) at 25°C, and were stored in a 20% glycerol solution at –80°C for long conservation periods. The strains were transformed with the integrative plasmid PUT gfp 2× ( Tombolini et al., 1997 ), carrying, as markers, the genes encoding for kanamycin resistance and the production of Green Fluorescent Protein. Several transformed colonies for strain DC3000 were compared to the wild-type to determine which ones had the most similar growth speed and behavior. The result of this protocol was the gfp -labeled strain, referred to in the manuscript as DC3000:: gfp . Since strain 260-02 did not express visible fluorescence after transformation with this method, it was transformed with the replicative plasmid pHM2-GFP ( Favia et al., 2007 ). The result of this protocol was the gfp -labeled strain, referred in the manuscript as 260-02: gfp . Fungi Isolation and Cultivation Strain MG53 of B. cinerea Pers. (BC) is used in fungal pathogen antagonism assays, the strain having been first isolated from wheat kernel in 2014. The strain was conserved in the fungal culture collection of the Mycology Laboratory at the Department of Agricultural and Environmental Sciences (DiSAA), University of Milan, Italy. The isolate was cultivated on potato dextrose agar (PDA, Difco TM ) at 20°C and stored at 4°C. Genome Sequencing and Assembly Genomic DNA was isolated from strain 260-02 as follows: the strain was cultivated in LB broth at 25°C overnight and the genomic DNA was extracted using GenElute TM Bacterial Genomic DNA Kit (Sigma-Aldich), following the manufacturer’s instruction. Genomic DNA was quantified with the Qubit dsDNA HS Assay kit (Life Technologies), purity and integrity were assessed with Nanodrop 1000 spectrophotometer (Thermo Fisher Scientific) and by agarose gel electrophoresis, respectively. Illumina libraries were produced starting from 1 μg of genomic DNA, which was sheared using the Covaris S220 instrument (Covaris Inc., Woburn, MA). Size selection of fragments 500 bp in length was conducted on agarose gel at 1.8% and libraries were produced using TruSeq DNA Sample Prep Kit (Illumina, San Diego, CA) according to manufacturer instructions. Sequencing was performed on a HiSeq1000 instrument with 100 × 2nt Pair end protocol using the TruSeq PE Cluster v3 kit (Illumina, San Diego, CA) according to manufacturer instructions. Illumina reads underwent a quality filtering process before being assembled de novo as follows: (1) low quality reads with more than 10% of undetermined bases (Ns) or with more than 50 bases called with a phred-scored basecall quality < 7 were filtered out; (2) reads were then de-duplicated using a custom in-house script; (3) sequencing adaptors were clipped with Scythe (version 0.994) using default parameters and low quality 3′ ends of reads were quality trimmed with Sickle using a quality threshold of 20 over a window of 10 bases and discarding reads under 25nt in length. Filtered reads were quality corrected with BayesHammer ( Nikolenko et al., 2012 ) and then assembled using SPAdes 2.9.0 ( Bankevich et al., 2012 ). Assembly was performed with multiple k-mer combinations in the 75 to 97 range, the best assembly occurring with k-mers 79, 83, 89, 91, 93: these showed the least fragmented sequences, the least number of contigs with the highest N50, mean and median scaffold lengths. The assembled sequences were investigated for putative assembled plasmid genomes by BLAST search, against the NCBI plasmid genomes database. Gene annotation was performed using the RAST web service, and the functional annotation of protein coding genes was improved with Blast2GO (ver. 2.8) ( Conesa et al., 2005 ). Gene clusters related to the production of secondary metabolites was predicted using the antiSMASH 3.0 online tool ( Weber et al., 2015 ). Phylogenesis Although running a BLAST of the full-length 16S rRNA gene sequence from the genome of 260-02 was sufficient to characterize the strain as P. syringae , more in-depth phylogenetic analyses were carried out. To discern the pathovar more similar to strain 260-02 a phylogenetic tree was computed, using a concatenated nucleotide sequence of the genes rpoD / gyrB ( Yamamoto et al., 2000 ) obtained from several complete genomes of bacteria from the Pseudomonas genus ( Supplementary Table S1 ). The species was also confirmed using the 40-markers approach of the software Phylosift ( Darling et al., 2014 ), and the average nucleotide identity among the full genomes of P. syringae ( Supplementary Table S1 ) was compared through ANI-MUMmer. The mangotoxin operon, a feature shared by strain 260-02, and its closest relative from the database, the strain UMAF0158, was also compared using a phylogenetic approach to determine similarity on the basis of a known pathogenesis-related function, focusing particularly on the amino acid sequence encoded by the gene mboE ( Supplementary Table S1 ). All the phylogenetic trees were obtained by aligning the sequences through the ClustalW algorithm, manually controlling the resulting alignments, and compiling the trees using MegaX software ( Kumar et al., 2018 ). Dual-Culture Inhibition Botrytis cinerea growth inhibition by the two bacterial strains was assessed through the dual-culture plate method described in Passera et al. (2017) . Briefly: droplets from an overnight liquid culture of either strain 260-02 or strain DC3000 (approximately 2 × 10 6 CFUs) were placed on four cellulose disks around the inside edge of a Petri dish containing a Tryptone Glucose Yeast Extract Agar medium (TGYA) – 5 g/L tryptone, 1 g/L glucose, 3 g/L yeast extract, 15 g/L agar. After 2 days of incubation, a BC plug (0.5 cm in diameter) was taken from actively growing mycelium of BC and was placed in the middle of the plate. As negative controls, plates containing (i) BC alone, (ii) BC with blank sterilized filter paper discs, and (iii) BC and discs inoculated with 20 μl of sterilized LB broth were used. Fungal growth, as mycelial growth diameter, was measured 5, 7, and 14 days post-inoculation (dpi). Each test was carried out with plates in triplicate and three independent measures were made for each plate at each measuring time. The Growth Inhibition Percentage (GIP) was calculated as [1–(D1/D2)] × 100, where D1 is the radial colony growth on the bacteria-treated plate, D2 is the radial colony growth on the control plate. Dual-Plate Inhibition To evaluate strains 260-02 and DC3000’s ability to inhibit fungal growth through the production of volatile compounds, a dual-plate assay was carried out ( Chaurasia et al., 2004 ). Briefly, 100 μl of an overnight strain of both the 260-02 and DC3000 cultures, in LB broth (approximately 10 7 CFU), were diffused on the surface of a TGYA plate and incubated at 25°C. After 2 days, a fungal mycelial plug (0.5 cm in diameter) was taken from actively growing mycelium of BC and was inoculated onto another TGYA plate. Under sterile conditions, the lid of the plate bearing the bacteria was replaced by the upturned plate containing the fungal inoculum, and the plates were sealed together with Parafilm. After fungal inoculation, all the plates were kept at 25°C in the dark, and the fungal growth was measured 14 dpi. Each test was made with plates in triplicate, three independent measures being made for each plate. The growth inhibition percentage, determined by volatile compounds (GIPv), was calculated as previously described. Production of Volatiles An analysis of the VOCs produced by strains 260-02 and DC3000 was carried out using a method that reproduces the dual-plate assay on the inside of a 20 ml headspace vial. Inside the vial, two layers of TGYA (described as before, except using 3% agar) were prepared on opposite sides of the vial, making sure that the layers did not touch one another. This permitted the inoculation of the different microorganisms on one layer, with no contact with the other. The vials were then sealed with a cap containing a membrane through which the extraction fiber was inserted, without coming into contact with the solid media or the microorganisms, only with the volatile compounds present in the space between the two. To test which volatiles were produced by the bacterial strain and by the fungal strain, the vials were prepared thus: (i) vials in which only strain 260-02, or strain DC3000, was growing, (ii) plates on which only BC was growing, (iii) vials in which both strain 260-02 and BC were growing, and (iv) vials with only TGYA medium, to be used as negative controls. The inoculation of both fungus and bacteria was carried out in quick succession, to avoid losing VOCs by opening the vial before the analysis. The vials, prepared in triplicates, were then closed with their cap and sealed with parafilm, and left in incubation at 25°C in the dark for 14 days before VOC analysis. This was performed using the Solid-Phase-Micro-Extraction technique, followed by Gas Chromatography-Mass Spectrometry (SPME-GC-MS). The VOCs were adsorbed on a Divinylbenzene/Carboxen/Polydimethylsiloxane (DVB/ CAR/PDMS) fiber and desorbed at 260°C in the injection port of an Agilent Technologies 6890N/5973N gas chromatograph-mass spectrometer equipped with a 60 m × 0.25 mm × 0.25 μm 100% polyethylene glycol column (Zebron ZB-WAX plus, Phenomenex). The carrier gas was helium, used in constant pressure mode (150 kPa). The oven was programmed at 45°C (5-min hold) and ramped up to 219°C at 6°C/min intervals (16-min hold). The transfer line to the mass spectrometer was maintained at 280°C, while the ion source was 230°C, and the quadrupole was 150°C. Acquisition was performed in electronic impact mode. VOCs were identified using the Wiley 7n-1 MS library on Agilent MSD ChemStation software (Agilent Technologies Inc.). Confirmation of the identity of the volatile compounds was achieved by comparing the GC retention indices and mass spectra of individual components with those of authentic reference compounds (Sigma-Aldrich Co.) under the same operating conditions. The data collected refer to the peak area of the quant ion of each compound, and are expressed as a natural logarithm, for this reason the determination must be considered semi-quantitative. Compounds were considered “absent” (i.e., not produced) when the signal to noise ratio was below 2:1. To check the presence of carry-over effects, blank extractions were conducted regularly. Inhibition by Filtrate To evaluate strains 260-02 and DC3000’s ability to inhibit fungal growth through non-volatile compounds secreted in the growth medium, an assay was carried out: TGYA plates containing the strain’s culture broth, previously purified of all cells, were prepared and used as substrate for the growth of the fungi, as described by Passera et al. (2017) . After 72 h of incubation, the liquid culture was purified of bacterial cells by centrifugation (6800 × g for 10 min) and filtration (0.2 μm pore size). The filtrate, at a final concentration of 50% v/v, was added to the TGYA medium to prepare the plates. To control the plate sterility, the plates were incubated at 25°C overnight and checked for bacterial growth. After preparing the plates with the culture filtrate, BC was inoculated under sterile conditions. The inoculum was a 0.5 cm diameter mycelial plug excised with a sterilized cork borer from the edges of an actively growing fungal culture. It was placed in the middle of the TGYA plates supplemented with filtrate. As negative control, TGYA plates, supplemented with sterile LB broth, were used for fungal culture. After fungal inoculation, all the plates were incubated at 25°C in the dark. Fungal growth was measured 14 dpi as mycelial growth diameter. Each test was carried out with plates in triplicate and three independent measures were made for each plate. Growth inhibition percentage from cultural filtrate (GIPf) was calculated as described previously. Biocontrol Against B. cinere a The ability of strains 260-02 and DC3000 to reduce infection from BC was evaluated in an experiment carried out on detached tomatoes in postharvest conditions. For this assay, ripe and healthy cherry tomatoes, grown organically in Italy and purchased in a local grocery, were used. Detached tomatoes of uniform size, free of visible blemishes, were surface sterilized in a 70% ethanol solution in water for 5 min, rinsed in water three times, and dried on filter paper under a laminar flow hood. After drying, the equatorial area of each was pierced 4 times by a needle. Bacterial strains 260-02 and DC3000 were inoculated singly by a 5 min soaking of each tomato in a bacterial suspension (approximately 10 6 CFUs/ml in Ringers solution, Sigma-Aldrich), and then left to dry on filter paper under a laminar flow hood. The BC conidia were inoculated by applying a 20 μl drop of conidial suspension (5 × 10 5 conidia/ml) into each puncture wound. For each treatment (non-treated, bacterial strains 260-02 or DC3000 alone, BC alone, bacterial strain 260-02 or DC3000 and BC) 10 tomatoes were put on a sterile ceramic tray in a glass chamber, containing a wet piece of filter paper to maintain a relative humidity of 95% inside the chamber, and incubated at 20°C in the dark. All the aforementioned procedures were carried out under sterile conditions. Each treatment was carried out in triplicate. The tomatoes were evaluated visually to determine fungal colonization at 7 days after inoculation. The results were expressed as visual classes, according to the scale presented in a previous work ( Vercesi et al., 2014 ). Visual classes were transformed into a percentage infection index (I%I) according to the formula proposed by Townsend and Heuberger (1943) . Plant-Growth Promotion The ability of strain 260-02 to promote growth of Solanum lycopersicum L. var. Sibari F1 (referred to as “tomato” in the rest of the study), and Capsicum annuum L. var Zebo F1 (referred to as “pepper” in the rest of the study) plants was assayed under greenhouse conditions. Fifteen days-old seedlings of both plant species were inoculated by root dipping with a PBS solution containing 10 5 CFU/ml of strain 260-02 or mock-inoculated using only PBS. The height of these plants, 7 per species per treatment, was monitored weekly over a period of 2 months and compared between treatments. The plants inoculated in this way were also used for biocontrol trials against different pathogens, described below. Biocontrol Against P. syringae pv. tomato DC3000 The tomato and pepper plants, either mock-treated or inoculated with strain 260-02, were inoculated by spraying a PBS cell suspension of the pathogen (10 5 CFU/ml) onto the plants leaves 2 weeks after the root-dip inoculation of bacteria. For each condition, 7 biological replicates were set up. Symptom development was monitored one and 2 weeks after inoculation with the pathogen, evaluated as the number of necrotic spots visible on the leaf surface, and compared with the non-treated control. Biocontrol Against Cymbidium Ring Spot Viru s The pepper plants, either mock-treated or inoculated with strain 260-02, were mechanically inoculated with Cymbidium Ring Spot Virus (CymRSV) 1 month after the root-dip inoculation of bacteria. Inoculum of the virus was obtained by grinding leaves of infected Nicotiana benthamiana plants in a 0.05 M phosphate buffer (pH 7, containing DIECA at 5 mM and EDTA at 1 mM). For each condition, 7 biological replicates were set up.
Severity of systemic infection
(I%S) was evaluated as a percentage defined as (SL/TL) * 100, where SL is the number of symptomatic leaves that were not mechanically inoculated, and TL is the total number of leaves that were not mechanically inoculated.
Colonization Assays
The ability of the analyzed strains to colonize plants from two different tissues that are important interfaces between plant and environmental microorganisms, root and leaf, was tested in planta using two Solanaceae plant crops: tomato and pepper. Seven-day old seedlings were inoculated by root dipping with a PBS solution containing 10 5 CFU/ml of either strain 260-02: gfp or of DC3000:: gfp to test the strains’ ability to colonize the roots. To describe the ability to colonize the leaves and induce symptoms of the strains, either wild-type or transformed, tomato and pepper plants fifteen-days old were sprayed with a PBS solution containing 10 5 CFU/ml of either strain 260-02, 260-02: gfp , DC3000, or DC3000:: gfp . As part of this assay, in order to visualize the biocontrol effect of the root inoculation of strain 260-02 against the establishment of DC3000 on leaves, and to clarify whether it was a strain-specific response or a general plant response to exposure to P. syringae , additional plants were sprayed with DC3000:: gfp on the leaves. These plants had been root-dipped in either a solution of strain DC3000 or strain 260-02 (as described above) 1 week before the foliar inoculation of the pathogen. For both root and leaf experiments, a mock-treated control inoculated with PBS containing no bacterial inoculum was performed. The treatments were carried out in five replicates for tomato plants, and three replicates for pepper plants. Both root and leaf samples were examined with a confocal microscope (Olympus FluoView FV1000 with multiline laser FV5-LAMAR-2 HeNe(G) and laser FV10-LAHEG230-2) after 3 and 6 days of inoculum. For the acquisition of GFP fluorescence, the filter settings were 488 nm excitation, 515 nm emission, while for the acquisition of autofluorescence from plant molecules (chlorophyll, phenolic compounds) ( Garcia-Plazaola et al., 2015 ) the filter settings were 594 nm excitation, 637 nm emission. For each treatment, five samples, either whole leaves or whole roots cleaned from soil, were excised from the plant with a scalpel, directly put on a glass slide and covered with a few drops of sterile PBS, with no further preparation. Absence of fluorescence ascribable to GFP in mock samples was evaluated as well to exclude the possibility of false positives. Furthermore, for leaf inoculation, development of symptoms was visually evaluated 3 and 6 days after inoculum. Each whole sample, either leaf or root, was visually examined at the microscope with epifluorescent light, in order to identify the portions of the sample that were suitable for capturing informative confocal microscopy pictures. The pictures taken from the abaxial surface of leaves of pepper and tomato plants inoculated with strain DC3000:: gfp , either treated with bacteria at the root or mock treated, were used for a quantitative analysis of bacterial presence on leaves. A full three-dimensional scan of different views was taken, collecting 50 to 100 images at different focal planes, spaced by the focal width in height, the number of frames was chosen to include all the leaf thicknesses in the recorded volume. After acquiring the three-dimensional fluorescence data the bidimensional maximum intensity projection (MIP) was reconstructed using the following simple algorithm, first proposed in medical imaging ( Wallis et al., 1989 ). Starting from the x - y - z intensity map, the maximum value of the z dependent intensity function was chosen for each x - y coordinate. For each MIP, the green pixels above the threshold, taken to be three times the average green intensity value, were counted and converted to an estimate of the surface colonization by bacteria (μm 2 ), using FIJI ( Schindelin et al., 2012 ) and Matlab 2018 (Mathworks Inc.) softwares. These values were then compared considering the three different treatments, based on the quantification of seven images per treatment.
Comparative Pangenome Analysis
After having determined from the phenotype that strain 260-02 has a plant-beneficial phenotype, a comparative analysis at the pangenome level was carried out to compare the genome of the genomic level that could explain this difference in phenotype. For this analysis, the genomes of a list of P. syringae strains, downloaded from NCBI ( Supplementary Table S1 ), and the genome of strain 260-02 were annotated with PROKKA software ( Seemann, 2014 ). After this step, performed for a homogeneous genome annotation, the genomes were compared using the software Roary ( Page et al., 2015 ). The main output of the software was a gene presence/absence table, which was manually examined to search for features that could be related to the different phenotypes of the bacterial strains.
Statistical Analysis
All data comparisons made in this study were verified with statistical analyses in order to ascertain the significance of the results. All statistical tests were carried out using the IBM SPSS v. 24 statistic package. Details of how each set of data was evaluated are reported in the caption of the figures illustrating the corresponding results.
Supplementary Material The Supplementary Material for this article can be found online at: https://www.frontiersin.org/articles/10.3389/fmicb.2019.01409/full#supplementary-material Click here for additional data file. Click here for additional data file. Click here for additional data file.
📊 Figures
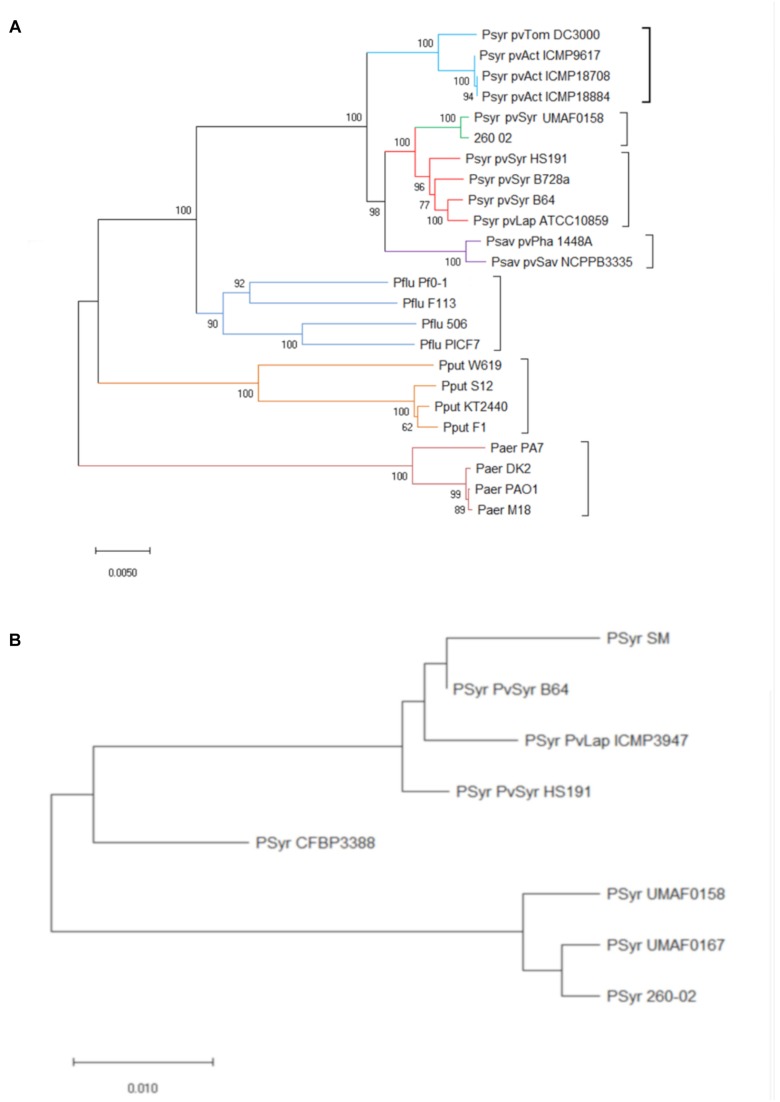
FIGURE 1
Phylogenetic positions of strain 260-02 in relation to other P. syringae strains. Organisms included in the analysis are reported as follows: Psyr for Pseudomonas syringae ; Psav for Pseudomonas savas...
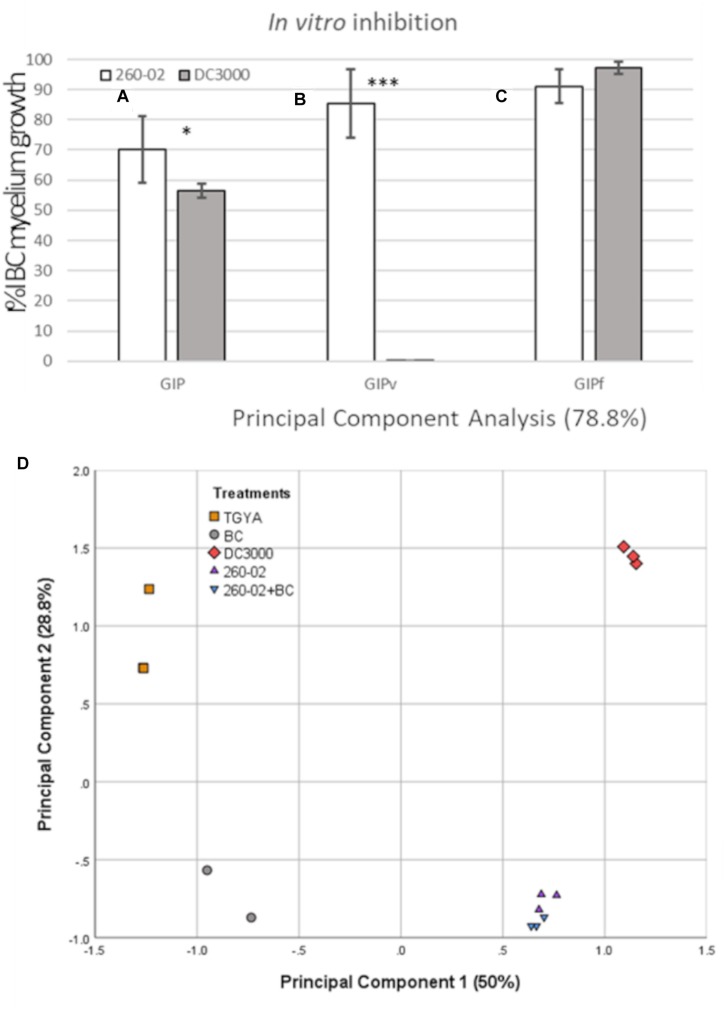
FIGURE 2
Results of the in vitro assays. Graph reporting on the Y axis the percentage of inhibition of Botrytis cinerea growth observed in panel (A) the dual-culture assay (GIP), (B) the dual-plate assay, meas...
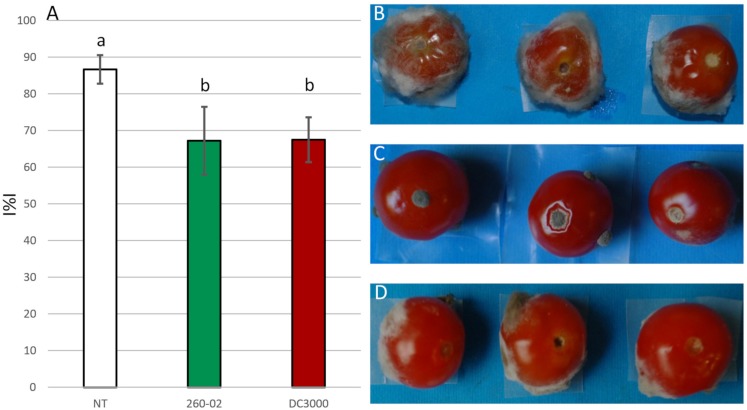
FIGURE 3
Results of the in vivo assays. (A) Graph reporting the percentage infection index (I%I) observed on tomatoes inoculated with BC alone (NT), or previously treated with either strain 260-02 or strain DC...
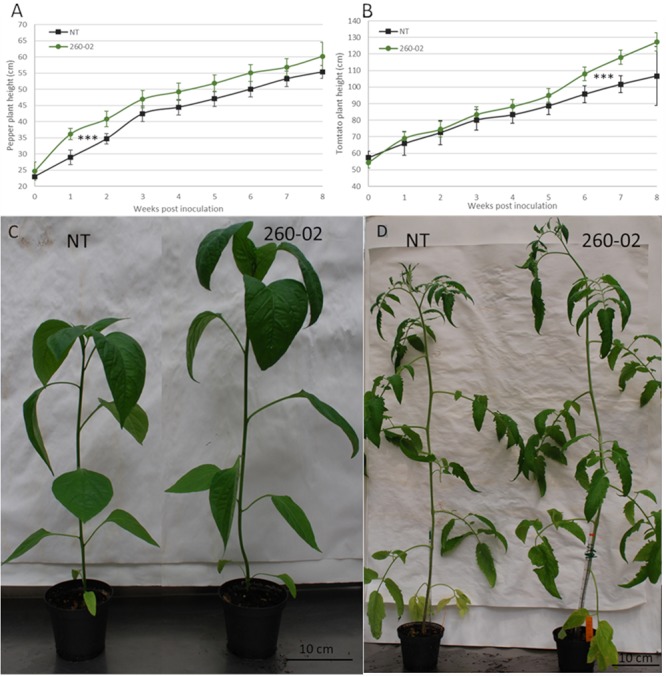
FIGURE 4
Results of the in planta PGP assay. Graphs reporting the average height of the plants, 7 replicates per treatment, either non-treated (NT), or treated by root dipping with strain 260-02, for panel (A)...
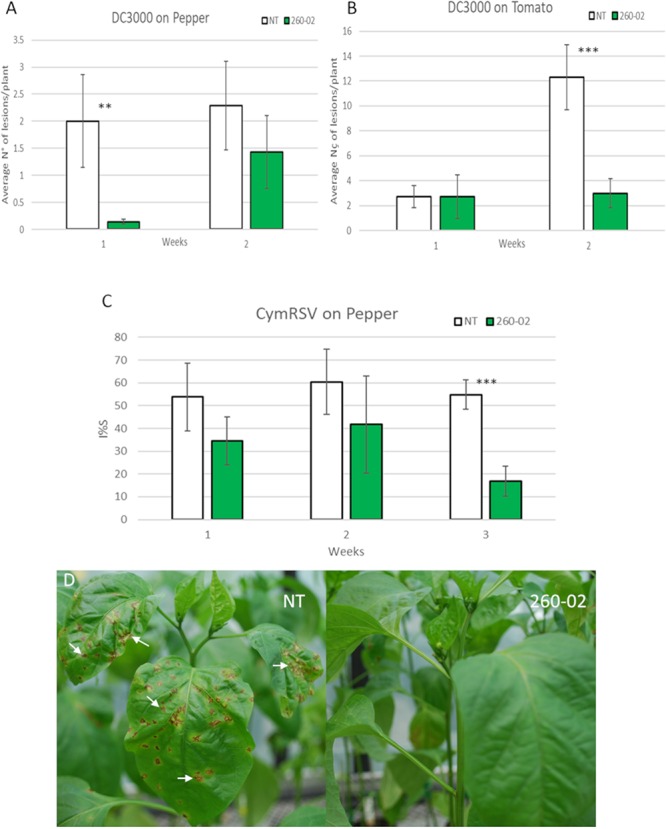
FIGURE 5
Results of the in planta biocontrol assays. Green bars indicate the plants that were treated with strain 260-02 by root dipping 2 weeks (for biocontrol against DC3000) or one month (for biocontrol aga...
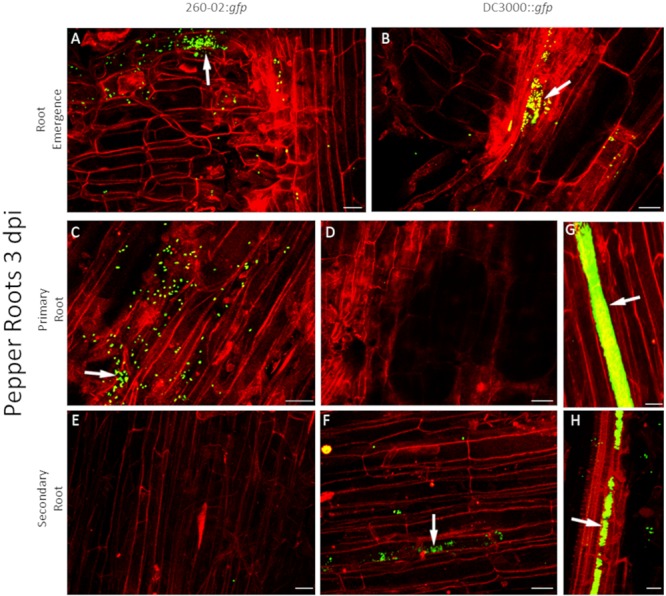
FIGURE 6
Confocal microscopy on pepper roots, 3 days after inoculation with bacterial strains. The panel shows representative pictures from the microscopy observations. In green is the fluorescence obtained by...
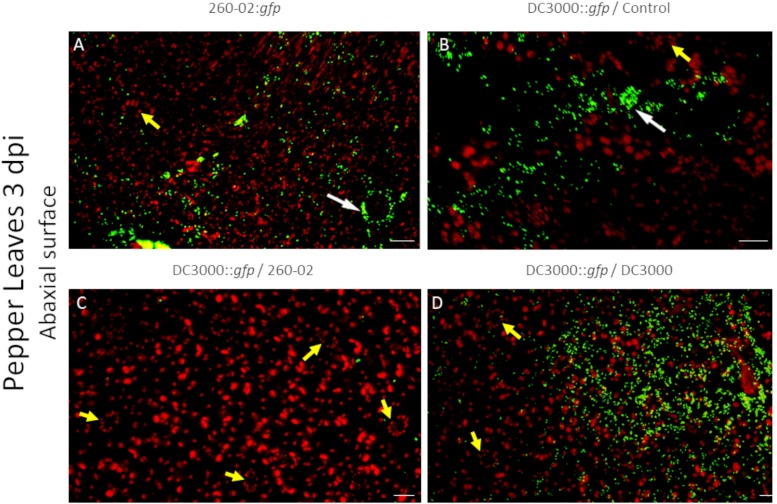
FIGURE 7
Confocal microscopy on the abaxial surface of pepper leaves at 3 dpi. The panel shows representative pictures from the microscopy observations. In green is the fluorescence obtained by exciting with a...
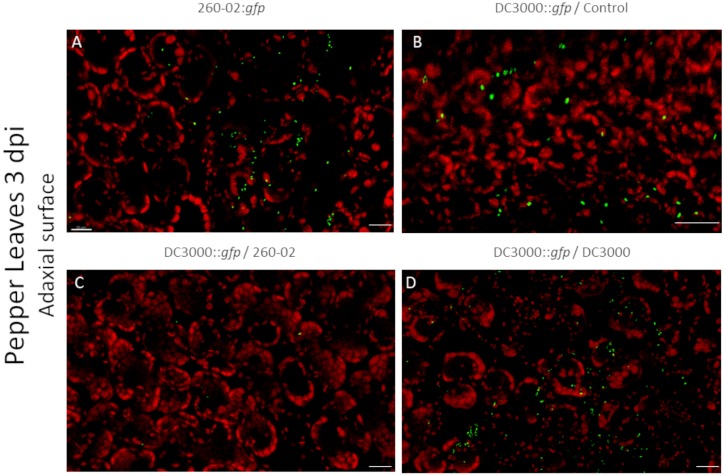
FIGURE 8
Confocal microscopy on the adaxial surface of pepper leaves at 3 dpi. The panel shows representative pictures from the microscopy observations. In green is the fluorescence obtained by exciting with a...
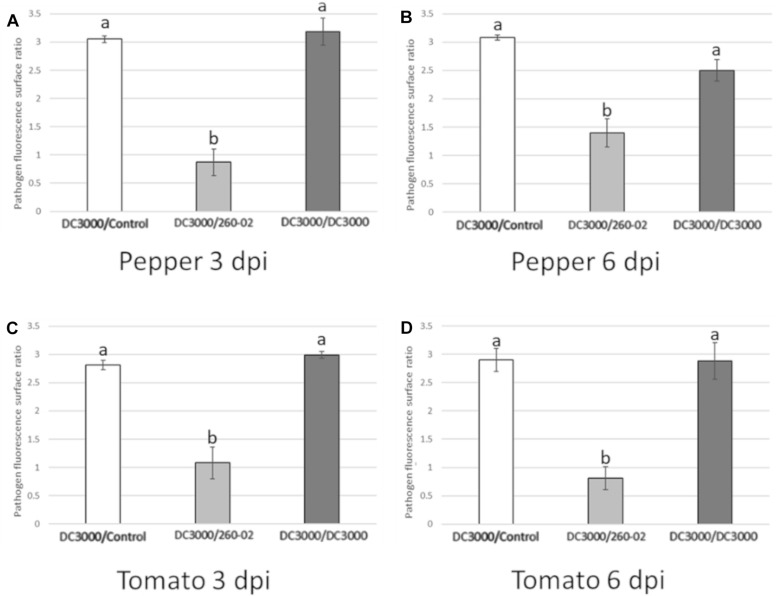
FIGURE 9
Charts reporting the results of the quantitative analyses of confocal microscopy pictures taken from the abaxial surface of leaves infected by DC3000:: gfp ( Figure 7 ) either with PBS root treatment ...
Figure images are served from the NIH/NLM PubMed Central Open Access Subset or Europe PMC; copyright remains with the publishers and authors.
💬 Discussion
0 commentsNo comments yet. Be the first to start a discussion!
Leave a Comment