Abstract
Time-lapse microscopy is routinely used to follow cells within organoids, allowing direct study of division and differentiation patterns. There is an increasing interest in cell tracking in organoids, which makes it possible to study their growth and homeostasis at the single-cell level. As tracking these cells by hand is prohibitively time consuming, automation using a computer program is required. Unfortunately, organoids have a high cell density and fast cell movement, which makes automated cell tracking difficult. In this work, a semi-automated cell tracker has been developed. To detect the nuclei, we use a machine learning approach based on a convolutional neural network. To form cell trajectories, we link detections at different time points together using a min-cost flow solver. The tracker raises warnings for situations with likely errors. Rapid changes in nucleus volume and position are reported for manual review, as well as cases where nuclei divide, appear and disappear. When the warning system is adjusted such that virtually error-free lineage trees can be obtained, still less than 2% of all detected nuclei positions are marked for manual analysis. This provides an enormous speed boost over manual cell tracking, while still providing tracking data of the same quality as manual tracking.
🔬 Techniques
💻 Software
✨ Fluorophores
🧪 Sample Preparation
💻 Software Details
💻 Code & Software
💾 Data Repositories
🏛️ Research Organizations (ROR)
Affiliated research institutions:
📊 Figures
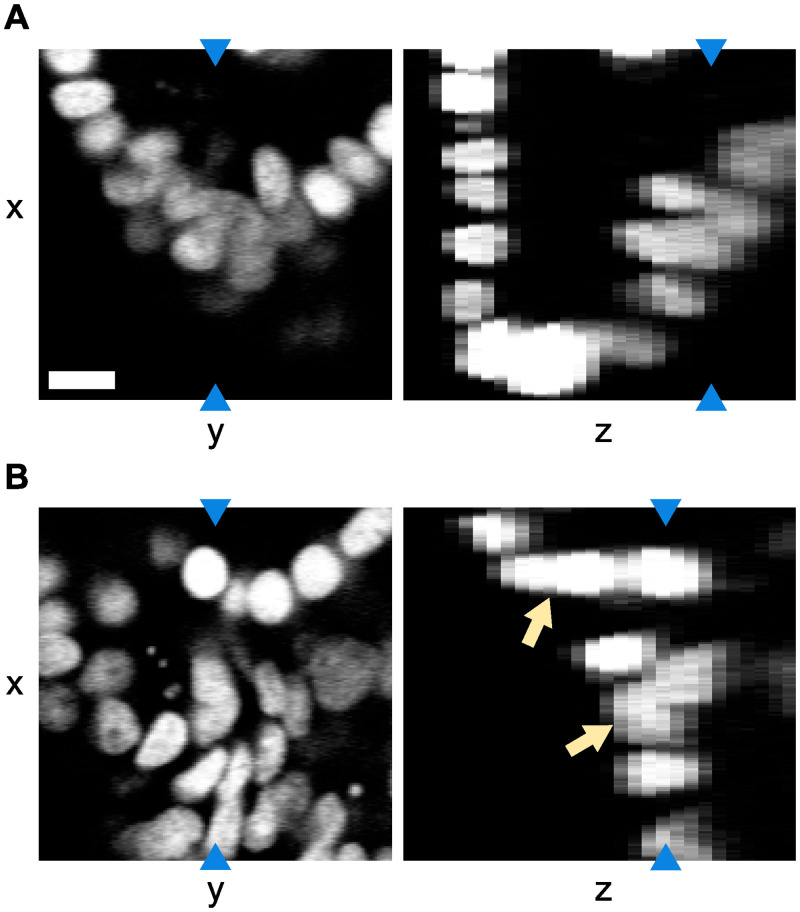
Fig 1
Example of a tracked organoid.
Microscopy image slices in the xy and xz planes using H2B-mCherry to visualize the cell nuclei. Blue arrows indicate that both image slices in the same panel represent the same pixels. Note that the r...
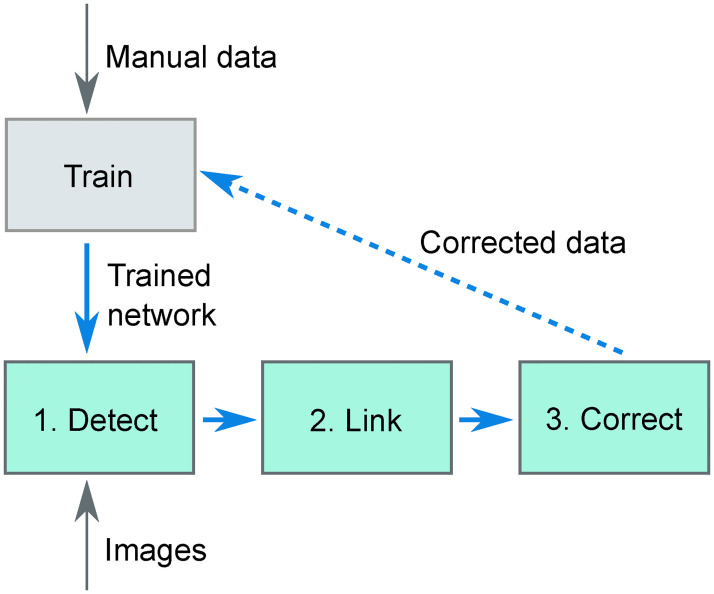
Fig 2
Overview of the tracking software.
Using ground-truth data of nucleus locations in microscopy images (obtained from manual detection) a convolutional neural network is trained. This trained network is then used to detect (step 1) cells...
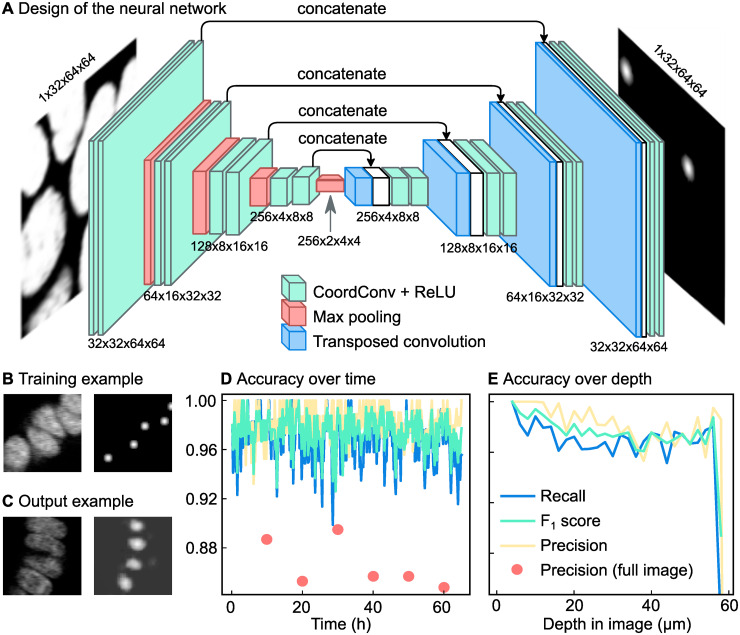
Fig 3
Automated detection of cell nuclei by a convolutional neural network.
( A ) Schematic overview of the network. The network is a standard convolutional network with absolute pixel coordinates added as input values. This makes it possible to adjust its detection network b...
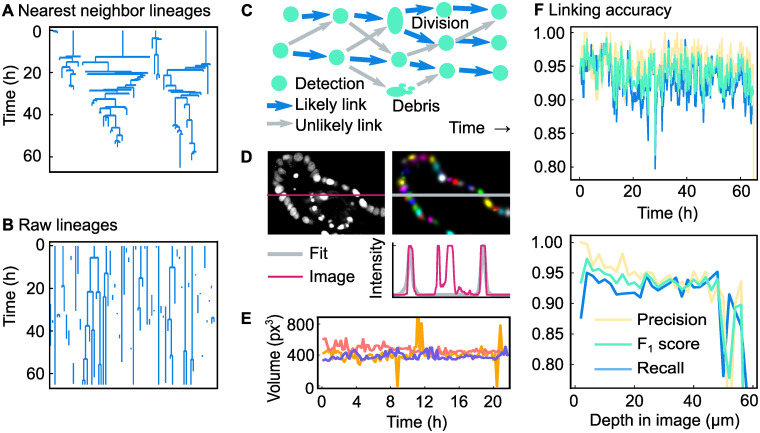
Fig 4
Overview and results of the linking algorithm.
( A ) Lineage trees obtained by linking using the nearest-neighbor method. ( B ) Raw lineage trees obtained by our linking algorithm. ( C ) Example of a network of links. There are many possibilities ...
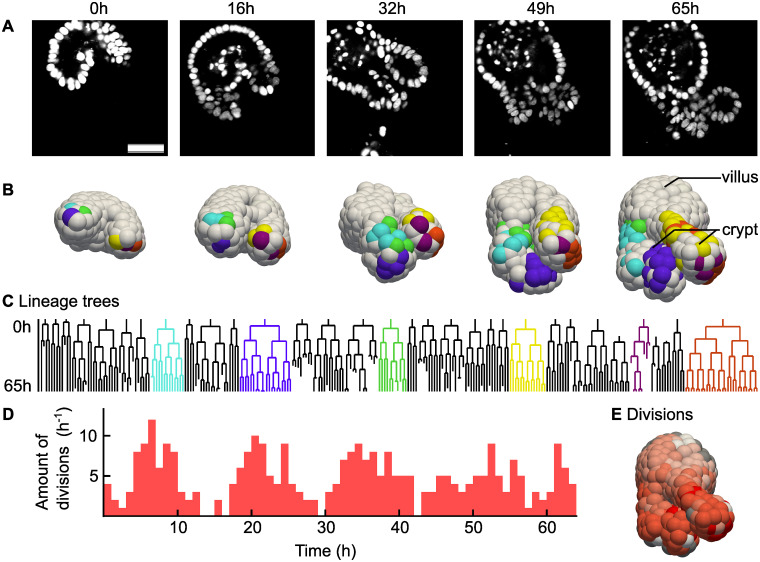
Fig 5
Analysis of a fully tracked organoid.
( A ) Single microscopy image slices of an intestinal organoid from a time lapse movie of 65 hours, in steps of 16.25 hours. H2B-mCherry was used to visualize the nuclei. Scale bar is 40 u03bcm.( B ) ...
Figure images are served from the NIH/NLM PubMed Central Open Access Subset or Europe PMC; copyright remains with the publishers and authors.
💬 Discussion
0 commentsNo comments yet. Be the first to start a discussion!
Leave a Comment