Abstract
In unicellular bacteria, the ParA and ParB proteins segregate chromosomes and coordinate this process with cell division and chromosome replication. During sporulation of mycelial Streptomyces , ParA and ParB uniformly distribute multiple chromosomes along the filamentous sporogenic hyphal compartment, which then differentiates into a chain of unigenomic spores. However, chromosome segregation must be coordinated with cell elongation and multiple divisions. Here, we addressed the question of whether ParA and ParB are involved in the synchronization of cell-cycle processes during sporulation in Streptomyces . To answer this question, we used time-lapse microscopy, which allows the monitoring of growth and division of single sporogenic hyphae. We showed that sporogenic hyphae stop extending at the time of ParA accumulation and Z-ring formation. We demonstrated that both ParA and ParB affect the rate of hyphal extension. Additionally, we showed that ParA promotes the formation of massive nucleoprotein complexes by ParB. We also showed that FtsZ ring assembly is affected by the ParB protein and/or unsegregated DNA. Our results indicate the existence of a checkpoint between the extension and septation of sporogenic hyphae that involves the ParA and ParB proteins.
🔬 Techniques
🧬 Organisms
💻 Software
✨ Fluorophores
🔬 Cell Lines
🏭 Microscope Brands
🧪 Reagent Suppliers
📷 Detectors
💻 Software Details
💾 Data Repositories
🏛️ Research Organizations (ROR)
Affiliated research institutions:
📋 Methods
2.1. DNA manipulations, bacterial strains and growth conditions DNA manipulation, culture conditions, antibiotic concentrations and conjugation or transformation methods followed standard procedures for Escherichia coli [ 35 ] and Streptomyces [ 36 ]. E. coli and S. venezuelae strains used in this study are listed in the electronic supplementary material, table S1. S. venezuelae was cultivated in MYM liquid medium and on MYM agar plates supplemented with 200 µl of trace element solution per 100 ml [ 36 ]. 2.2.
Construction of Streptomyces venezuelae mutant strains
Streptomyces venezuelae mutants were constructed using PCR targeting (electronic supplementary material, table S2), similar to the method described for S. coelicolor [ 37 ]. For strain construction details, see the electronic supplementary material. Conjugation from E. coli to S. venezuelae was performed as previously described [ 38 ]. All modified strains were verified by PCR and Southern and western blotting analyses to confirm gene deletions. 2.3.
Microscopy and image analysis
For microscopic observations, strains were grown for 16–18 h on coverslips inserted in minimal solid medium (MM) supplemented with 1% mannitol. Sample preparation for fluorescence microscopy was performed as described previously [ 30 ]. For DNA visualization, samples were incubated for 1 h at room temperature with DAPI and with WGA-Texas Red for cell wall staining. For time-lapse imaging, spore dilutions were spotted onto cellophane membranes on MM solid medium supplemented with 1% mannitol and cultured for 24–48 h before the start of the experiment. The cellophane membrane was transferred to a µ-dish ( Ø 35 mm, Ibidi) and covered with a block of agar [ 33 ]. To maintain a temperature of 30°C during the time-lapse experiments, the µ-dish was placed on the microscope stage in a temperature-controlled chamber. Fluorescence microscopy was carried out using a Zeiss Observer Z1 inverted microscope equipped with a Plan-Neofluar objective 100×/1.30 Oil and AxioCam MRm Camera. The Definite Focus feature was used to maintain the same focal position throughout the time course. Images were acquired using differential interference contrast (DIC) and fluorescence channels: EGFP (EX BP 470/40, BS FT 495, EM BP 525/50), DAPI (EX G 365, BS FT 395, EM BP 445/50), YFP (EX BP 500/25, BS FT 515, EM BP 535/30) and DsRed (EX BP 550/25, BS FT 570, EM BP 605/70). Images were acquired every 15 min using DIC and EGFP/YPet with exposure times of 10 and 1000 ms, respectively. Images were analysed using AXIOVISION or ZEN software (Zeiss). In the time-lapse analyses, approximately 30 hyphae were analysed from at least four independent experiments. Care was taken to ensure that the experiments using different strains were performed under the same conditions. The intensity of EGFP and YPet fluorescence was measured using the ‘profile’ function of ZEN 2012 software. A straight line was placed along the hyphae length. The corresponding background fluorescence was subtracted from the fluorescence measured for each hypha. The increase of the FtsZ-YPet and ParA-EGFP fluorescence was detected when the average value of the fluorescence intensity along the hyphae increased more than 10% over the fluorescence intensity in the same hyphae at earlier time points. The Z-ring fluorescence intensity was calculated as an average of the seven highest peaks present in the fluorescence profile (referring to the seven most representative Z-rings). Statistical analyses were performed using S tatistica (StatSoft Inc. 2011, v. 10, www.statsoft.com ). Because the assumption of normal distribution was violated, the non-parametric counterpart of ANOVA, the Kruskal–Wallis test, was applied for the comparisons of FtsZ-YPet fluorescence and parameters describing hyphae growth and length in the Streptomyces strains. For comparison of the TopA-depleted strain with the wild-type strain, unpaired Student's t -tests and Mann–Whitney tests were applied accordingly. Differences were considered significant when p -values were lower than 0.05. The average growth rate of each hypha was calculated as the slope of a line fitted to the relationship between the hypha length and growth time. Super-resolution three-dimensional (3D)-SIM imaging was performed with a V3 DeltaVision OMX 3D-SIM Blaze system (Applied Precision/GE Healthcare) equipped with a ×60/1.42 oil UPlanSApo objective (Olympus), 405 nm and 488 nm diode lasers and three sCMOS cameras (PCO). Each 3D-SIM stack was composed of 225 images (512 × 512 pixels) consisting of 15 z -sections (125 nm z -distance), with 15 images per z -section, the striped illumination pattern rotated to three angles (−60°, 0°, +60°) and shifted in five-phase steps. Acquisition settings were 100 ms exposure with a 488 nm laser (attenuated to 100% transmission). The reconstruction of 3D-SIM raw data were performed with S oft W o R x 6.0 (Applied Precision) using a Wiener filter setting of 0.002. Reconstructed image-stacks were 3D rendered and visualized using S oftworks and I mage J software. The fluorescence intensity along the Z-rings was measured using the profile function in I mage J software. 2.4.
Show full methods section
2.1. DNA manipulations, bacterial strains and growth conditions DNA manipulation, culture conditions, antibiotic concentrations and conjugation or transformation methods followed standard procedures for Escherichia coli [ 35 ] and Streptomyces [ 36 ]. E. coli and S. venezuelae strains used in this study are listed in the electronic supplementary material, table S1. S. venezuelae was cultivated in MYM liquid medium and on MYM agar plates supplemented with 200 µl of trace element solution per 100 ml [ 36 ]. 2.2.
Construction of Streptomyces venezuelae mutant strains
Streptomyces venezuelae mutants were constructed using PCR targeting (electronic supplementary material, table S2), similar to the method described for S. coelicolor [ 37 ]. For strain construction details, see the electronic supplementary material. Conjugation from E. coli to S. venezuelae was performed as previously described [ 38 ]. All modified strains were verified by PCR and Southern and western blotting analyses to confirm gene deletions. 2.3.
Microscopy and image analysis
For microscopic observations, strains were grown for 16–18 h on coverslips inserted in minimal solid medium (MM) supplemented with 1% mannitol. Sample preparation for fluorescence microscopy was performed as described previously [ 30 ]. For DNA visualization, samples were incubated for 1 h at room temperature with DAPI and with WGA-Texas Red for cell wall staining. For time-lapse imaging, spore dilutions were spotted onto cellophane membranes on MM solid medium supplemented with 1% mannitol and cultured for 24–48 h before the start of the experiment. The cellophane membrane was transferred to a µ-dish ( Ø 35 mm, Ibidi) and covered with a block of agar [ 33 ]. To maintain a temperature of 30°C during the time-lapse experiments, the µ-dish was placed on the microscope stage in a temperature-controlled chamber. Fluorescence microscopy was carried out using a Zeiss Observer Z1 inverted microscope equipped with a Plan-Neofluar objective 100×/1.30 Oil and AxioCam MRm Camera. The Definite Focus feature was used to maintain the same focal position throughout the time course. Images were acquired using differential interference contrast (DIC) and fluorescence channels: EGFP (EX BP 470/40, BS FT 495, EM BP 525/50), DAPI (EX G 365, BS FT 395, EM BP 445/50), YFP (EX BP 500/25, BS FT 515, EM BP 535/30) and DsRed (EX BP 550/25, BS FT 570, EM BP 605/70). Images were acquired every 15 min using DIC and EGFP/YPet with exposure times of 10 and 1000 ms, respectively. Images were analysed using AXIOVISION or ZEN software (Zeiss). In the time-lapse analyses, approximately 30 hyphae were analysed from at least four independent experiments. Care was taken to ensure that the experiments using different strains were performed under the same conditions. The intensity of EGFP and YPet fluorescence was measured using the ‘profile’ function of ZEN 2012 software. A straight line was placed along the hyphae length. The corresponding background fluorescence was subtracted from the fluorescence measured for each hypha. The increase of the FtsZ-YPet and ParA-EGFP fluorescence was detected when the average value of the fluorescence intensity along the hyphae increased more than 10% over the fluorescence intensity in the same hyphae at earlier time points. The Z-ring fluorescence intensity was calculated as an average of the seven highest peaks present in the fluorescence profile (referring to the seven most representative Z-rings). Statistical analyses were performed using S tatistica (StatSoft Inc. 2011, v. 10, www.statsoft.com ). Because the assumption of normal distribution was violated, the non-parametric counterpart of ANOVA, the Kruskal–Wallis test, was applied for the comparisons of FtsZ-YPet fluorescence and parameters describing hyphae growth and length in the Streptomyces strains. For comparison of the TopA-depleted strain with the wild-type strain, unpaired Student's t -tests and Mann–Whitney tests were applied accordingly. Differences were considered significant when p -values were lower than 0.05. The average growth rate of each hypha was calculated as the slope of a line fitted to the relationship between the hypha length and growth time. Super-resolution three-dimensional (3D)-SIM imaging was performed with a V3 DeltaVision OMX 3D-SIM Blaze system (Applied Precision/GE Healthcare) equipped with a ×60/1.42 oil UPlanSApo objective (Olympus), 405 nm and 488 nm diode lasers and three sCMOS cameras (PCO). Each 3D-SIM stack was composed of 225 images (512 × 512 pixels) consisting of 15 z -sections (125 nm z -distance), with 15 images per z -section, the striped illumination pattern rotated to three angles (−60°, 0°, +60°) and shifted in five-phase steps. Acquisition settings were 100 ms exposure with a 488 nm laser (attenuated to 100% transmission). The reconstruction of 3D-SIM raw data were performed with S oft W o R x 6.0 (Applied Precision) using a Wiener filter setting of 0.002. Reconstructed image-stacks were 3D rendered and visualized using S oftworks and I mage J software. The fluorescence intensity along the Z-rings was measured using the profile function in I mage J software. 2.4.
Chromatin immunoprecipitation and bioinformatics analysis
Chromatin immunoprecipitation assays followed by sequencing
(ChIP-seq) were performed as previously described by Al-Bassam et al . [ 39 ] with minor changes. Each strain was cultured in MYM medium supplemented with trace elements for an appropriate time (14 and 20 h for the wild-type, Δ parA , Δ parB::apra and Δ parAB strains; 30 h for the TopA depletion mutant). After cross-linking (formaldehyde added to a final concentration of 1% (v/v)) and lysis, the samples were sonicated for six to seven cycles (20 s each) to shear the chromosome into fragments ranging from 200 to 600 bp. The samples were centrifuged and pre-cleaned with Protein A Sepharose (Sigma). Then, 2 µg of purified polyclonal anti-ParB antibodies was added to each cell lysate, and the mixtures were incubated on a rotating wheel at 4°C overnight. Protein A Sepharose was added to cell lysates and incubated for the next 4 h. The samples were centrifuged, and the pellets were washed with IP buffer (50 mM Tris–HCl pH 8.0, 250 mM NaCl, 0.80% Triton, protease inhibitors) and eluted by overnight incubation at 65°C with IP elution buffer (50 mM Tris–HCl pH 7.6, 10 mM EDTA, 1% SDS). After centrifugation, the pellets were re-extracted with TE buffer (50 mM Tris–HCl pH 8.0, 10 mM EDTA), incubated with proteinase K (Roche) for 1.5 h at 55°C and extracted twice with phenol and once with chloroform. Finally, samples were purified with QiaQuick columns (Qiagen). For each immunoprecipitation sample, we used its corresponding input control of total DNA. DNA concentration was quantified using a NanoDrop spectrophotometer (ThermoScientific). Libraries were constructed and sequenced by the Karlsruher Institut für Technologie (KIT). Experiments were performed in duplicate. ChiP-seq sequence data were aligned (mapped) to the S. venezuelae chromosome using two aligners, Bowtie 1.1.1 and Novoalign 3.02.08 (Novocraft Technologies Sdn Bhd, www.novocraft.com ) [ 40 , 41 ]. With Bowtie, we selected options reporting only alignments in the best alignment ‘stratum’, that is, having the least number of mismatches, which was assumed to be one up to three. Using Novoalign, we applied a method reporting all alignment locations. SAMtools 1.1 and BEDTools 2.17 were used to manipulate the obtained files and convert formats [ 42 ]. To find peaks, that is, regions with significant numbers of mapped reads, we used Peak Finder MetaServer 1.3 (PFMS), which collects results from several peak finders and produces consensus peaks [ 43 ]. We applied three recommended peak finders: MACS 1.4.2 [ 44 ], CisGenome 2.0 [ 45 ] and SISSRs 1.4 [ 46 ]. Finally, Integrative Genomics Viewer (IGV) 2.3.40 [ 47 ] was used to visualize data. To search Streptomyces genomes for potential parS sequences, we constructed a position weight matrix (PWM) based on sequences (GTTTCACCTGAAAC) identified experimentally in S. coelicolor by Jakimowicz et al . [ 26 ]. Then, the PWM was used by the Motif Occurrence Detection Suite (MOODS), 1.0.2 [ 48 ] to find corresponding sequences in the Streptomyces chromosomes, which were downloaded from the GenBank database under accession numbers NC_003888 ( S. coelicolor ) and NC_018750 ( S. venezuelae ). The DNA walk method was used to visualize the A + T content along the chromosome [ 49 ].
📊 Figures
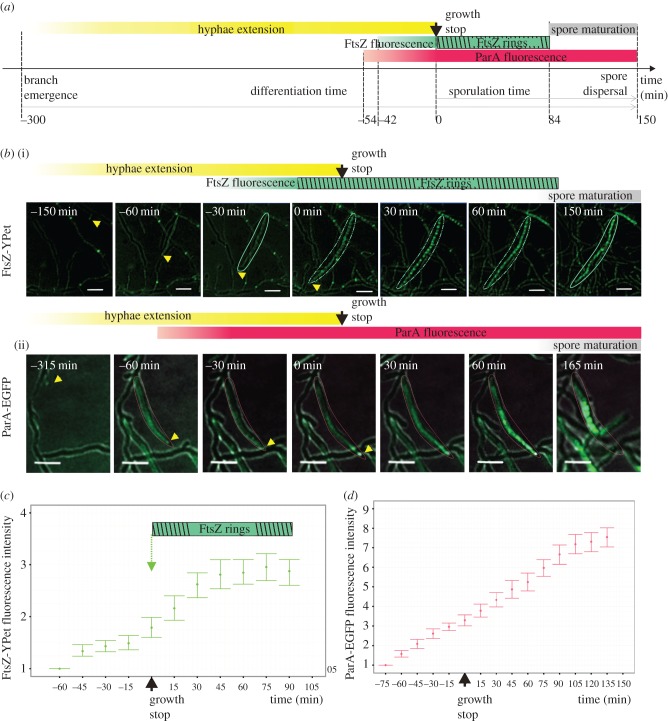
Figure 1.
Timing of sporogenic hyphae extension, FtsZ ring formation and ParA accumulation during S. venezuelae sporulation. ( a ) Scheme of hyphae differentiation stages. ( b ) Time-lapse snapshots showing exa...
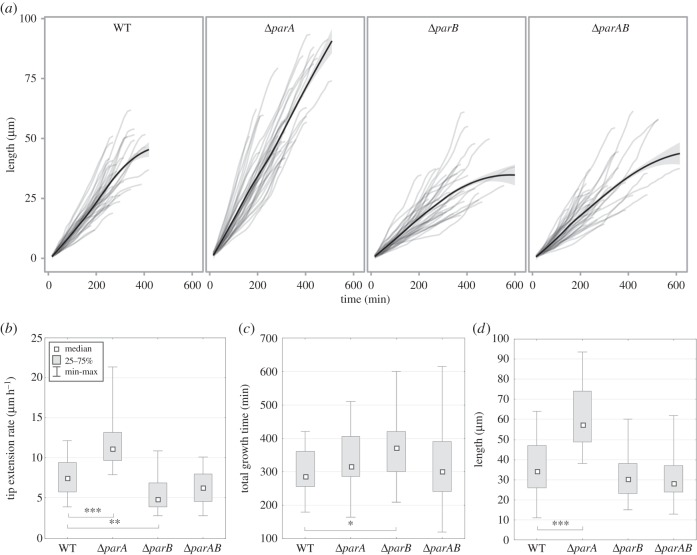
Figure 2.
The effect of segregation proteins ParA and ParB on the extension of sporogenic hyphae. ( a ) Plot of hyphae length over time in the wild-type (WT), u0394 parA , u0394 parB and u0394 parAB strains, ( ...
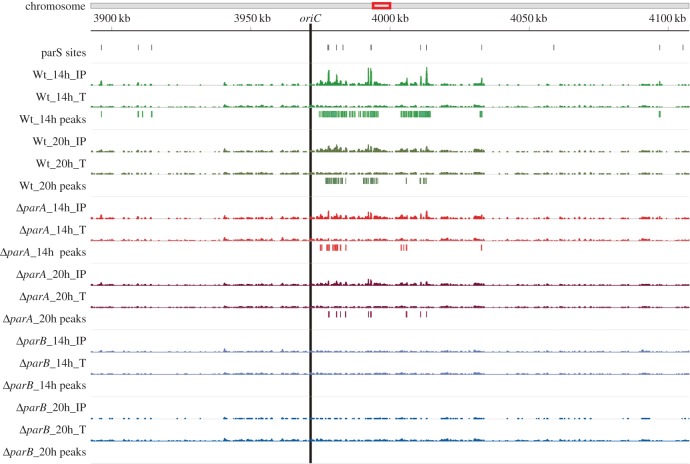
Figure 3.
ChIP-seq analysis of ParB binding to the S. venezuelae chromosome. Top: the red rectangle on the chromosome indicates the enlarged region shown below. In this region, from top to bottom, there are: po...
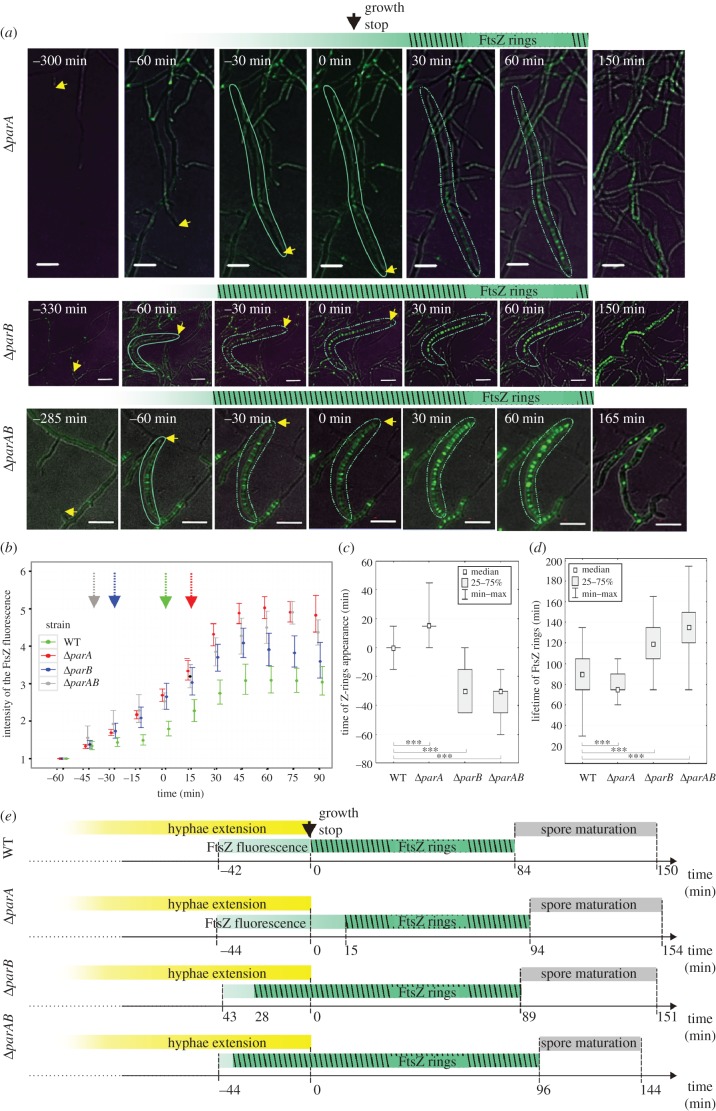
Figure 4.
Altered timing of Z-ring formation in the u0394 parA , u0394 parB and u0394p arAB strains. ( a ) FtsZ-YPet fluorescence in the wild-type, u0394 parA , u0394 parB and u0394 parAB strains. The yellow ar...
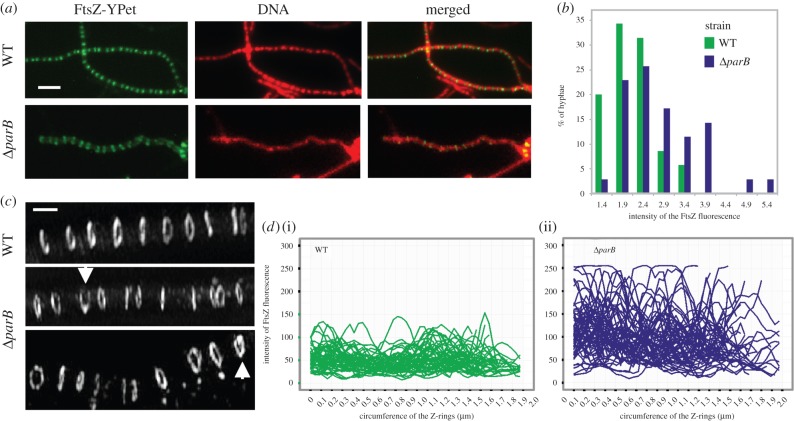
Figure 5.
Z-ring aberrations in the u0394 parB strain. ( a ) Examples of the hyphae with Z-rings and non-segregated DNA in the u0394 parB strain. Scale bar, 5 u00b5m. ( b ) Variation of the Z-ring intensity in ...
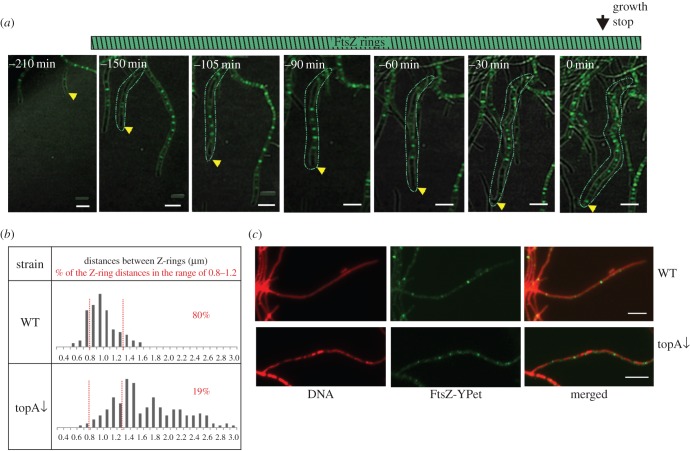
Figure 6.
Accelerated Z-ring formation in the TopA-depleted strain. ( a ) Images of sporulating hyphae in the TopA-depleted strain (time lapse). FtsZ-YPet fluorescence (green) merged with the DIC image. Yellow ...
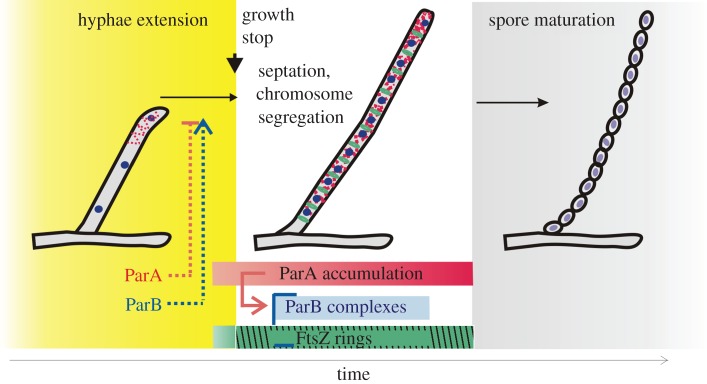
Figure 7.
Model showing the involvement of segregation proteins in the hyphae extension/septation checkpoint and the close link between ParB complexes and Z-ring formation at the time of growth cessation.
Figure images are served from the NIH/NLM PubMed Central Open Access Subset or Europe PMC; copyright remains with the publishers and authors.
💬 Discussion
0 commentsNo comments yet. Be the first to start a discussion!
Leave a Comment