Abstract
Bimolecular fluorescence complementation (BiFC) has been widely used to visualize protein-protein interactions (PPIs) in cells. Until now, however, the resolution of BiFC has been limited by the diffraction of light to ∼250 nm, much larger than the nanometer scale at which PPIs occur or are regulated. Cellular imaging at the nanometer scale has recently been realized with single molecule superresolution imaging techniques such as photoactivated localization microscopy (PALM). Here we have combined BiFC with PALM to visualize PPIs inside cells with nanometer spatial resolution and single molecule sensitivity. We demonstrated that PAmCherry1, a photoactivatable fluorescent protein commonly used for PALM, can be used as a BiFC probe when split between residues 159 and 160 into two fragments. PAmCherry1 BiFC exhibits high specificity and high efficiency even at 37°C in detecting PPIs with virtually no background from spontaneous reconstitution. Moreover, the reconstituted protein maintains the fast photoconversion, high contrast ratio, and single molecule brightness of the parent PAmCherry1, which enables selective PALM localization of PPIs with ∼18 nm spatial precision. With BiFC-PALM, we studied the interactions between the small GTPase Ras and its downstream effector Raf, and clearly observed nanoscale clustering and diffusion of individual KRas G12D/CRaf RBD (Ras-binding domain) complexes on the cell membrane. These observations provided novel insights into the regulation of Ras/Raf interaction at the molecular scale, which would be difficult with other techniques such as conventional BiFC, fluorescence co-localization or FRET.
🔬 Techniques
🔭 Microscopes
✨ Fluorophores
🧪 Sample Preparation
🔬 Cell Lines
🏭 Microscope Brands
🧪 Reagent Suppliers
💻 Software Details
🏛️ Research Organizations (ROR)
Affiliated research institutions:
📋 Methods
Cloning
We used the In-Fusion HD Cloning kit (639649, Clontech) to generate genetic fusions in the pENTR (Life Technologies) backbone, and the Gateway LR Clonase II kit (11791, Life Technologies) to shuttle the resulting fusion constructs from the entry clones to expression clones. We have used both the pcDNA3 or a lentiviral backbone (pLenti-puro-CMV/TO, 17293, Addgene) for the expression clones. PCR fragments used for In-Fusion reactions were generated using the Phusion High-Fidelity DNA Polymerase (M0530, New England Biolabs). For all fusion constructs used in this study, a flexible (GGGGS) 2 linker was genetically inserted between the PAmCherry1 fragments and the target protein. In generating the inducible heterodimerization constructs, N-Myr signal and a single DmrA domain were subcloned from pHet-Mem1, and a DmrC domain was subcloned from pHet1, both plasmids in the iDimerize Inducible Heterodimer System (635067, Clontech). KRas G12D and CRaf RBD (residues 51–131) were both subcloned from plasmids used in a previous study [14] . The RBD R89L mutation was introduced through site-directed mutagenesis.
Cell culture and transfection
U2OS cells (HTB-96, ATCC) were cultured at 37°C and 5% CO 2 in DMEM supplemented with 10% FBS (11995 and 10082 respectively, Life Technologies). Cells were plated in phenol red-free DMEM (21063, Life Technologies) supplemented with 10% FBS on a #1.5 Lab-Tek chamber slide (155409, Thermo Scientific) for PALM imaging after fixation, or a 0.17 mm coverslip bottom Delta T Dish (04200417, Bioptechs) for live cell imaging. Plasmids for the artificial dimerization system were transiently transfected using X-tremeGENE HP (13873800, Roche) as described by the manufacturer. Dimerization was induced by adding 500 nM A/C Heterodimerizer (635057, Clontech) and incubating at 37°C for 2 hours or overnight as indicated. KRas G12D and CRaf RBD constructs were introduced into the cells by lentiviral infection using the ViraPower packaging system (K497500, Life Technologies). For PALM imaging, cells were fixed in fresh 3.7% PFA with 0.1% glutaraldehyde for 15 minutes at room temperature and changed to imaging buffer (100 mM Tris with 30 mM NaCl and 20 mM MgCl 2 , pH 8.5) after fixation. Gold particles (100 nm, EM.GC100, BBI International) were added as fiducial markers to correct for stage drift during imaging.
Show full methods section
Cloning
We used the In-Fusion HD Cloning kit (639649, Clontech) to generate genetic fusions in the pENTR (Life Technologies) backbone, and the Gateway LR Clonase II kit (11791, Life Technologies) to shuttle the resulting fusion constructs from the entry clones to expression clones. We have used both the pcDNA3 or a lentiviral backbone (pLenti-puro-CMV/TO, 17293, Addgene) for the expression clones. PCR fragments used for In-Fusion reactions were generated using the Phusion High-Fidelity DNA Polymerase (M0530, New England Biolabs). For all fusion constructs used in this study, a flexible (GGGGS) 2 linker was genetically inserted between the PAmCherry1 fragments and the target protein. In generating the inducible heterodimerization constructs, N-Myr signal and a single DmrA domain were subcloned from pHet-Mem1, and a DmrC domain was subcloned from pHet1, both plasmids in the iDimerize Inducible Heterodimer System (635067, Clontech). KRas G12D and CRaf RBD (residues 51–131) were both subcloned from plasmids used in a previous study [14] . The RBD R89L mutation was introduced through site-directed mutagenesis.
Cell culture and transfection
U2OS cells (HTB-96, ATCC) were cultured at 37°C and 5% CO 2 in DMEM supplemented with 10% FBS (11995 and 10082 respectively, Life Technologies). Cells were plated in phenol red-free DMEM (21063, Life Technologies) supplemented with 10% FBS on a #1.5 Lab-Tek chamber slide (155409, Thermo Scientific) for PALM imaging after fixation, or a 0.17 mm coverslip bottom Delta T Dish (04200417, Bioptechs) for live cell imaging. Plasmids for the artificial dimerization system were transiently transfected using X-tremeGENE HP (13873800, Roche) as described by the manufacturer. Dimerization was induced by adding 500 nM A/C Heterodimerizer (635057, Clontech) and incubating at 37°C for 2 hours or overnight as indicated. KRas G12D and CRaf RBD constructs were introduced into the cells by lentiviral infection using the ViraPower packaging system (K497500, Life Technologies). For PALM imaging, cells were fixed in fresh 3.7% PFA with 0.1% glutaraldehyde for 15 minutes at room temperature and changed to imaging buffer (100 mM Tris with 30 mM NaCl and 20 mM MgCl 2 , pH 8.5) after fixation. Gold particles (100 nm, EM.GC100, BBI International) were added as fiducial markers to correct for stage drift during imaging.
Microscopy and data analysis
PALM imaging and tracking was performed on a Nikon Ti-U inverted microscope equipped with a Nikon 60× APO TIRF objective (NA = 1.49) using µManager [15] . Static PALM images were acquired at room temperature. Total internal reflection (TIR) illumination was used in all PALM imaging experiments. PALM image reconstruction was performed using home-written scripts in MatLab (Mathworks, MA). Ripley's K-test and cluster analysis were described previously [14] , [16] . To quantify BiFC signal, multiple (4–10 as indicated in the text) random fields of view each containing a few cells were imaged in epi-fluorescence mode before and immediately after a pulse (∼1 s) of high 405 nm illumination (125 W/cm 2 ). Fluorescence from cells with clear photoactivation signals above a threshold was averaged and adjusted for background. For the comparison between wild type CRaf RBD and the R89L mutant, we averaged the fluorescence intensities across the entire field of view because most of the cells with CRaf R89L were dim and had signal levels only slightly above background. Single molecule tracking experiments were performed at 37°C using a temperature-controlled sample stage (Delta-T, Bioptech). Trajectory analyses were performed using home-written scripts in MatLab (Mathworks, MA). Localizations of molecules in neighboring frames were joined into diffusion trajectories based on spatial proximity, similar to previously reported [17] . Only molecules that lasted at least two frames were used to reconstruct diffusion trajectories. At 50 ms exposure time, we set the maximum distance allowed for a molecule to travel per frame at 500 nm (4 pixels) to avoid falsely connecting localizations of two different molecules into a diffusion trajectory. This is equivalent to a maximum diffusion constant of 1.39 µm 2 /s. Trajectory analysis with variational Bayes single particle tracking (vbSPT) was performed using the MatLab scripts ( http://sourceforge.net/projects/vbspt/ ) provided by the authors [18] .
Supporting Information Figure S1 Sequence alignment between mCherry and PAmCherry1. (a) Partial amino acid alignment with residues 159/160 boxed; (b) Graphical comparison of the nucleotide sequences with the codon for residue 159 marked in green. (TIF) Click here for additional data file. Figure S2 Four test configurations for PAmCherry1 BiFC with DmrA/DmrC. Plasmid combinations as indicated in the four panels were transiently transfected into U2OS cells. After 24 hours, the cells were incubated in 500 nM heterodimerizer overnight, then washed and fixed for imaging. DmrA and DmrC are dimerizing domains, RN = PAmCherry1 N-terminal residues 1–159, RC = PAmCherry1 C-terminal residues 160–236. All images were acquired in TIRF mode with moderate 405 nm laser illumination. (TIF) Click here for additional data file. Figure S3 Testing the reversibility of PAmCherry1 BiFC. U2OS cells transiently transfected with DmrA-RC and RN-DmrC were treated with heterodimerizer for 2 hours at 37°C prior to imaging. Cells in one chamber (left) were fixed immediately, and those in another chamber (middle) were incubated for another 2 hours in growth media at 37°C without the heterodimerizer before fixation. No significant difference was observed in BiFC signal intensities between the two samples (right, n = 3). (TIF) Click here for additional data file. Figure S4 Estimating the dark state life time ( T off ) of BiFC-PAmCherry1. We use a similar approach as described in Annibale et al. (ref 22) to estimate the T off of PAmCherry1 reconstituted by BiFC. Briefly, the total number of molecules in the final reconstructed PALM image is a function of maximum allowed dark period ( T d ). The greater T d is the smaller number of molecules remain in the final PALM image because more localization events are combined despite that they are separated by dark periods. This is reflected in the blue curve, where an initial, sharp decrease in the remaining fraction of molecules is followed by a second, slower decrease. The initial phase of the decrease is primarily due to the correction of molecular blinking, i.e., the molecules transiently entering dark states. As T d becomes much larger than T off , emission events from different molecules residing in the same pixel start to get combined resulting in further decrease in the number of molecules. We found that the first 7 points ( T d up to ∼1 s ) gave the best fit to a single exponential (R = 0.996); from this fitting (red curve), we obtained T off ∼0.26±0.05 s . (TIF) Click here for additional data file. Figure S5 Superresolution imaging of DmrA/DmrC complex with BiFC-PALM. The BiFC configuration used was DmrA-RC/RN-DmrC, where RN and RC are PAmCherry1 fragments split at site 159. (a) PALM image of a cell expressing the BiFC pair; (b) Zoomed-in view of the boxed area in (a); (c) Low-resolution representation of (b). (TIF) Click here for additional data file. Figure S6 PAmCherry1 BiFC to visualize KRas G12D/CRaf RBD interaction. TIRF images for the four BiFC configurations between KRas G12D and CRaf RBD, each fused with PAmCherry1 fragments RN or RC (split at site 159). U2OS cell lines stably expressing RN-KRas G12D (top panels) or RC-KRas G12D (bottom panels) were generated. RC-CRaf RBD or CRaf RBD-RC was then introduced into either cell line via lentiviral infection ∼24 hours prior to imaging. RN-KRas G12D/CRaf RBD-RC (upper right) was used for Fig. 3B, D and E . (TIF) Click here for additional data file. Figure S7 Effect of the RBD R89L mutation on BiFC of RN-KRas G12D and CRaf RBD-RC. U2OS cells stably expressing RN-KRas G12D were infected with lentivirus bearing wildtype CRaf RBD-RC (left) or the CRaf RBD R89L-RC mutant (right) and fixed ∼24 hours post infection. (TIF) Click here for additional data file. Figure S8 Single molecule tracking of individual KRas G12D/CRaf RBD complexes. Live U2OS cells expressing RN-KRas G12D and CRaf RBD-RC were imaged with smt-PALM at 37°C and 50 ms time resolution. Individual molecules were localized and the diffusion trajectories were inferred from the locations of the same molecule in consecutive frames. The trajectories are randomly color-coded for easy distinction. (TIF) Click here for additional data file. Table S1 PCR Primers used in this study. (DOCX) Click here for additional data file. Video S1 BiFC-reconstituted PAmCherry1 showing fast photoconversion and high contrast ratio. Fixed U2OS cells with BiFC-reconstituted PAmCherry1 were imaged with a 561 nm laser under low power 405 nm activation (2.5–10 W/cm 2 ). (AVI) Click here for additional data file. Video S2 Live cell smt-PALM. Live U2OS cells expressing RN-KRas G12D and CRaf RBD-RC were imaged at 37°C and 50 ms time resolution with a 561 nm laser under low power 405 nm activation (2.5 W/cm 2 ). Circles indicate molecules being tracked. (AVI) Click here for additional data file.
📊 Figures
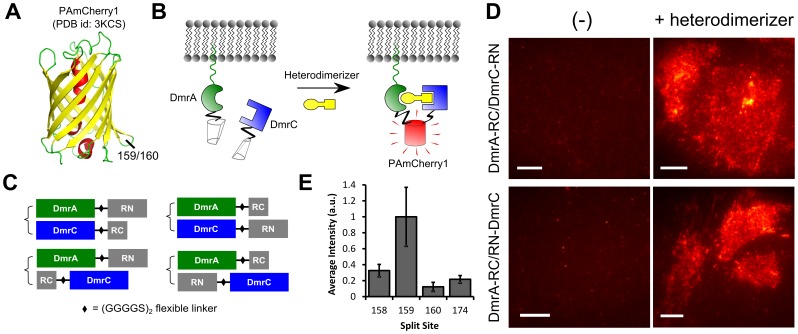
Figure 1
Split PAmCherry1 for BiFC.
(A) Crystal structure of PAmCherry1 with the 159/160 split site for BiFC indicated. The site is located between beta sheets 7 and 8; (B) Artificial dimerization system for testing PAmCherry1 BiFC. Non...
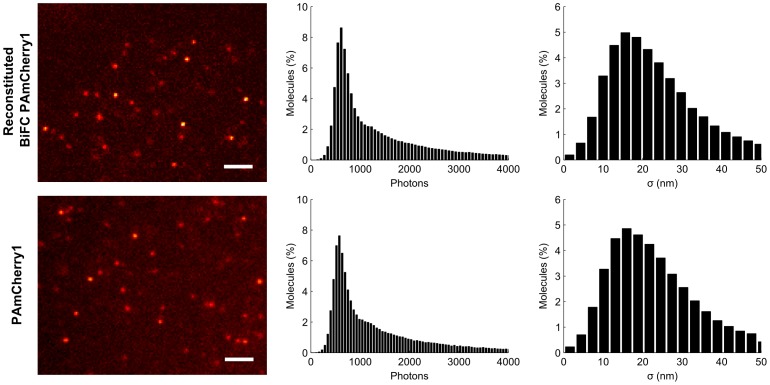
Figure 2
Reconstituted PAmCherry1 shows similar photophysical properties as the original PAmCherry1.
U2OS cell expressing RN-KRas G12D and CRaf RBD-RC were imaged next to cells expressing KRas G12D fused to PAmCherry1. Examples of single molecule images are shown with photon and localization precisio...
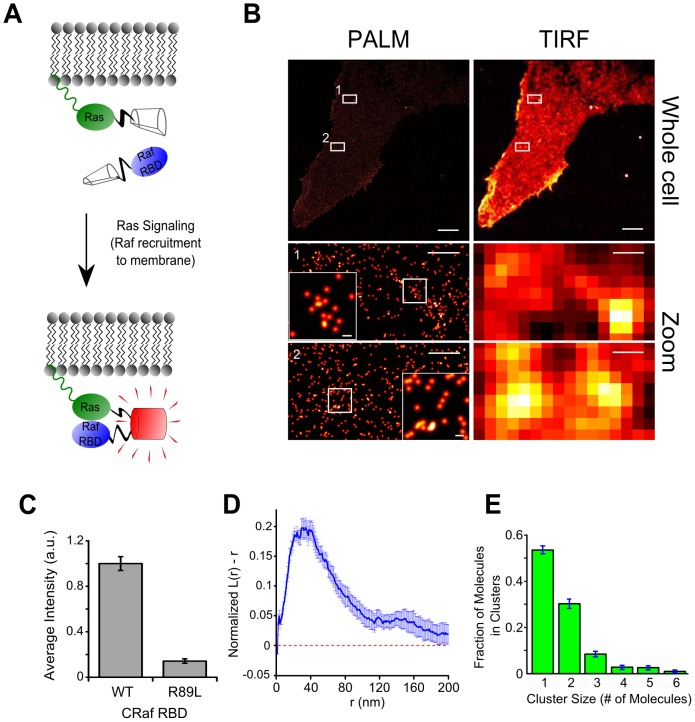
Figure 3
BiFC-PALM imaging and analysis of individual KRas G12D/CRaf RBD complexes.
(A) For BiFC, KRas G12D and CRaf RBD (CRaf residues 51u2013131) were fused to PAmCherry1 fragments. Interaction between CRaf RBD and active KRas G12D on the membrane brings the two fragments into prox...
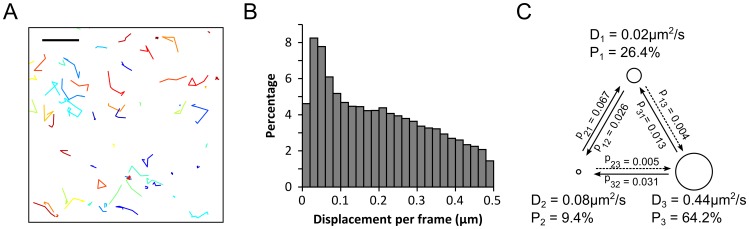
Figure 4
Single-molecule tracking of individual KRas G12D/CRaf RBD complexes.
(A) Displacement trajectories of PAmCherry1-tagged KRas G12D/CRaf RBD BiFC complexes showcasing immobile molecules (small trajectory areas) and mobile molecules (large trajectory areas) from a single ...
Figure images are served from the NIH/NLM PubMed Central Open Access Subset or Europe PMC; copyright remains with the publishers and authors.
💬 Discussion
0 commentsNo comments yet. Be the first to start a discussion!
Leave a Comment