Abstract
Glutathione (GSH) plays an important role in maintaining redox homeostasis inside cells. Currently, there are no methods available to quantitatively assess the GSH concentration in live cells. Live cell fluorescence imaging revolutionized the field of cell biology and has become an indispensable tool in current biological studies. In order to minimize the disturbance to the biological system in live cell imaging, the probe concentration needs to be significantly lower than the analyte concentration. Because of this, any irreversible reaction-based GSH probe can only provide qualitative results within a short reaction time and will exhibit maximum response regardless of the GSH concentration if the reaction is completed. A reversible reaction-based probe with an appropriate equilibrium constant allows measurement of an analyte at much higher concentrations and, thus, is a prerequisite for GSH quantification inside cells. In this contribution, we report the first fluorescent probe-ThiolQuant Green (TQ Green)-for quantitative imaging of GSH in live cells. Due to the reversible nature of the reaction between the probe and GSH, we are able to quantify mM concentrations of GSH with TQ Green concentrations as low as 20 nM. Furthermore, the GSH concentrations measured using TQ Green in 3T3-L1, HeLa, HepG2, PANC-1, and PANC-28 cells are reproducible and well correlated with the values obtained from cell lysates. TQ Green imaging can also resolve the changes in GSH concentration in PANC-1 cells upon diethylmaleate (DEM) treatment. In addition, TQ Green can be conveniently applied in fluorescence activated cell sorting (FACS) to measure GSH level changes. Through this study, we not only demonstrate the importance of reaction reversibility in designing quantitative reaction-based fluorescent probes but also provide a practical tool to facilitate redox biology studies.
🔬 Techniques
🔭 Microscopes
✨ Fluorophores
🧪 Sample Preparation
🔬 Cell Lines
🏭 Microscope Brands
🧪 Reagent Suppliers
📷 Detectors
🏛️ Research Organizations (ROR)
Affiliated research institutions:
📋 Methods
Materials All the chemicals were purchased from Sigma-Aldrich and Alfa Aesar unless otherwise specified. All solvents and reagents were used as obtained without further purification. Polystyrene beads (4.5 μm, catalog # 17135–5) were purchased from Polysciences Inc. All the organelle specific dyes were purchased from Thermo Fisher Scientific Inc.
Instrumentation
NMR spectra were recorded on a Varian NMR ( 1 H at 400 MHz) spectrometer. Chemical shifts (δ) were given in parts per million with reference to solvent signals [ 1 H NMR: CDCl 3 (7.26), CD 3 OD (3.31)]. UV–vis measurements were performed with a 2 × 10 mm quartz cuvette in a Cary 60 UV–vis spectrometer. Fluorescence measurements were performed with the same quartz cuvette in a Cary Eclipse fluorescence spectrophotometer with an excitation slit of 5 nm, an emission slit of 10 nm, and PMT at 650 V. Flash chromatography was performed on a Teledyne ISCO CombiFlashRf200. HPLC measurements were performed on Agilent Infinity 1200 HPLC with inline diode array and ESI-MS detectors. An Olympus FV1000 laser scanning confocal microscope system was used for cell imaging. ESI mass spectrometry was measured on a BrukerMS microTOF ESI, at the Shared Equipment Authority at Rice University. Flow cytometry was performed on BD LSR II Flow Cytometer at BCM core facilities.
Chemical Synthesis and Characterization
Refer to the SI for details.
Determination of Equilibrium Constant of TQ
Green and GSH Reaction TQ Green was dissolved in PBS buffer (10 mM, pH 7.4) containing 1% DMSO with a concentration at 32 μM. GSH was dissolved in the same PBS buffer with a concentration from 0 to 80 mM. The above solutions were mixed at 1:1 ratio, with the exception of the solution containing 80 mM of GSH and TQ Green, which was prepared by directly mixing TQ Green stock solution in DMSO with a 80 mM of GSH solution at a ratio of 1:100. All solutions were protected with nitrogen and stored in a glovebox to prevent any oxygen entering the solution. Samples of all solutions were taken out at 1, 18, 72, and 144 h after mixing. UV–vis and fluorescence were measured for all solutions.
Show full methods section
Materials All the chemicals were purchased from Sigma-Aldrich and Alfa Aesar unless otherwise specified. All solvents and reagents were used as obtained without further purification. Polystyrene beads (4.5 μm, catalog # 17135–5) were purchased from Polysciences Inc. All the organelle specific dyes were purchased from Thermo Fisher Scientific Inc.
Instrumentation
NMR spectra were recorded on a Varian NMR ( 1 H at 400 MHz) spectrometer. Chemical shifts (δ) were given in parts per million with reference to solvent signals [ 1 H NMR: CDCl 3 (7.26), CD 3 OD (3.31)]. UV–vis measurements were performed with a 2 × 10 mm quartz cuvette in a Cary 60 UV–vis spectrometer. Fluorescence measurements were performed with the same quartz cuvette in a Cary Eclipse fluorescence spectrophotometer with an excitation slit of 5 nm, an emission slit of 10 nm, and PMT at 650 V. Flash chromatography was performed on a Teledyne ISCO CombiFlashRf200. HPLC measurements were performed on Agilent Infinity 1200 HPLC with inline diode array and ESI-MS detectors. An Olympus FV1000 laser scanning confocal microscope system was used for cell imaging. ESI mass spectrometry was measured on a BrukerMS microTOF ESI, at the Shared Equipment Authority at Rice University. Flow cytometry was performed on BD LSR II Flow Cytometer at BCM core facilities.
Chemical Synthesis and Characterization
Refer to the SI for details.
Determination of Equilibrium Constant of TQ
Green and GSH Reaction TQ Green was dissolved in PBS buffer (10 mM, pH 7.4) containing 1% DMSO with a concentration at 32 μM. GSH was dissolved in the same PBS buffer with a concentration from 0 to 80 mM. The above solutions were mixed at 1:1 ratio, with the exception of the solution containing 80 mM of GSH and TQ Green, which was prepared by directly mixing TQ Green stock solution in DMSO with a 80 mM of GSH solution at a ratio of 1:100. All solutions were protected with nitrogen and stored in a glovebox to prevent any oxygen entering the solution. Samples of all solutions were taken out at 1, 18, 72, and 144 h after mixing. UV–vis and fluorescence were measured for all solutions.
Cell Culture and Treatment for Imaging
All cell lines used in this study were purchased from American Type Culture Collection (ATCC) and grown in DMEM (Gibco, 11965) media supplemented with 10% FBS and 1% 1003 Pen Strep (Gibco). Cells were cultured under a controlled atmosphere (37 °C, 5% CO 2 ). Glass dishes were used for the cell culture according to confocal scanning requirements. Cells were treated with TQ Green-AM (20 nM to 1 μM with 0.0025–1% DMSO in PBS) for 30 min, followed by two washing steps with trypan blue and PBS prior to imaging. Fluorescent images were acquired with a 405 nm laser/430–470 nm emission filter and 488 nm laser/575–620 nm emission filter. All the microscope settings were kept consistent in each experiment.
Calibration for Confocal Microscopy
GSH solutions (0–80 mM in PBS (10 mM, pH 7.4)) were prepared and mixed with TQ Green solution (5 μM final concentration). The above solutions were further mixed with a suspension containing 4.5 μm polystyrene beads. Cover glasses were used to hold the solutions for confocal microscopy. The same microscope settings were adopted from prior experiments.
Subcellular Colocalization Imaging
HeLa cells were cultured on glass bottom dishes as described before. For endosome labeling, cells were transfected with pCMV:mRFP-Rab5 plasmid 24 h prior to imaging; for mitochondria labeling, cells were treated with 100 nM MitoTracker Red CMXRos (Thermo Fisher Scientific Inc., catalog# M-7512) in PBS 30 min prior to imaging; for ER labeling, cells were treated with 1 μM ER-Tracker Red CMXRos (Thermo Fisher Scientific Inc., catalog# E34250) in PBS 30 min prior to imaging; for lysosome labeling, cells were treated with 50 nM LysoTracker Red DND-99 (Thermo Fisher Scientific Inc., catalog# L-7528) in PBS 120 min prior to imaging. All cells were also costained with 1 μM TQ Green-AM in PBS 30 min prior to imaging. Fluorescent images were acquired with a 405 nm laser/430–470 nm filter, 488 nm laser/505–545 nm filter, and 559 nm laser/575–620 nm filter.
Glutathione Reductase Assay and Cell Volume Measurement
The procedure was adopted from the literature with minor modification. 48 All cells were grown on six-well plates until the cell number reached about 5 × 10 5 in each well before harvesting. Cells were washed with cold PBS buffer twice and digested by 0.25 mL of trypsin under RT (treatment time varies, usually around 5 min). Then, 1 mL of fresh medium was added to neutralize, and the solution was immediately transferred to a cold 1.5 mL Eppendorf tube. A small sample was used for cell counting every time. The sample was centrifuged at 1000 g for 5 min at 4 °C, and the supernatant was discarded. The cell pellet was then washed with PBS and centrifuged again under the same conditions. The supernatant was removed, and cell-lysis buffer (1 mL 0.1% Triton-X and 0.6% sulfosalicylic acid in EDTA added PBS buffer) was added. Cells were homogenized using a Teflon pestle at 4 °C. The suspension was centrifuged at 3000 g for 4 min at 4 °C, and the supernatant was transferred to a new cold Eppendorf tube, which is ready for assay measurement. In a 96-well microtiter plate, 20 μL of cell lysate samples were placed in each well. Freshly made solutions of 5,5′-dithio-bis(2-nitrobenzoic acid) (DTNB) and glutathione reductase (GR) with concentrations of 0.33 g/L and 1.67 units/mL, respectively, were added to the same well to make the final volume 140 μL. After about 30 s, 60 μL of β-NADPH (0.67 g/L) was added, and the mixture was immediately measured for absorbance at 412 nm every 30 s for 2 min. The slope of the absorbance changes was proportional to the GSH concentration. A standard curve with known GSH concentrations was used to calibrate all the results. Cell volumes were measured by centrifuging the cell suspension (∼4 × 10 5 cells per sample) at 2500 g for 1 min in packed cell volume (PCV) tubes (Sigma-Aldrich, cat. no. Z760986).
Measurement of GSH Concentration Changes in PANC-1 Cells
PANC-1 cells were incubated with DEM (50 μM) for 2 h for stimulation of cysteine uptake. After replacement with fresh medium, cells were cultured under normal conditions for another 22 h. A separate dish of PANC-1 cells was incubated with DEM (50 μM) as an inhibitor for 24 h. TQ Green-AM (1 μM with 1% DMSO) was used to stain the cells for 30 min, followed by two washing steps with trypan blue and PBS prior to measurement. The same imaging procedures as above were performed. GSH concentrations were calculated based on the calibration curve. FACS was performed from harvested cells after the same treatment as mentioned above; fluorescent intensities were recorded with 405 nm laser/420–460 nm filter (pacific blue channel) and 488 nm laser/515–545 nm filter (FITC channel). Data were processed with FlowJo.
Materials All the chemicals were purchased from Sigma-Aldrich and Alfa Aesar unless otherwise specified. All solvents and reagents were used as obtained without further purification. Polystyrene beads (4.5 μm, catalog # 17135–5) were purchased from Polysciences Inc. All the organelle specific dyes were purchased from Thermo Fisher Scientific Inc.
Supplementary Material cb500986w_si_001.pdf
📊 Figures
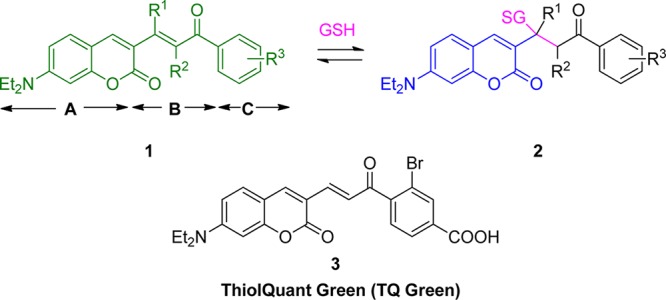
Scheme 1
Modular Design of GSH Probes and Structure of TQ Green
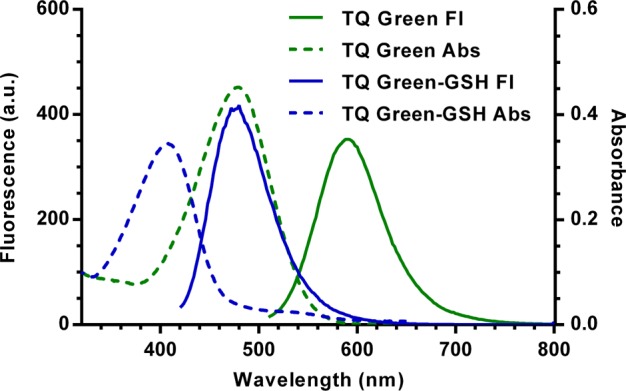
Figure 1
UVu2013vis and fluorescence spectra of TQnGreen (u03bb ex = 488 nm) and TQ Green-GSH (u03bb ex = 405 nm).
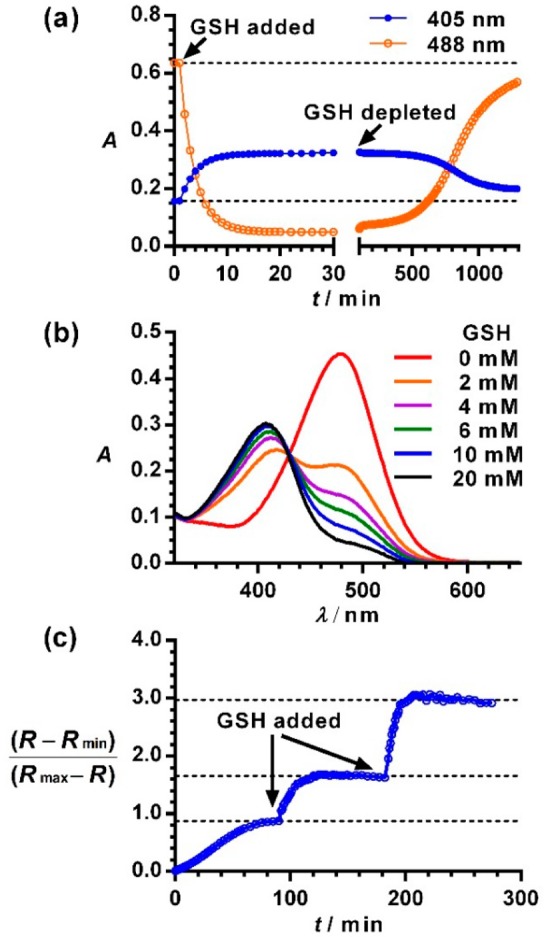
Figure 2
Reversibility of the reaction between TQ Greennand GSH. (a) Recoverynof reacted TQ Green by depleting GSH. (b) Concentration dependentnratiometric spectra of TQ Green in PBS under anaerobic conditions...
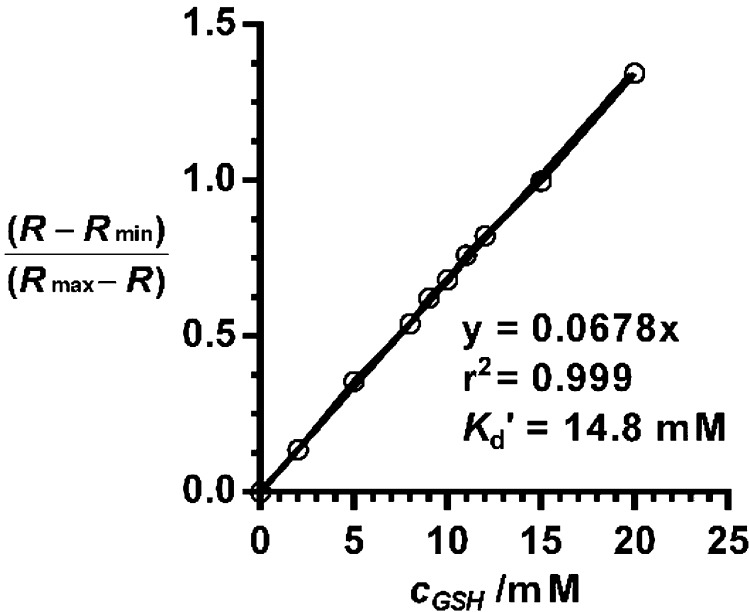
Figure 3
Linear relationship betweenn( R u2013 R min )/( R max u2013 R ) and GSH concentration.nThe reciprocal of the slope isnthe apparent dissociation constant K d u2032. R is based on UVu2013vis absorption ...
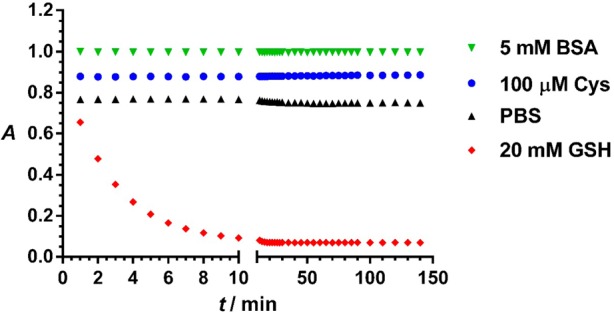
Figure 4
Reaction specificitynof TQ Green and GSH under physiological concentrations.nFor clarity, data points for the TQ Green reaction with BSA, cysteine,nand PBS were offset by 0.1 unit from each other on t...
Scheme 2
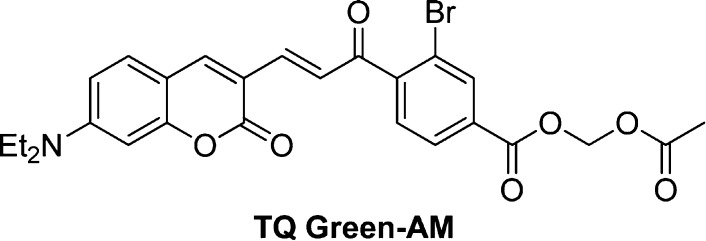
Structure of TQ Green-AM Ester
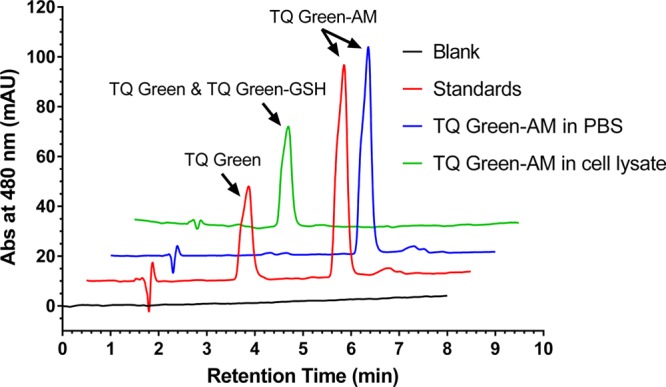
Figure 5
Regeneration of TQ Green from TQ Green-AMnunder intracellular environment.nTQ Green-AM (40 u03bcM) was incubated in PBS for 2 h and in a 500ntimes diluted HeLa cell lysate for 10 h at 37 u00b0C. The r...
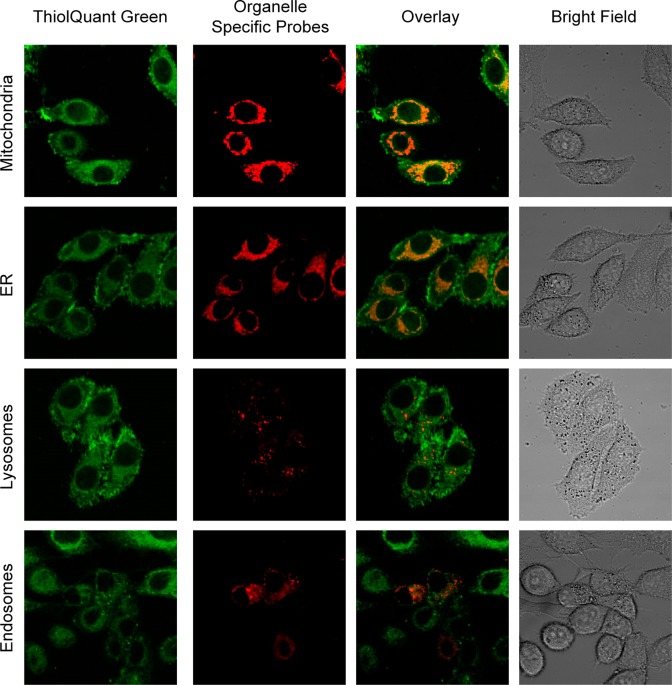
Figure 6
Subcellular distributionnof TQ Green. HeLa cells were costainednwith TQ Green (green) and different organelle specific probes, includingnMitoTracker Red, ER-Tracker Red, LysoTracker Red, and mRFP-Rab5...
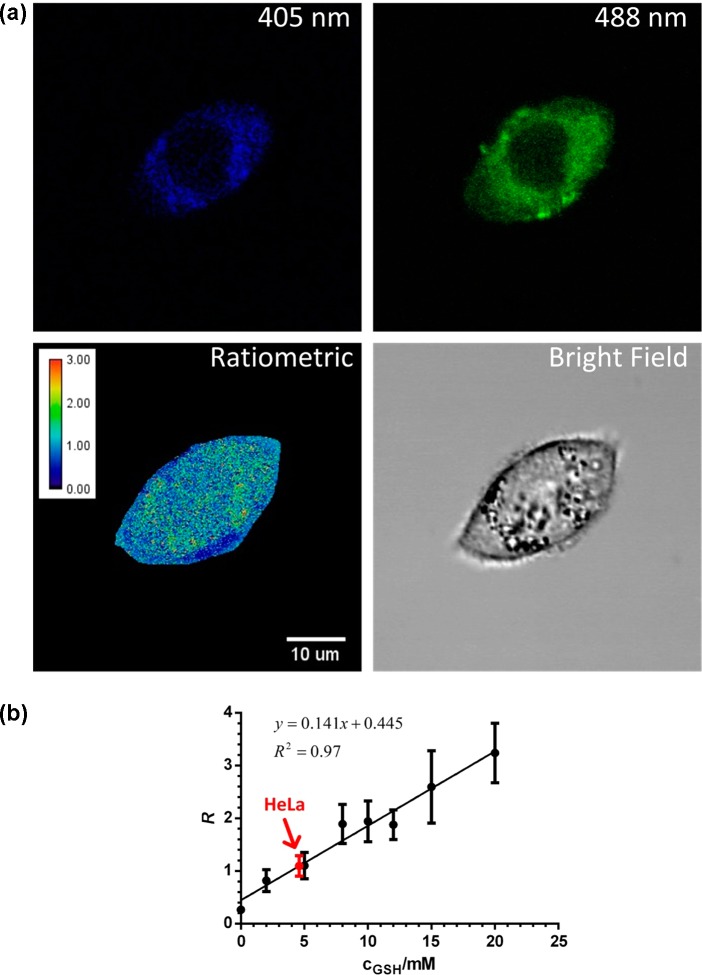
Figure 7
Measurementsnof GSH levels in HeLa cells based on ratiometric fluorescencenimaging. (a) Representative images of HeLa cells treated with TQ Green-AM.nThe ratiometric image represents the distribution ...
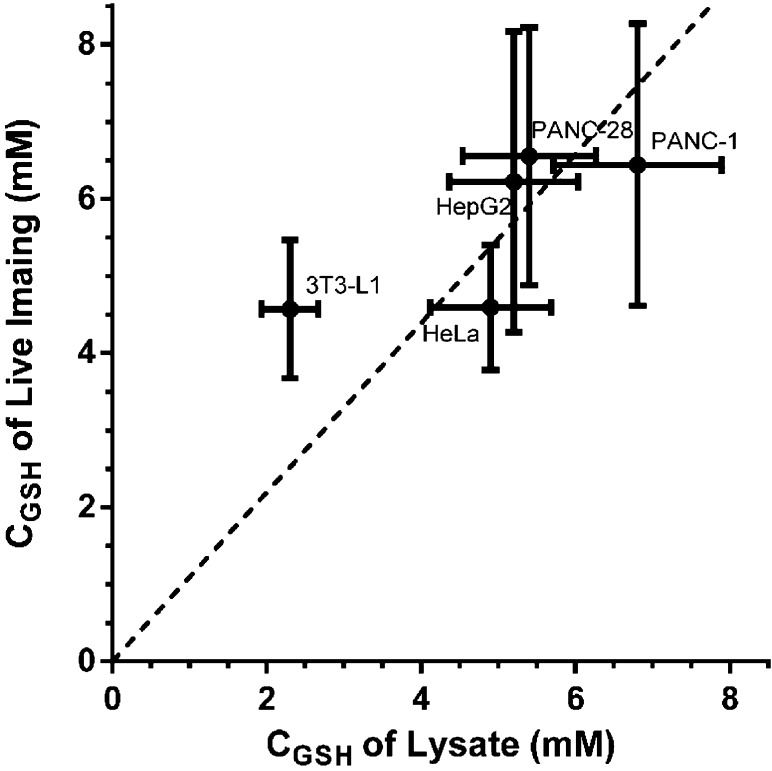
Figure 8
Correlation between thenGSH concentrations measured in live cellsnand in lysates. The y axis represents concentrationsnderived from live imaging, while the x axis representsnconcentrations determined ...
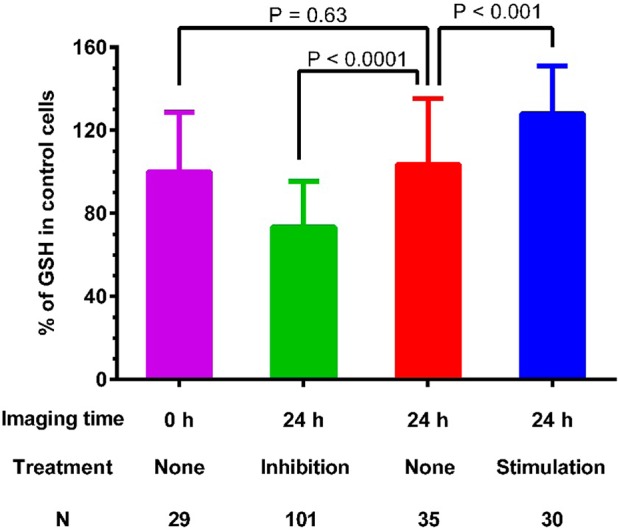
Figure 9
Detection of GSH levelnchanges in PANC-1 cells using TQ Green livenimaging. PANC-1 cells were treated with diethyl maleate (50 u03bcM)nfor 24 and 2 h to inhibit and stimulate GSH levels, respectively....
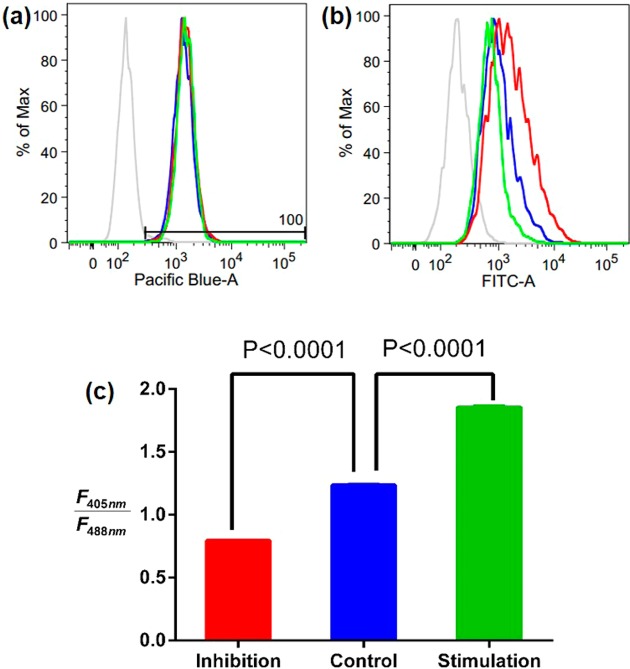
Figure 10
Quantification of GSH levels using fluorescence activatedncellnsorting (FACS). PANC-1 cells were treated with diethyl maleate (50nu03bcM) for 24 and 2 h to inhibit and stimulate GSH levels, respective...
Figure images are served from the NIH/NLM PubMed Central Open Access Subset or Europe PMC; copyright remains with the publishers and authors.
💬 Discussion
0 commentsNo comments yet. Be the first to start a discussion!
Leave a Comment