Abstract
In this work, we report the synthesis of a family of donor-acceptor (D-A) π-conjugated aggregation-induced red emission materials (TPABT, DTPABT, TPEBT and DTPEBT) with the same core 2,2-(2,2-diphenylethene-1,1-diyl)dithiophene (DPDT) and different amounts and different strengths of electron-donating terminal moieties. Interestingly, TPABT and TPEBT, which have asymmetric structures, give obviously higher solid fluorescence quantum efficiencies in comparison with those of the corresponding symmetric structures, DTPABT and DTPEBT, respectively. In particular, the thin film of TPEBT exhibited the highest fluorescence quantum efficiency of ca. 38% with the highest αAIE. Moreover, TPEBT and DTPEBT with TPE groups showed two-photon absorption cross-sections of (δ) 1.75 × 10³ GM and 1.94 × 10³ GM at 780 nm, respectively, which are obviously higher than the other two red fluorescent materials with triphenylamine groups. Then, the one-photon and two-photon fluorescence imaging of MCF-7 breast cancer cells and Hela cells, and cytotoxicity experiments, were carried out with these red fluorescent materials. Intense intracellular red fluorescence was observed for all the molecules using one-photon excitation and for TPABT using two-photon excitation in the cell cytoplasm. Finally, TPEBT is biocompatible and functions well in mouse brain blood vascular visualization. It is indicated that these materials can be used as a specific stain fluorescent probe for live cell imaging.
🔬 Techniques
🔭 Microscopes
💻 Software
🧪 Sample Preparation
🔬 Cell Lines
🏭 Microscope Brands
🧪 Reagent Suppliers
💻 Software Details
🏛️ Research Organizations (ROR)
Affiliated research institutions:
📋 Methods
General procedures
All air and water sensitive reactions were performed under a nitrogen atmosphere. Tetrahydrofuran and toluene were dried over Na/benzophenone ketyl and were freshly distilled prior to use. The other materials were of the common commercial level and were used as received.
Thin layer chromatography
(TLC) was conducted on flexible sheets precoated with SiO 2 and the separated products were visualized by UV light. Column chromatography was conducted using SiO 2 (300 mesh) from Fisher Scientific. 1 H and 13 C NMR spectra were recorded on a Bruker ARX-400 (400 MHz) or ARX-500 (500 MHz) spectrometer, using CDCl 3 . All chemical shifts were reported in parts per million (ppm). The 1 H NMR chemical shifts were referenced to TMS (0 ppm), and the 13 C NMR chemical shifts were referenced to CDCl 3 (77.23 ppm). HR-ESI-MS data were recorded on a Bruker APEX IV mass spectrometer.
Thermal gravimetric analysis
(TGA) was carried out on a TA Instrument Q500 analyzer. Absorption spectra were recorded on a PerkinElmer Lambda 750 UV-vis spectrometer. Photoluminescence was recorded on a Perkin-Elmer LS 55 spectrofluorometer and a HORIBA JobinYvon Nanolog FL3-2iHR spectrometer.
Cell culture
MCF-7 (human breast cancer cells) cells were obtained from the Institute of Basic Medical Sciences (IBMS) of the Chinese Academy of Medical Sciences (CAMS). All cell lines were maintained under standard culture conditions (atmosphere of 5% CO 2 and 95% air at 37 °C) in RPMI 1640 medium, supplemented with 10% FBS (fetal calf serum).
Cell fluorescence imaging
MCF-7 cells were grown in the exponential phase of growth on 35 mm glass-bottom culture dishes ( Φ 20 mm) for 1–2 days to reach 70–90% confluency. These cells were used in co-localization experimentation. The cells were washed three times with RPMI 1640, and then incubated with 1 mL RPMI 1640 containing red AIE molecules (20 μM) in an atmosphere of 5% CO 2 and 95% air for 3 h at 37 °C. The cells were washed three times with 1 mL PBS at room temperature, and then 1 mL PBS was added to the culture medium to observe under a confocal microscope (Olympus FV1000). Channel 1: excitation: 405 nm, emission collected: 560–660 nm. Cytotoxicity The metabolic activities of the MCF-7 breast cancer cells and Hela cells were evaluated using methylthiazolyldiphenyl-tetrazolium (MTT) assays. The cells were seeded in 96-well plates (Costar, IL, USA) at an intensity of 4 × 10 4 cells mL −1 . After 24 h incubation, the medium was replaced by the TPABT, DTPABT, TPEBT and DTPEBT suspensions at different concentrations in DMEM containing 10% FBS and 1% penicillin streptomycin, and the cells were then incubated for 12, 24 and 36 h. After the designated time intervals, the wells were washed three times with 1× PBS buffer, and 100 μL of freshly prepared MTT (0.5 mg mL −1 ) solution in culture medium was added into each well. The MTT medium solution was carefully removed after 3 h incubation in the incubator. Dimethyl sulfoxide (DMSO, 150 μL) was then added into each well and the plate was gently shaken for 10 min at room temperature to dissolve all the precipitates formed. The absorbance of MTT at 490 nm was monitored by the microplate reader (Genios Tecan). Fabrication of TPEBT NPs The TPEBT-loaded DSPE-PEG 2000 NPs were prepared through a modified nanoprecipitation method. Briefly, 1 mL of THF solution containing 1 mg of TPEBT and 2 mg of DSPE-PEG 2000 was poured into 9 mL of water. This was followed by sonicating the mixture for 60 s at 10 W output using a microtip probe sonicator (XL2000, Misonix Incorporated, NY). The mixture was then stirred at room temperature overnight to evaporate the THF. The obtained solution was filtered using a 0.20 μm syringe-driven filter to collect the products.
Show full methods section
General procedures
All air and water sensitive reactions were performed under a nitrogen atmosphere. Tetrahydrofuran and toluene were dried over Na/benzophenone ketyl and were freshly distilled prior to use. The other materials were of the common commercial level and were used as received.
Thin layer chromatography
(TLC) was conducted on flexible sheets precoated with SiO 2 and the separated products were visualized by UV light. Column chromatography was conducted using SiO 2 (300 mesh) from Fisher Scientific. 1 H and 13 C NMR spectra were recorded on a Bruker ARX-400 (400 MHz) or ARX-500 (500 MHz) spectrometer, using CDCl 3 . All chemical shifts were reported in parts per million (ppm). The 1 H NMR chemical shifts were referenced to TMS (0 ppm), and the 13 C NMR chemical shifts were referenced to CDCl 3 (77.23 ppm). HR-ESI-MS data were recorded on a Bruker APEX IV mass spectrometer.
Thermal gravimetric analysis
(TGA) was carried out on a TA Instrument Q500 analyzer. Absorption spectra were recorded on a PerkinElmer Lambda 750 UV-vis spectrometer. Photoluminescence was recorded on a Perkin-Elmer LS 55 spectrofluorometer and a HORIBA JobinYvon Nanolog FL3-2iHR spectrometer.
Cell culture
MCF-7 (human breast cancer cells) cells were obtained from the Institute of Basic Medical Sciences (IBMS) of the Chinese Academy of Medical Sciences (CAMS). All cell lines were maintained under standard culture conditions (atmosphere of 5% CO 2 and 95% air at 37 °C) in RPMI 1640 medium, supplemented with 10% FBS (fetal calf serum).
Cell fluorescence imaging
MCF-7 cells were grown in the exponential phase of growth on 35 mm glass-bottom culture dishes ( Φ 20 mm) for 1–2 days to reach 70–90% confluency. These cells were used in co-localization experimentation. The cells were washed three times with RPMI 1640, and then incubated with 1 mL RPMI 1640 containing red AIE molecules (20 μM) in an atmosphere of 5% CO 2 and 95% air for 3 h at 37 °C. The cells were washed three times with 1 mL PBS at room temperature, and then 1 mL PBS was added to the culture medium to observe under a confocal microscope (Olympus FV1000). Channel 1: excitation: 405 nm, emission collected: 560–660 nm. Cytotoxicity The metabolic activities of the MCF-7 breast cancer cells and Hela cells were evaluated using methylthiazolyldiphenyl-tetrazolium (MTT) assays. The cells were seeded in 96-well plates (Costar, IL, USA) at an intensity of 4 × 10 4 cells mL −1 . After 24 h incubation, the medium was replaced by the TPABT, DTPABT, TPEBT and DTPEBT suspensions at different concentrations in DMEM containing 10% FBS and 1% penicillin streptomycin, and the cells were then incubated for 12, 24 and 36 h. After the designated time intervals, the wells were washed three times with 1× PBS buffer, and 100 μL of freshly prepared MTT (0.5 mg mL −1 ) solution in culture medium was added into each well. The MTT medium solution was carefully removed after 3 h incubation in the incubator. Dimethyl sulfoxide (DMSO, 150 μL) was then added into each well and the plate was gently shaken for 10 min at room temperature to dissolve all the precipitates formed. The absorbance of MTT at 490 nm was monitored by the microplate reader (Genios Tecan). Fabrication of TPEBT NPs The TPEBT-loaded DSPE-PEG 2000 NPs were prepared through a modified nanoprecipitation method. Briefly, 1 mL of THF solution containing 1 mg of TPEBT and 2 mg of DSPE-PEG 2000 was poured into 9 mL of water. This was followed by sonicating the mixture for 60 s at 10 W output using a microtip probe sonicator (XL2000, Misonix Incorporated, NY). The mixture was then stirred at room temperature overnight to evaporate the THF. The obtained solution was filtered using a 0.20 μm syringe-driven filter to collect the products.
Brain blood vascular imaging
The experimental set up for brain imaging is described elsewhere. 24 The small 2 mm circular piece of parietal bone was excised using a dental drill, exposing the meninges and the brain of the immobilized mouse. For the TPEF experiments, the mice were anesthetized (150 mg kg −1 ketamine and 10 mg kg −1 xylazine) and placed on a heating pad to maintain a core body temperature of 37 °C throughout each imaging procedure. 200 μL of TPEBT NPs at 50 × 10 −6 M TPEBT was administered via retro-orbital injection prior to imaging. All procedures were performed under the institution's IACUC (Institutional Animal Care and Use Committee) guidelines. A TriM Scope II single-beam two-photon microscope (LaVision BioTec) with a tunable 680–1080 nm laser (coherent) was used to acquire the images. The TPEBT NPs and second harmonic generation were excited at 780 and 980 nm, and the emitted light was split by 520 and 640 nm long pass mirrors and detected through 542/27 nm filters.
Synthesis of TPABT and DTPABT
In a 100 mL two-neck round-bottom flask, 4-(7-bromobenzo[ c ][1,2,5]thiadiazol-4-yl)- N , N -diphenylaniline (0.05 g, 0.12 mmol), 4,4′-(2,2-bis(5-(trimethylstannyl)thiophen-2-yl)ethene-1,1-diyl)bis( N , N -diphenylaniline) (0.28 g, 0.30 mmol), tris(dibenzylideneacetone)dipalladium(0) (0.005 g, 0.005 mmol) and o -tolyl phosphine (0.01 g, 0.02 mmol) were added. The flask was evacuated and back-filled with N 2 three times, and then degassed toluene (40 mL) was injected into the mixture. The resulting solution was stirred at refluxing temperature for 12 h under the N 2 atmosphere. After being cooled to room temperature, the solvents were then removed under reduced pressure. The dark residue was purified by silica gel chromatography, eluting with PE–CH 2 Cl 2 (1 : 1) to give a red solid (0.12 g, 45%, TPABT) and another red solid (0.15 g, 42%, DTPABT). TPABT 1 H NMR (CDCl 3 , 400 MHz, ppm): δ 7.98–7.97 (d, J = 4.0 Hz, 1H, Th-H), 7.89–7.87 (d, J = 8.4 Hz, 2H, Ph-H), 7.82–7.80 (d, J = 7.2 Hz, 1H, Ph-H), 7.69–7.67 (d, J = 7.6 Hz, 1H, Ph-H), 7.32–7.27 (m, 6H), 7.25–7.00 (m, 29H), 6.95–6.88 (m, 9H). 13 C NMR (CDCl 3 , 100 MHz, ppm): δ 154.2, 153.0, 148.3, 147.6, 147.1, 146.9, 142.6, 137.2, 137.0, 132.2, 131.9, 130.9, 130.1, 129.6, 129.4, 129.3, 127.4, 127.1, 126.4, 125.6, 125.1, 124.8, 124.6, 123.6, 123.4, 123.2, 123.1, 123.0, 122.6. HR-ESI-MS ( m / z ): calcd for C 70 H 49 N 5 S 3 : 1055.3150 (100%). Found: 1056.3207 ([M + H] + , 100%). DTPABT 1 H NMR (CDCl 3 , 400 MHz, ppm): δ 8.01–8.00 (d, J = 4.0 Hz, 2H, Th-H), 7.89–7.87 (d, J = 8.8 Hz, 4H, Ph-H), 7.84–7.82 (d, J = 6.8 Hz, 2H, Ph-H), 7.69–7.67 (d, J = 7.6 Hz, 2H, Ph-H), 7.31–7.28 (m, 8H), 7.16–7.05 (m, 36H), 6.96–6.92 (m, 10H). 13 C NMR (CDCl 3 , 125 MHz, ppm): δ 154.3, 153.1, 148.4, 147.8, 147.4, 132.3, 131.1, 130.2, 129.6, 129.4, 127.4, 125.2, 124.7, 123.6, 123.3, 123.2, 123.1. HR-ESI-MS ( m / z ): calcd for C 94 H 64 N 8 S 4 : 1433.4170 (100%). Found: 1433.4167 (100%).
Synthesis of TPEBT and DTPEBT
In a 100 mL two-neck round-bottom flask, 4-bromo-7-(4-(1,2,2-triphenylvinyl)phenyl)benzo[ c ][1,2,5]thiadiazole (0.11 g, 0.10 mmol), 4,4′-(2,2-bis(5-(trimethylstannyl)thiophen-2-yl)ethene-1,1-diyl)bis( N , N -diphenylaniline) (0.23 g, 0.25 mmol), tris(dibenzylideneacetone)dipalladium(0) (0.005 g, 0.005 mmol) and o -tolyl phosphine (0.01 g, 0.02 mmol) were added. The flask was evacuated and back-filled with N 2 three times, and then degassed toluene (40 mL) was injected into the mixture. The resulting solution was stirred at refluxing temperature for 12 h under the N 2 atmosphere. After being cooled to room temperature, the solvents were then removed under reduced pressure. The dark residue was purified by silica gel chromatography, eluting with PE–CH 2 Cl 2 (1 : 1) to give a red solid (0.06 g, 28%, TPEBT) and another red solid (0.19 g, 59%, DTPEBT). TPEBT 1 H NMR (CDCl 3 , 400 MHz, ppm): δ 7.97–7.96 (d, J = 3.6 Hz, 1H, Th-H), 7.78–7.86 (m, 3H, Ph-H), 7.68–7.66 (d, J = 7.2 Hz, 1H, Ph-H), 7.25–7.00 (m, 41H), 6.95–6.87 (m, 8H). 13 C NMR (CDCl 3 , 100 MHz, ppm): δ 154.1, 153.0, 148.1, 147.7, 147.2, 146.9, 146.0, 144.0, 143.95, 143.85, 142.7, 141.7, 140.7, 139.8, 137.2, 137.0, 135.3, 132.2, 131.8, 131.7, 131.58, 131.57, 131.1, 129.9, 129.4, 129.3, 128.0, 127.9, 127.8, 127.3, 126.8, 126.73, 126.68, 126.6, 126.4, 125.5, 125.3, 124.8, 124.6, 123.3, 123.2, 123.0, 122.6. HR-ESI-MS ( m / z ): calcd for C 78 H 54 N 4 S 3 : 1142.3511 (100%). Found: 1143.3505 ([M + H] + , 100%). DTPEBT 1 H NMR (CDCl 3 , 400 MHz, ppm): δ 8.01–8.00 (d, J = 3.6 Hz, 2H, Th-H), 7.82–7.80 (d, J = 7.6 Hz, 2H, Ph-H), 7.78–7.76 (d, J = 8.0 Hz, 4H, Ph-H), 7.69–7.67 (d, J = 7.6 Hz, 2H, Ph-H), 7.20–7.02 (m, 56H), 6.96–6.91 (m, 8H). 13 C NMR (CDCl 3 , 100 MHz, ppm): δ 154.1, 152.9, 147.7, 147.2, 144.0, 143.96, 143.86, 141.7, 140.7, 135.3, 132.2, 131.9, 131.7, 131.59, 131.57, 129.4, 128.5, 128.1, 128.0, 127.9, 126.8, 126.73, 126.69, 124.7, 123.12, 123.09. HR-ESI-MS ( m / z ): calcd for C 110 H 74 N 6 S 4 : 1607.4891 (100%). Found: 1607.4887 (100%).
General procedures
All air and water sensitive reactions were performed under a nitrogen atmosphere. Tetrahydrofuran and toluene were dried over Na/benzophenone ketyl and were freshly distilled prior to use. The other materials were of the common commercial level and were used as received.
Thin layer chromatography
(TLC) was conducted on flexible sheets precoated with SiO 2 and the separated products were visualized by UV light. Column chromatography was conducted using SiO 2 (300 mesh) from Fisher Scientific. 1 H and 13 C NMR spectra were recorded on a Bruker ARX-400 (400 MHz) or ARX-500 (500 MHz) spectrometer, using CDCl 3 . All chemical shifts were reported in parts per million (ppm). The 1 H NMR chemical shifts were referenced to TMS (0 ppm), and the 13 C NMR chemical shifts were referenced to CDCl 3 (77.23 ppm). HR-ESI-MS data were recorded on a Bruker APEX IV mass spectrometer.
Thermal gravimetric analysis
(TGA) was carried out on a TA Instrument Q500 analyzer. Absorption spectra were recorded on a PerkinElmer Lambda 750 UV-vis spectrometer. Photoluminescence was recorded on a Perkin-Elmer LS 55 spectrofluorometer and a HORIBA JobinYvon Nanolog FL3-2iHR spectrometer.
📊 Figures
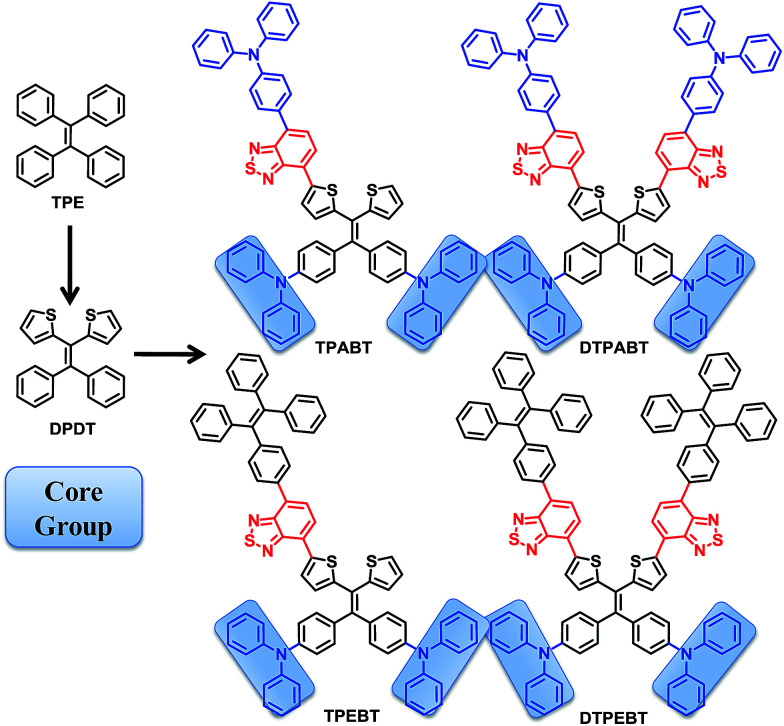
Chart 1
Chemical structures of TPABT, DTPABT, TPEBT, and DTPEBT.
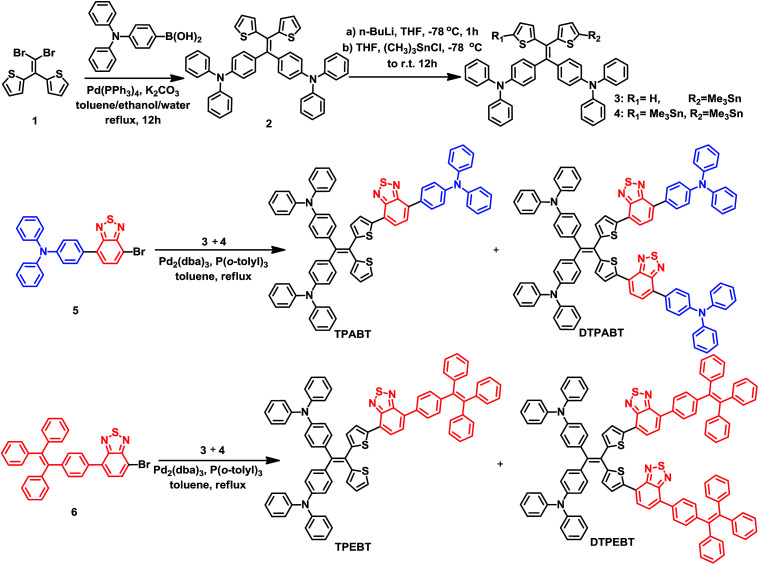
Scheme 1
Synthesis of the red AIE molecules TPABT, DTPABT, TPEBT, and DTPEBT.
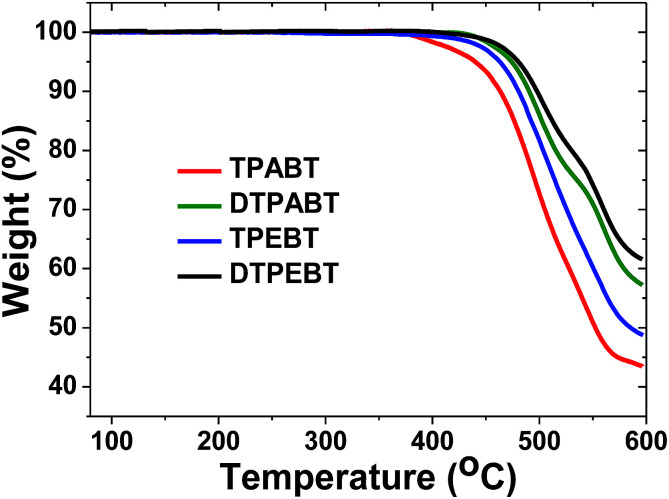
Fig. 1
Thermogravimetric analysis (TGA) of TPABT, DTPABT, TPEBT, and DTPEBT with a heating rate of 10 u00b0C min u22121 under a N 2 atmosphere.
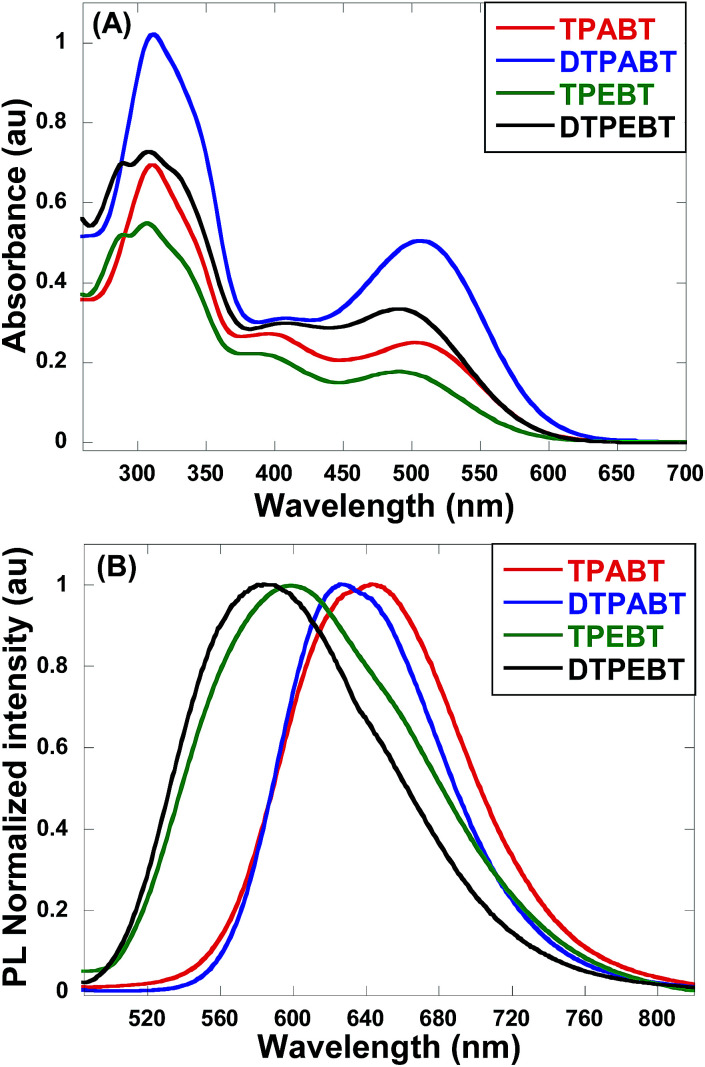
Fig. 2
The absorption (A) and emission (B) spectra of the red AIE molecules TPABT, DTPABT, TPEBT, and DTPEBT in THF solutions (10 u22125 M).
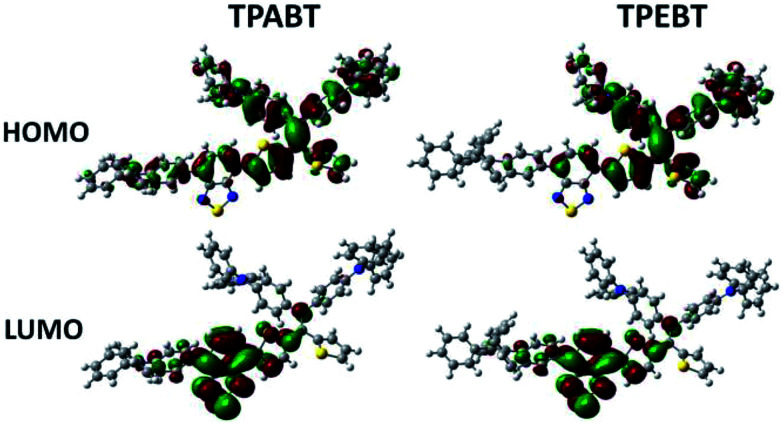
Fig. 3
Comparison of the HOMO and LUMO orbital surfaces of TPABT and TPEBT using the DFT B3LYP/6-31G(d) method.
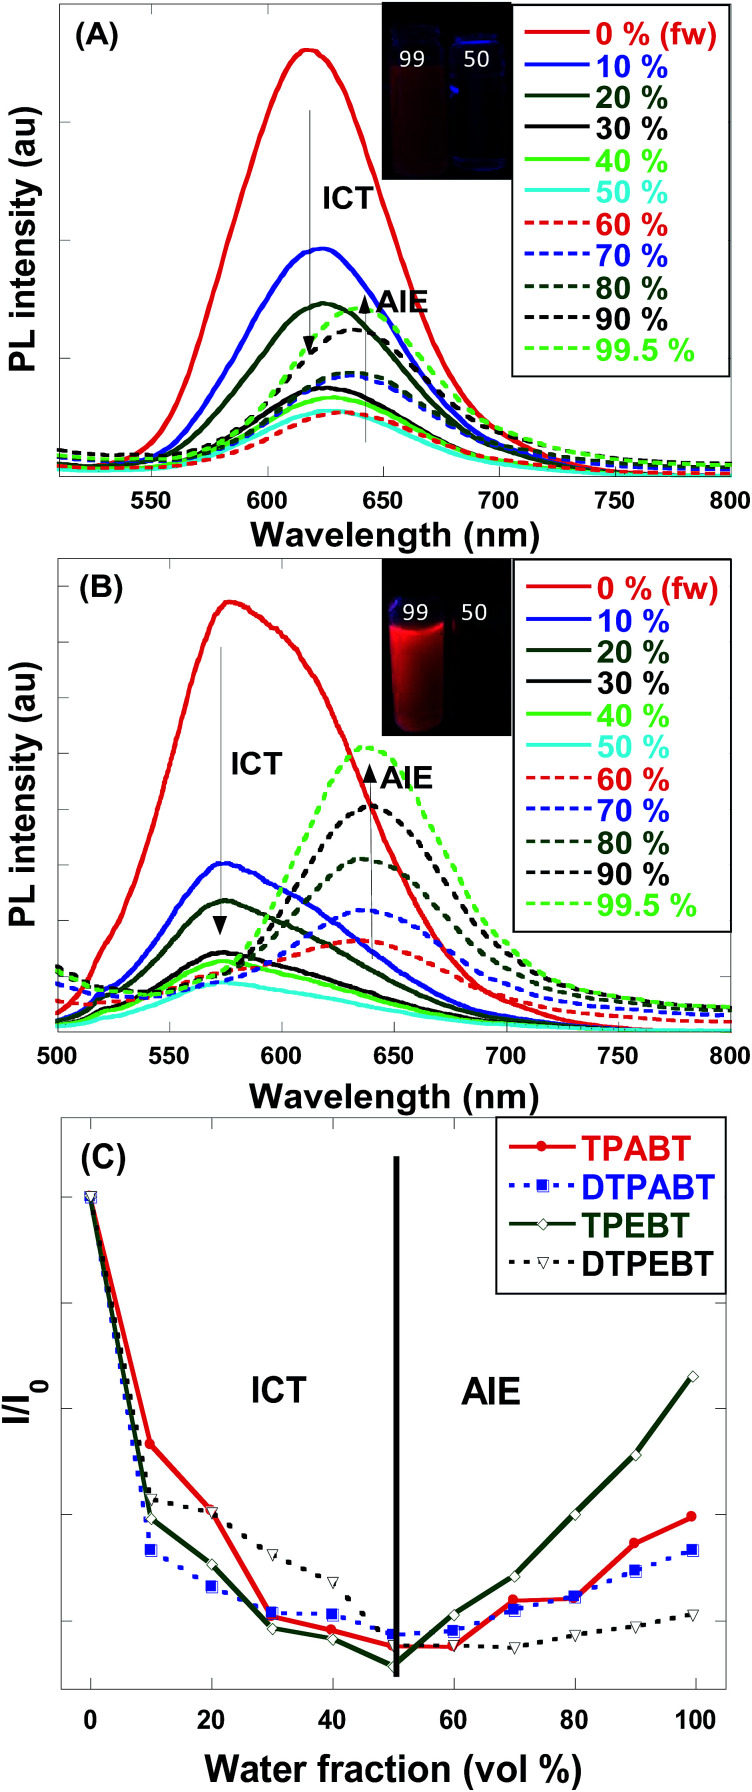
Fig. 4
(A) Emission spectra of TPABT in THFu2013water mixtures with different water fractions ( f w ). Inset: photos of TPABT with different water fractions under UV lamp illumination. (B) Emission spectra of TPEBT in THFu2013water mixtures with different water fractions ( f w ). Inset: photos of TPEBT with different water fractions under UV lamp illumination. (C) Changes in the relative PL intensities of TPABT, DTPABT, TPEBT and DTPEBT in THF/water mixtures with different water fractions, where I 0 is the emission intensity in pure THF solution.
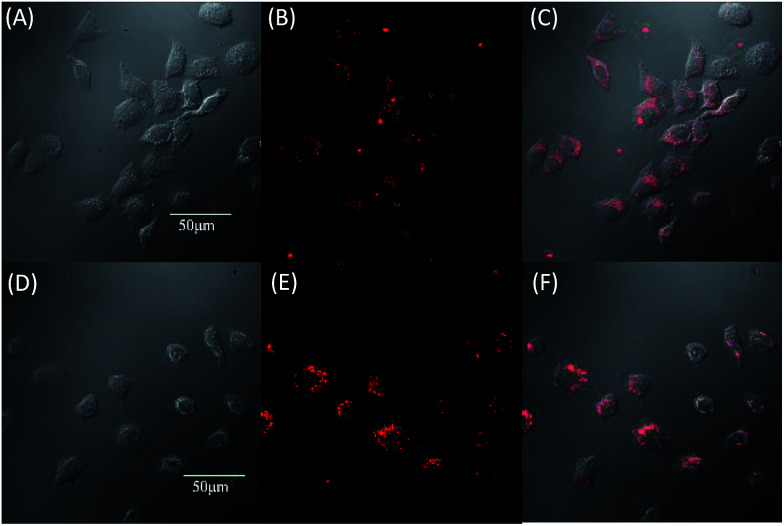
Fig. 5
Fluorescence images of MCF-7 by DTPEBT (Au2013C) and TPABT (Du2013F). (A) and (D) are bright field image cells, (B) and (E) are fluorescence images, (C) and (F) are merged images, incubated for 3 hours with 20 u03bcM.
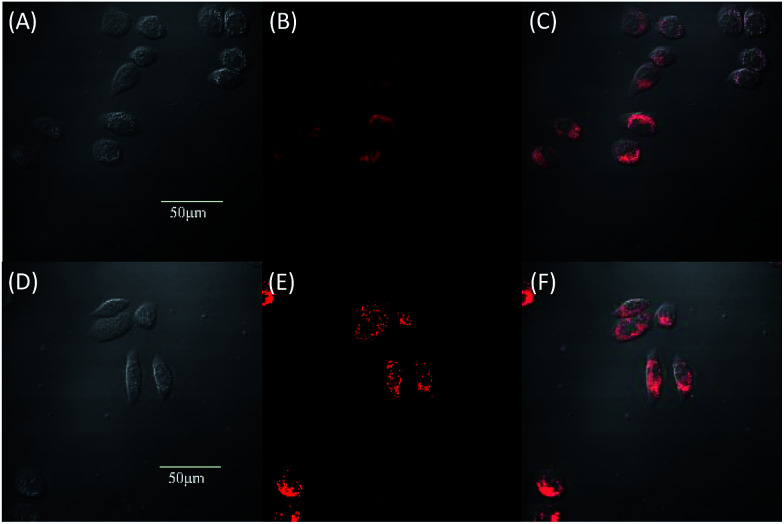
Fig. 6
Fluorescence images of Hela by DTPEBT (Au2013C) and TPABT (Du2013F). (A) and (D) are bright field image cells, (B) and (E) are fluorescence images, (C) and (F) are merged images, incubated for 3 hours with 20 u03bcM.
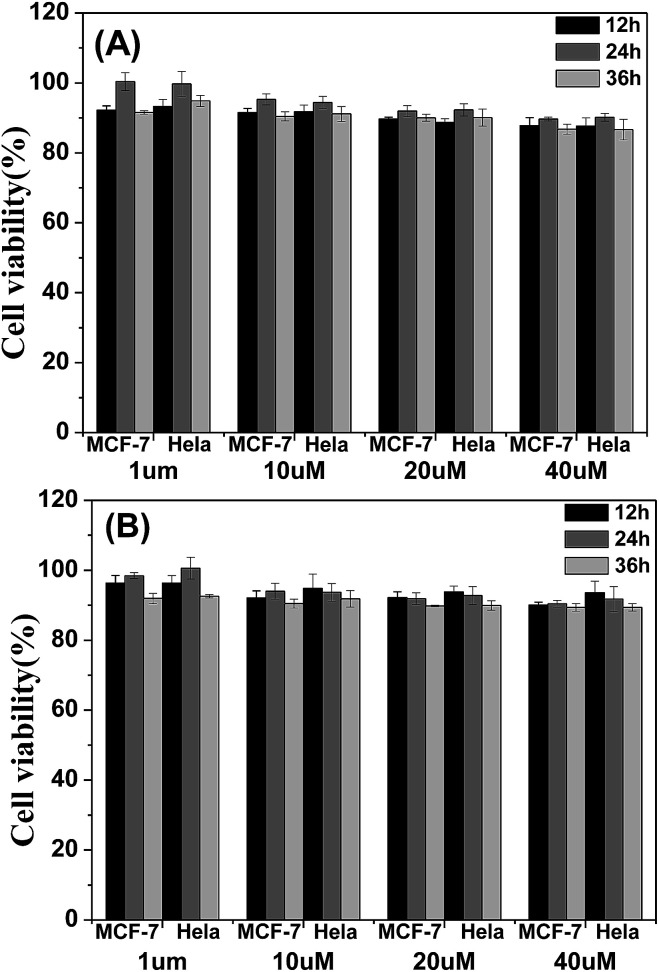
Fig. 7
Metabolic viability of MCF-7 breast cancer cells and Hela cells after incubation with red emission AIE molecules (A) TPABT and (B) TPEBT for 12, 24 and 36 h at different concentrations.
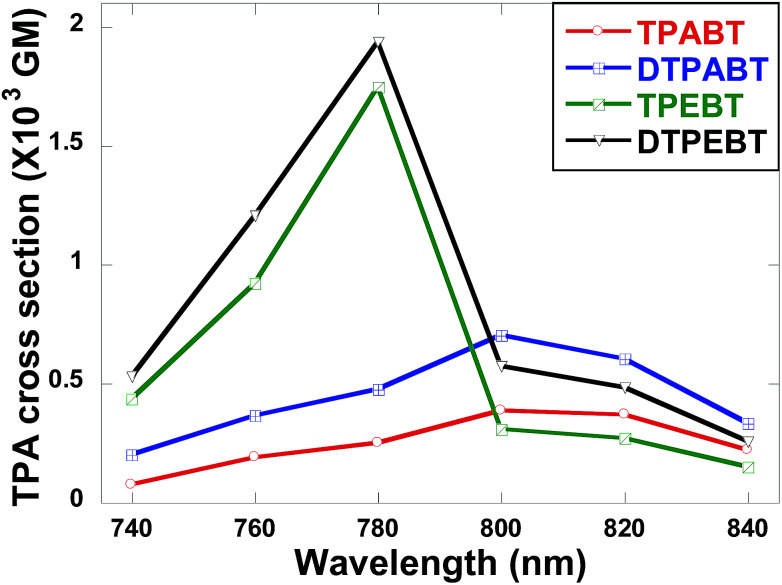
Fig. 8
Two-photon absorption cross-sections of the red emission AIE molecules TPABT, DTPABT, TPEBT, and DTPEBT.
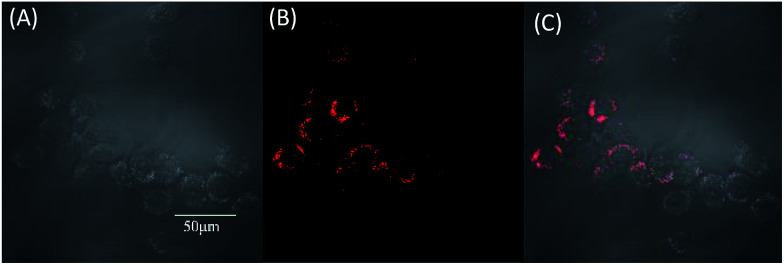
Fig. 9
Two-photon excited fluorescence imaging of human breast cancer cells (MCF-7 cells) after 3 h incubation with TPABT at 37 u00b0C. The images were recorded upon 980 nm excitation with a 560u2013660 nm band pass filter. (A) Brightfield image cells, (B) two-photon excited fluorescence, (C) two-photon excited fluorescence/brightfield overlay. The scale bar is 50 u03bcm.
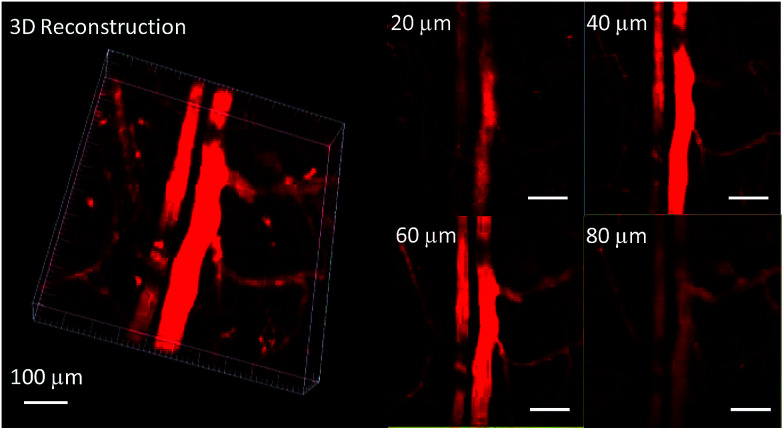
Fig. 10
Two-photon fluorescence images of ear blood vessels stained with TPEBT NPs including 3D reconstructed images of blood vessels when the TPEBT NPs were excited at 780 nm, and images at different vertical depths of the mouse ear. All the images share the same scale bar of 100 u03bcm.
Figure images are served from the NIH/NLM PubMed Central Open Access Subset or Europe PMC; copyright remains with the publishers and authors.
💬 Discussion
0 commentsNo comments yet. Be the first to start a discussion!
Leave a Comment