Abstract
Reprogramming of metabolic pathways determines cell functions and fate. In our work, we have used organelle-targeted ATP biosensors to evaluate cellular metabolic settings with high resolution in real time. Our data indicate that mitochondria dynamically supply ATP for glucose phosphorylation in a variety of cancer cell types. This hexokinase-dependent process seems to be reversed upon the removal of glucose or other hexose sugars. Our data further verify that mitochondria in cancer cells have increased ATP consumption. Similar subcellular ATP fluxes occurred in young mouse embryonic fibroblasts (MEFs). However, pancreatic beta cells, senescent MEFs, and MEFs lacking mitofusin 2 displayed completely different mitochondrial ATP dynamics, indicative of increased oxidative phosphorylation. Our findings add perspective to the variability of the cellular bioenergetics and demonstrate that live cell imaging of mitochondrial ATP dynamics is a powerful tool to evaluate metabolic flexibility and heterogeneity at a single-cell level.
🔬 Techniques
💻 Software
✨ Fluorophores
🧪 Sample Preparation
🔬 Cell Lines
🏭 Microscope Brands
🧪 Reagent Suppliers
📷 Detectors
🔎 Objectives
💻 Software Details
💾 Data Repositories
🏷️ Research Resource Identifiers (RRIDs)
Verified research resources used in this paper:
🏛️ Research Organizations (ROR)
Affiliated research institutions:
📋 Methods
Key Resources Table Table 1 REAGENT or RESOURCE SOURCE IDENTIFIER Chemicals, Peptides, and Recombinant Proteins TransFast Transfection Reagent Promega Cat# E2431 2-Deoxy-D-glucose Alfa Aesar Cat# L07338 ; CAS 154-17-6 D-Mannose Carl Roth Cat# 4220; CAS 3458-28-4 Oligomycin A Sigma Aldrich or Tocris Sigma: Cat# 75351; CAS 579-13-5; Tocris: Cat# 4110; CAS 579-13-5 Antimycin A Sigma Aldrich Cat# A8674; CAS 1397-94-0 TMRM Molecular Probes, Invitrogen Cat# T668 MitoTracker Red-FM Molecular Probes, Invitrogen Cat# M22425 Critical Commercial Assays Seahorse XFe96 Extracellular Flux Assay Kit Agilent Cat# 102416-100 Total RNA Kit Peqlab Cat# 732-2868 High-Capacity cDNA Reverse Transcription Kit Applied Biosystems Cat# 4368814 QuantiFast SYBR Green RT-PCR kit QIAGEN Cat# 204154 Experimental Models: Cell Lines HeLa S3 ATCC N/A H1299 ATCC N/A SH-SY5Y ATCC N/A INS-1 (832/13) C.B. Newgard, Duke University School of Medicine, USA; Hohmeier et al., 2000 N/A MIN-6 CellBank Graz N/A MDA-MB231 CellBank Graz N/A MCF7 CellBank Graz N/A SkBr3 CellBank Graz N/A Calu-3 CellBank Graz N/A A549 CellBank Graz N/A MEF (mouse embryonic fibroblasts) Thomas Simmen, University of Alberta, Canada N/A MEF Mfn2 –/– Thomas Simmen, University of Alberta, Canada N/A Oligonucleotides HK1 forward primer 5′ -GACTCGCTTCAGGAAGGAGATG-3′ Invitrogen N/A HK1 reverse primer 5′ -ACATCTTGACTGTGGCTGTTGG-3′ Invitrogen N/A HK2 forward primer 5′ -GATTGTCCGTAACATTCTCATCGA-3′ Invitrogen N/A HK2 reverse primer 5′ -TGTCTTGAGCCGCTCTGAGAT-3′ Invitrogen N/A Hexokinase 1 siRNA Santa Cruz Biotechnology Cat# sc-39044 Hexokinase 2 siRNA Santa Cruz Biotechnology Cat# sc-35621 Recombinant DNA pcDNA3.1 AT1.03 H. Imamura; Imamura et al., 2009 N/A pcDNA3.1 mtAT1.03 H. Imamura; Imamura et al., 2009 N/A pcDNA3.1 ERAT1.03 our lab; Vishnu et al., 2014 N/A pcDNA3.1 FLII 12 Pglu-700μδ6 W. Frommer; Takanaga et al., 2008 Addgene # 17866 pSypHer-cyto N. Demaurex; Poburko et al., 2011 Addgene # 48250 pSypHer-mito N. Demaurex; Poburko et al., 2011 Addgene # 48251 FLHKI-pGFPN3 H. Ardehali; Sun et al., 2008 Addgene # 21917 FLHKII-pGFPN3 H. Ardehali; Sun et al., 2008 Addgene # 21920 Software and Algorithms Live Acquisition 2 TILL Photonics N/A Offline Analysis TILL Photonics N/A MetaMorph Molecular Devices RRID: SCR_002368 Microsoft Excel Microsoft RRID: SCR_016137 GraphPad Prism5 GraphPad RRID: SCR_002798 Nikon Nis-Elements Nikon RRID: SCR_014329 Fiji/ImageJ Schneider et al., 2012 https://fiji.sc/ SIM image analysis macro B. Gottschalk, this work e-mail: benjamin.gottschalk@medunigraz.at N/A Contact for Reagent and Resource Sharing Further information and requests for resources and reagents should be directed to and will be fulfilled by the Lead Contact, Roland Malli ( roland.malli@medunigraz.at ). Experimental Model and Subject Details HeLa S3, H1299, and SH-SY5Y cells come from ATCC; MIN-6, MDA-MB231, MCF7, SkBr3, Calu-3 and A549 cells from the Core Facility Alternative Biomodels and Preclinical Imaging, Medical University of Graz (Graz, Austria). INS-1 cells were obtained from C.B. Newgard, Department of Pharmacology and Cancer Biology, Duke University School of Medicine, USA ( Hohmeier et al., 2000 ).
Show full methods section
Key Resources Table Table 1 REAGENT or RESOURCE SOURCE IDENTIFIER Chemicals, Peptides, and Recombinant Proteins TransFast Transfection Reagent Promega Cat# E2431 2-Deoxy-D-glucose Alfa Aesar Cat# L07338 ; CAS 154-17-6 D-Mannose Carl Roth Cat# 4220; CAS 3458-28-4 Oligomycin A Sigma Aldrich or Tocris Sigma: Cat# 75351; CAS 579-13-5; Tocris: Cat# 4110; CAS 579-13-5 Antimycin A Sigma Aldrich Cat# A8674; CAS 1397-94-0 TMRM Molecular Probes, Invitrogen Cat# T668 MitoTracker Red-FM Molecular Probes, Invitrogen Cat# M22425 Critical Commercial Assays Seahorse XFe96 Extracellular Flux Assay Kit Agilent Cat# 102416-100 Total RNA Kit Peqlab Cat# 732-2868 High-Capacity cDNA Reverse Transcription Kit Applied Biosystems Cat# 4368814 QuantiFast SYBR Green RT-PCR kit QIAGEN Cat# 204154 Experimental Models: Cell Lines HeLa S3 ATCC N/A H1299 ATCC N/A SH-SY5Y ATCC N/A INS-1 (832/13) C.B. Newgard, Duke University School of Medicine, USA; Hohmeier et al., 2000 N/A MIN-6 CellBank Graz N/A MDA-MB231 CellBank Graz N/A MCF7 CellBank Graz N/A SkBr3 CellBank Graz N/A Calu-3 CellBank Graz N/A A549 CellBank Graz N/A MEF (mouse embryonic fibroblasts) Thomas Simmen, University of Alberta, Canada N/A MEF Mfn2 –/– Thomas Simmen, University of Alberta, Canada N/A Oligonucleotides HK1 forward primer 5′ -GACTCGCTTCAGGAAGGAGATG-3′ Invitrogen N/A HK1 reverse primer 5′ -ACATCTTGACTGTGGCTGTTGG-3′ Invitrogen N/A HK2 forward primer 5′ -GATTGTCCGTAACATTCTCATCGA-3′ Invitrogen N/A HK2 reverse primer 5′ -TGTCTTGAGCCGCTCTGAGAT-3′ Invitrogen N/A Hexokinase 1 siRNA Santa Cruz Biotechnology Cat# sc-39044 Hexokinase 2 siRNA Santa Cruz Biotechnology Cat# sc-35621 Recombinant DNA pcDNA3.1 AT1.03 H. Imamura; Imamura et al., 2009 N/A pcDNA3.1 mtAT1.03 H. Imamura; Imamura et al., 2009 N/A pcDNA3.1 ERAT1.03 our lab; Vishnu et al., 2014 N/A pcDNA3.1 FLII 12 Pglu-700μδ6 W. Frommer; Takanaga et al., 2008 Addgene # 17866 pSypHer-cyto N. Demaurex; Poburko et al., 2011 Addgene # 48250 pSypHer-mito N. Demaurex; Poburko et al., 2011 Addgene # 48251 FLHKI-pGFPN3 H. Ardehali; Sun et al., 2008 Addgene # 21917 FLHKII-pGFPN3 H. Ardehali; Sun et al., 2008 Addgene # 21920 Software and Algorithms Live Acquisition 2 TILL Photonics N/A Offline Analysis TILL Photonics N/A MetaMorph Molecular Devices RRID: SCR_002368 Microsoft Excel Microsoft RRID: SCR_016137 GraphPad Prism5 GraphPad RRID: SCR_002798 Nikon Nis-Elements Nikon RRID: SCR_014329 Fiji/ImageJ Schneider et al., 2012 https://fiji.sc/ SIM image analysis macro B. Gottschalk, this work e-mail: benjamin.gottschalk@medunigraz.at N/A Contact for Reagent and Resource Sharing Further information and requests for resources and reagents should be directed to and will be fulfilled by the Lead Contact, Roland Malli ( roland.malli@medunigraz.at ). Experimental Model and Subject Details HeLa S3, H1299, and SH-SY5Y cells come from ATCC; MIN-6, MDA-MB231, MCF7, SkBr3, Calu-3 and A549 cells from the Core Facility Alternative Biomodels and Preclinical Imaging, Medical University of Graz (Graz, Austria). INS-1 cells were obtained from C.B. Newgard, Department of Pharmacology and Cancer Biology, Duke University School of Medicine, USA ( Hohmeier et al., 2000 ).
Mouse Embryonic Fibroblasts
(MEFs) were a gift from Thomas Simmen, Department of Cell Biology, University of Alberta, Canada. HeLa, MCF7, MDA-MB231, SkBr3, H1299 and MEF cells were grown in Dulbecco’s modified Eagle’s medium (DMEM) containing 10% FCS, 100 U/mL penicillin, 100 μg/mL streptomycin, 2.5 μg/mL amphotericin B, and 2 mM glutamine. A549, Calu-3, and SH-SY5Y cells were cultivated in a 1:1 mixture of Ham’s F12 medium and DMEM supplemented with 10% FCS, 100 U/mL penicillin, 100 μg/mL streptomycin, 2.5 μg/mL amphotericin B and 2 mM glutamine. INS-1 cells were grown in GIBCO RPMI medium 1640 supplemented with 10% FCS. MIN-6 cells were cultured in DMEM supplemented with 25 mM D-glucose, 10 mM HEPES, 10% FCS, 1 mM sodium pyruvate, 50 μM b-mercaptoethanol, 100 U/mL penicillin and 100 μg/mL streptomycin. Cell culture substances were obtained from Life Technologies (Vienna, Austria) and Carl Roth (Karlsruhe, Germany). All cells were grown at 37°C with 5% CO 2 .
Method Details Transfection
For the experiments, cells were seeded in 6-well plates with (for microscopy) or without (RNA isolation) 30 mm imaging dishes. They were transiently transfected at a confluence of 60 to 70% one to two days before the measurement. The transfection mix contained (per well): 1 mL DMEM (without serum and antibiotics), 2.5 μL TransFast transfection reagent (Promega, Madison, WI, USA) and 1.5 μg plasmid DNA encoding the respective fluorescent sensor and/or 100 nM siRNA. The transfection mix was replaced with full culture medium 6 to 12 hours after transfection. The siRNAs against hexokinase 1 and hexokinase 2 were obtained from Santa Cruz Biotechnology (Heidelberg, Germany). The siRNAs are pools of three target-specific 19 nucleotide siRNAs. Control siRNA was obtained from Microsynth (Balgach, Switzerland). ATP sensors were a gift from Hiromi Imamura, Kyoto University, Kyodai Graduate School of Biostudies, Japan ( Imamura et al., 2009 ). FLHKI-pGFPN3 and FLHKII-pGFPN3 were a gift from Hossein Ardehali (Addgene plasmid # 21917 and # 21920) ( Sun et al., 2008 ). pcDNA3.1 FLII 12 Pglu-700μδ6 was a gift from Wolf Frommer (Addgene plasmid # 17866) ( Takanaga et al., 2008 ). SypHer and SypHer mt were a gift from Nicolas Demaurex (Addgene plasmid # 48250 and # 48251).
Microscopy
For all imaging experiments, cells were equilibrated in loading buffer for one hour. Loading buffer contained: 2 mM CaCl 2 , 138 mM NaCl, 5 mM KCl, 1 mM MgCl 2 , 10 mM D-glucose, 2 mM L-glutamine, 10 mM HEPES, 2.6 mM NaHCO 3 , 0.44 mM KH 2 PO 4 , 0.34 mM Na 2 HPO 4 , 0.1% vitamins, 0.2% essential amino acids, 1% penicillin-streptomycin, pH adjusted to 7.4 with NaOH. All experiments were performed at room temperature in ambient atmosphere. For the life cell imaging experiments, cells were placed in a flow chamber. A gravity-based perfusion system (NGFI, Graz, Austria) in combination with a vacuum pump (Chemistry diaphragm pump ME 1c, Vacuubrand, Wertheim, Germany) allowed the steady perfusion of the cells with fresh buffer and the switching between different buffers. Standard physiological buffer contained: 2 mM CaCl 2 , 138 mM NaCl, 5 mM KCl, 1 mM MgCl 2 , 10 mM D-glucose, 10 mM HEPES, pH adjusted to 7.4 with NaOH. For glucose-free conditions, 10 mM D-mannitol (Sigma Aldrich, Vienna, Austria) was added instead of glucose. If required, glucose was replaced by 2-deoxy-D-glucose (2-DG, Alfa Aesar, ThermoFisher, Karlsruhe, Germany) or D-mannose (Carl Roth, Karlsruhe, Germany). Oligomycin and antimycin A were dissolved from 10 mM stock solutions (in DMSO). Oligomycin was obtained from Tocris (Bristol, UK) or Sigma Aldrich (Vienna, Austria), Antimycin A was from Sigma Aldrich (Vienna, Austria). Other chemicals were from Carl Roth (Karlsruhe, Germany). Cells were selected randomly for the measurement, the total numbers of cells measured for each experiment are indicated in the figure legends. The measurement was performed with an iMic inverted and advanced fluorescent microscope using a x40 magnification objective (alpha Plan Fluor x40, Zeiss, Göttingen, Germany) with a motorized sample stage (TILL Photonics, Graefling, Germany). For control and acquisition, the software Live Acquisition 2 (TILL Photonics) was used. CFP/YFP FRET sensors were excited at a wavelength of 430 nm; emission was collected simultaneously at 535 and 480 nm using an optical beam-splitter (Dichroic 69008ET-ECFP/EYFP/mCherry). Data processing was performed with the Offline Analysis application (TILL Photonics). The mitochondrial membrane potential was measured with the fluorescent dye TMRM (Molecular Probes, Invitrogen, Eugene, OR, USA). TMRM was visualized at an excitation of 550 nm and emission of 575 nm. The SIM-setup used is composed of a 405 nm, 488 nm, 515 nm, 532 nm and a 561 nm excitation laser introduced at the back focal plane inside the SIM-box with a multimodal optical fiber. For super-resolution, a CFI SR Apochromat TIRF 100x-oil (NA 1.49) objective was mounted on a Nikon-Structured Illumination Microscopy (N-SIM ® ) System with standard wide field and SIM filter sets and equipped with two Andor iXon3 ® EMCCD camera mounted to a Two Camera Imaging Adaptor (Nikon Austria, Vienna, Austria). Cells were incubated for 40 min with Mitotracker Red-FM in loading buffer prior to imaging and washed twice with loading buffer. GFP was excited at 488 nm, MitoTracker Red was excited at 561 nm. For calibration and reconstruction of SIM images, the Nikon software Nis-Elements was used. To align both channels for parallel dual color experiments NIS-Elements Two-CAM registration was used taking the TetraSpeck bead samples. Image analysis was done using a custom-made ImageJ macro. Cells were selected by hand within the SIM images. Images were background corrected with an ImageJ Plugin (Mosaic Suite, background subtractor, NIH). The colocalization coefficients Pearson and Manders 1 and 2 were determined on a single cell basis with the ImageJ ( Schneider et al., 2012 ) coloc 2 tool. Channel 1 represents the GFP and channel 2 the mCherry label. While the Pearson coefficient was determined with not thresholded data, the Manders 1 and 2 coefficients were determined on the basis of Costes thresholded images. mRNA isolation and qRT-PCR For qRT-PCR total RNA was isolated with a total RNA isolation kit (Peqlab, Erlangen, Germany). For reverse transcription, a cDNA synthesis kit (Applied Biosystems, Foster City, CA, USA) was used. For qRT-PCR, the QuantiFast SYBR Green RT-PCR kit (QIAGEN, Hilden, Germany) was used. Relative gene expression was normalized to human GAPDH (QuantiTect; QIAGEN). The reaction was performed on a LightCycler 480 (Roche Diagnostics, Vienna, Austria). Primers were obtained from Invitrogen (Vienna, Austria); their sequences were as follows (5′-3′): HK1 forward primer GACTCGCTTCAGGAAGGAGATG, HK1 reverse primer ACATCTTGAC TGTGGCTGTTGG, HK2 forward primer GATTGTCCGTAACATTCTCATCGA, HK2 reverse primer TGTCTTGAGCCGCTCTGAGAT.
Measurement of mitochondrial respiration
One day before the experiment cells were plated on XF96 polystyrene cell culture microplates (Seahorse ® , Agilent, CA, USA). They had to be 100% confluent on the day of the experiment. Before the measurement cells were washed and incubated in XF assay medium supplemented with 1 mM sodium pyruvate, 2 mM glutamine and 5.5 mM D-glucose. An XF96 extracellular flux analyzer was used to measure oxygen consumption rate (OCR) and extracellular acidification rate (ECAR). OCR (pmol O 2 /min) and ECAR (mpH/min) values were normalized to protein content.
Quantification and Statistical Analysis
For data analysis, Microsoft Excel (Redmond, WA, USA) and GraphPad Prism5 (GraphPad Software Inc.) were used. In case of both the FRET acceptor YFP and FRET donor CFP intensities, the respective background signals were subtracted. Then the YFP/CFP ratio was calculated. In case of live cell imaging data, curve fitting was used to correct for bleaching. Representative ratio images shown in Figure 1A and Video S1 were created using MetaMorph microscopy automation and image analysis software (Molecular Devices, Sunnyvale, CA, USA). Statistical analysis was performed with GraphPad Prism5 using either unpaired Student’s t test or one-way ANOVA with Tukey’s Multiple Comparison Test. n represents the number of independent experiments (at least three), and is indicated in the figure legends; the total number of measured cells is also indicated (e.g., n = 5/42 cells means 5 experiments with a total of 42 cells).
Experimental Model and Subject Details HeLa S3, H1299, and SH-SY5Y cells come from ATCC; MIN-6, MDA-MB231, MCF7, SkBr3, Calu-3 and A549 cells from the Core Facility Alternative Biomodels and Preclinical Imaging, Medical University of Graz (Graz, Austria). INS-1 cells were obtained from C.B. Newgard, Department of Pharmacology and Cancer Biology, Duke University School of Medicine, USA ( Hohmeier et al., 2000 ).
Mouse Embryonic Fibroblasts
(MEFs) were a gift from Thomas Simmen, Department of Cell Biology, University of Alberta, Canada. HeLa, MCF7, MDA-MB231, SkBr3, H1299 and MEF cells were grown in Dulbecco’s modified Eagle’s medium (DMEM) containing 10% FCS, 100 U/mL penicillin, 100 μg/mL streptomycin, 2.5 μg/mL amphotericin B, and 2 mM glutamine. A549, Calu-3, and SH-SY5Y cells were cultivated in a 1:1 mixture of Ham’s F12 medium and DMEM supplemented with 10% FCS, 100 U/mL penicillin, 100 μg/mL streptomycin, 2.5 μg/mL amphotericin B and 2 mM glutamine. INS-1 cells were grown in GIBCO RPMI medium 1640 supplemented with 10% FCS. MIN-6 cells were cultured in DMEM supplemented with 25 mM D-glucose, 10 mM HEPES, 10% FCS, 1 mM sodium pyruvate, 50 μM b-mercaptoethanol, 100 U/mL penicillin and 100 μg/mL streptomycin. Cell culture substances were obtained from Life Technologies (Vienna, Austria) and Carl Roth (Karlsruhe, Germany). All cells were grown at 37°C with 5% CO 2 .
Method Details Transfection
For the experiments, cells were seeded in 6-well plates with (for microscopy) or without (RNA isolation) 30 mm imaging dishes. They were transiently transfected at a confluence of 60 to 70% one to two days before the measurement. The transfection mix contained (per well): 1 mL DMEM (without serum and antibiotics), 2.5 μL TransFast transfection reagent (Promega, Madison, WI, USA) and 1.5 μg plasmid DNA encoding the respective fluorescent sensor and/or 100 nM siRNA. The transfection mix was replaced with full culture medium 6 to 12 hours after transfection. The siRNAs against hexokinase 1 and hexokinase 2 were obtained from Santa Cruz Biotechnology (Heidelberg, Germany). The siRNAs are pools of three target-specific 19 nucleotide siRNAs. Control siRNA was obtained from Microsynth (Balgach, Switzerland). ATP sensors were a gift from Hiromi Imamura, Kyoto University, Kyodai Graduate School of Biostudies, Japan ( Imamura et al., 2009 ). FLHKI-pGFPN3 and FLHKII-pGFPN3 were a gift from Hossein Ardehali (Addgene plasmid # 21917 and # 21920) ( Sun et al., 2008 ). pcDNA3.1 FLII 12 Pglu-700μδ6 was a gift from Wolf Frommer (Addgene plasmid # 17866) ( Takanaga et al., 2008 ). SypHer and SypHer mt were a gift from Nicolas Demaurex (Addgene plasmid # 48250 and # 48251).
Microscopy
For all imaging experiments, cells were equilibrated in loading buffer for one hour. Loading buffer contained: 2 mM CaCl 2 , 138 mM NaCl, 5 mM KCl, 1 mM MgCl 2 , 10 mM D-glucose, 2 mM L-glutamine, 10 mM HEPES, 2.6 mM NaHCO 3 , 0.44 mM KH 2 PO 4 , 0.34 mM Na 2 HPO 4 , 0.1% vitamins, 0.2% essential amino acids, 1% penicillin-streptomycin, pH adjusted to 7.4 with NaOH. All experiments were performed at room temperature in ambient atmosphere. For the life cell imaging experiments, cells were placed in a flow chamber. A gravity-based perfusion system (NGFI, Graz, Austria) in combination with a vacuum pump (Chemistry diaphragm pump ME 1c, Vacuubrand, Wertheim, Germany) allowed the steady perfusion of the cells with fresh buffer and the switching between different buffers. Standard physiological buffer contained: 2 mM CaCl 2 , 138 mM NaCl, 5 mM KCl, 1 mM MgCl 2 , 10 mM D-glucose, 10 mM HEPES, pH adjusted to 7.4 with NaOH. For glucose-free conditions, 10 mM D-mannitol (Sigma Aldrich, Vienna, Austria) was added instead of glucose. If required, glucose was replaced by 2-deoxy-D-glucose (2-DG, Alfa Aesar, ThermoFisher, Karlsruhe, Germany) or D-mannose (Carl Roth, Karlsruhe, Germany). Oligomycin and antimycin A were dissolved from 10 mM stock solutions (in DMSO). Oligomycin was obtained from Tocris (Bristol, UK) or Sigma Aldrich (Vienna, Austria), Antimycin A was from Sigma Aldrich (Vienna, Austria). Other chemicals were from Carl Roth (Karlsruhe, Germany). Cells were selected randomly for the measurement, the total numbers of cells measured for each experiment are indicated in the figure legends. The measurement was performed with an iMic inverted and advanced fluorescent microscope using a x40 magnification objective (alpha Plan Fluor x40, Zeiss, Göttingen, Germany) with a motorized sample stage (TILL Photonics, Graefling, Germany). For control and acquisition, the software Live Acquisition 2 (TILL Photonics) was used. CFP/YFP FRET sensors were excited at a wavelength of 430 nm; emission was collected simultaneously at 535 and 480 nm using an optical beam-splitter (Dichroic 69008ET-ECFP/EYFP/mCherry). Data processing was performed with the Offline Analysis application (TILL Photonics). The mitochondrial membrane potential was measured with the fluorescent dye TMRM (Molecular Probes, Invitrogen, Eugene, OR, USA). TMRM was visualized at an excitation of 550 nm and emission of 575 nm. The SIM-setup used is composed of a 405 nm, 488 nm, 515 nm, 532 nm and a 561 nm excitation laser introduced at the back focal plane inside the SIM-box with a multimodal optical fiber. For super-resolution, a CFI SR Apochromat TIRF 100x-oil (NA 1.49) objective was mounted on a Nikon-Structured Illumination Microscopy (N-SIM ® ) System with standard wide field and SIM filter sets and equipped with two Andor iXon3 ® EMCCD camera mounted to a Two Camera Imaging Adaptor (Nikon Austria, Vienna, Austria). Cells were incubated for 40 min with Mitotracker Red-FM in loading buffer prior to imaging and washed twice with loading buffer. GFP was excited at 488 nm, MitoTracker Red was excited at 561 nm. For calibration and reconstruction of SIM images, the Nikon software Nis-Elements was used. To align both channels for parallel dual color experiments NIS-Elements Two-CAM registration was used taking the TetraSpeck bead samples. Image analysis was done using a custom-made ImageJ macro. Cells were selected by hand within the SIM images. Images were background corrected with an ImageJ Plugin (Mosaic Suite, background subtractor, NIH). The colocalization coefficients Pearson and Manders 1 and 2 were determined on a single cell basis with the ImageJ ( Schneider et al., 2012 ) coloc 2 tool. Channel 1 represents the GFP and channel 2 the mCherry label. While the Pearson coefficient was determined with not thresholded data, the Manders 1 and 2 coefficients were determined on the basis of Costes thresholded images. mRNA isolation and qRT-PCR For qRT-PCR total RNA was isolated with a total RNA isolation kit (Peqlab, Erlangen, Germany). For reverse transcription, a cDNA synthesis kit (Applied Biosystems, Foster City, CA, USA) was used. For qRT-PCR, the QuantiFast SYBR Green RT-PCR kit (QIAGEN, Hilden, Germany) was used. Relative gene expression was normalized to human GAPDH (QuantiTect; QIAGEN). The reaction was performed on a LightCycler 480 (Roche Diagnostics, Vienna, Austria). Primers were obtained from Invitrogen (Vienna, Austria); their sequences were as follows (5′-3′): HK1 forward primer GACTCGCTTCAGGAAGGAGATG, HK1 reverse primer ACATCTTGAC TGTGGCTGTTGG, HK2 forward primer GATTGTCCGTAACATTCTCATCGA, HK2 reverse primer TGTCTTGAGCCGCTCTGAGAT.
Measurement of mitochondrial respiration
One day before the experiment cells were plated on XF96 polystyrene cell culture microplates (Seahorse ® , Agilent, CA, USA). They had to be 100% confluent on the day of the experiment. Before the measurement cells were washed and incubated in XF assay medium supplemented with 1 mM sodium pyruvate, 2 mM glutamine and 5.5 mM D-glucose. An XF96 extracellular flux analyzer was used to measure oxygen consumption rate (OCR) and extracellular acidification rate (ECAR). OCR (pmol O 2 /min) and ECAR (mpH/min) values were normalized to protein content.
Supplementary Material Supplemental Information includes seven figures and one video and can be found with this article online at https://doi.org/10.1016/j.celrep.2018.09.027 . Figures S1-S7
📊 Figures
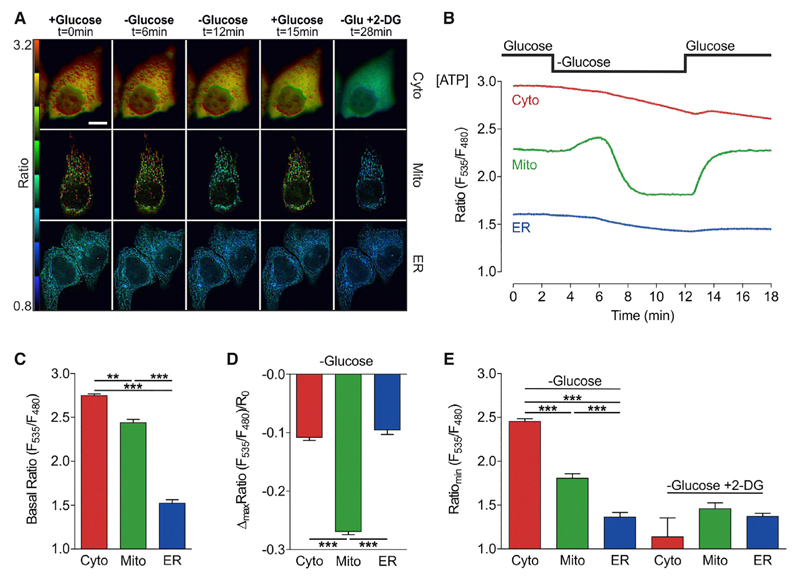
Figure 1
Acute Glucose Starvation Causes Strong ATP Alterations within Mitochondria of HeLa Cells
(A) Representative FRET ratio images of cytosolic, mitochondrial, and ER-targeted ATP probes (ATeams) under basal conditions and at different time points after glucose depletion and subsequent 2-DG tr...

Figure 2
Transient Mitochondrial ATP Increase upon Glucose Deprivation Depends on Mitochondria-Located Hexokinase 1 and 2 Activities
(A) Representative mitochondrial ATP responses to glucose depletion. See also Figure S1F . (B) Statistical analysis of the onset of mitochondrial ATP decrease (n = 6/76 cells; mean, SD). (C) Represent...
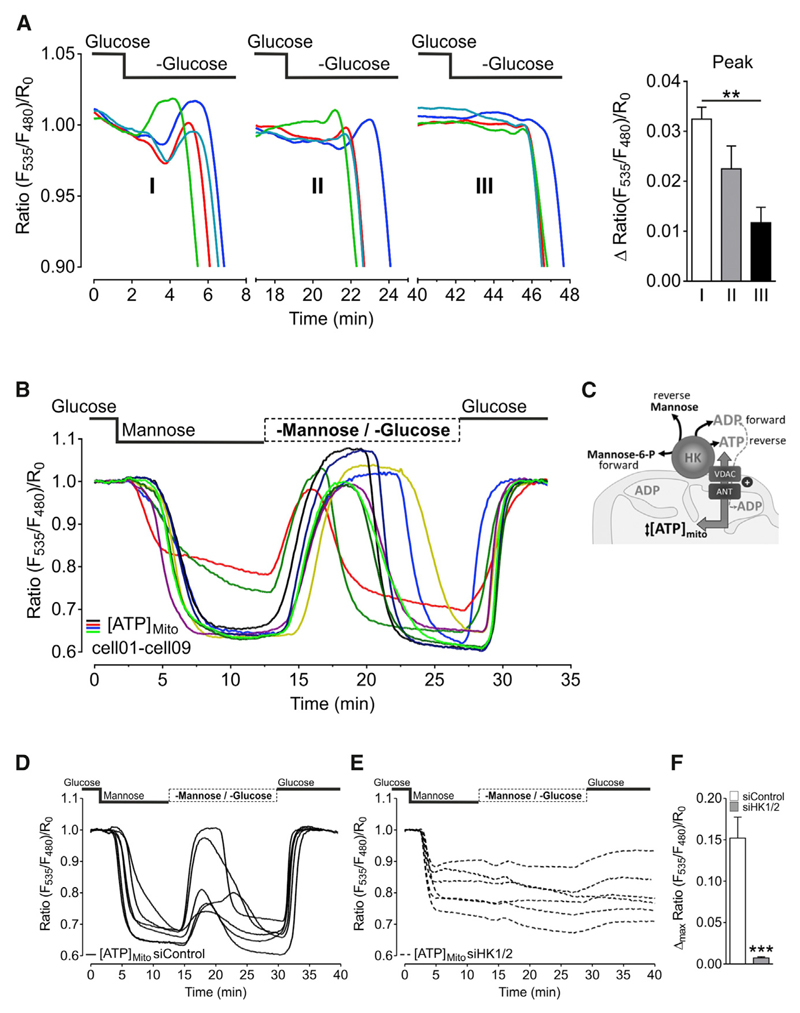
Figure 3
Hexokinase Reaction May Be Reversible and Fuel Mitochondria with ATP
(A) Left panel: representative curves showing the transient rise of mitochondrial ATP and the onset of mitochondrial ATP depletion in response to repeated (three times in a row) glucose depletion in H...
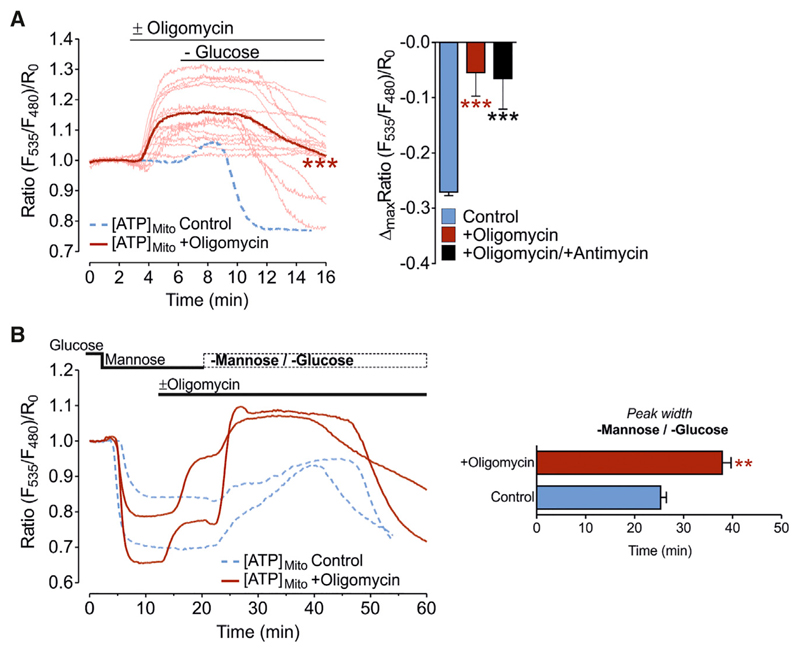
Figure 4
ATP Synthase in HeLa Cells Works in Reverse Mode and Does Not Contribute to Mitochondrial ATP Elevations upon Glucose or Mannose Removal
(A) Left panel: mitochondrial ATP responses to oligomycin (2 u03bcM) treatment, followed by glucose withdrawal in HeLa cells; single-cell responses (pale red lines) and mean curve (distinct red line)....
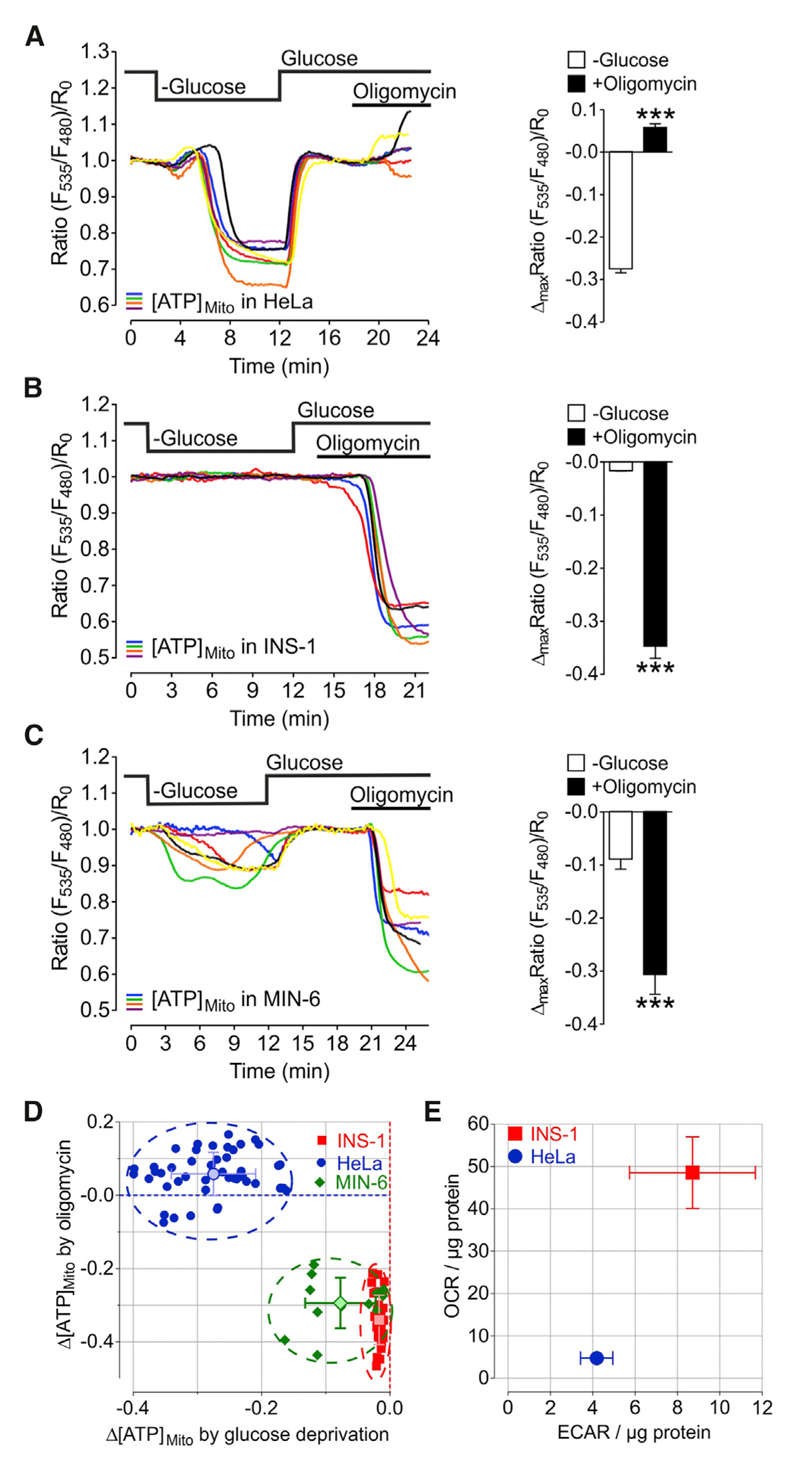
Figure 5
Mitochondrial ATP Depletion upon Glucose Deprivation Indirectly Correlates with Mitochondrial Respiration
(Au2013C) Left panels: representative single-cell mitochondrial ATP responses of (A) HeLa, (B) INS-1, and (C) MIN-6 cells to glucose depletion and oligomycin (2 u03bcM) treatment. Right panels: statis...
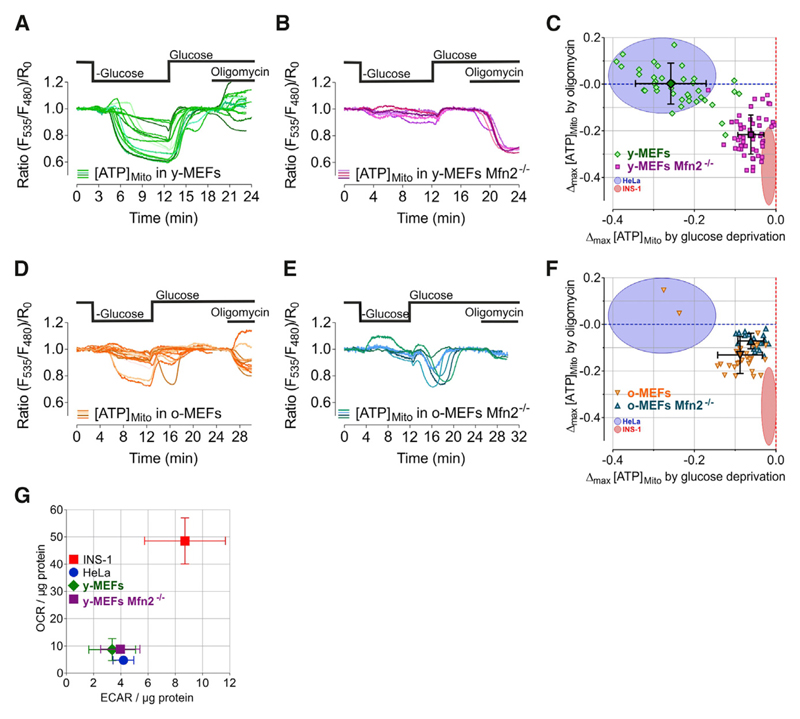
Figure 6
Cellular Aging and Ablation of Mfn2 Specifically Alter Mitochondrial ATP Dynamics in MEFs
(A, B, D, and E) Representative mitochondrial ATP responses to glucose depletion and inhibition of the ATP synthase with oligomycin (2 u03bcM) in (A) young/low passages MEFs (y-MEFs), (B) young Mfn2 u...
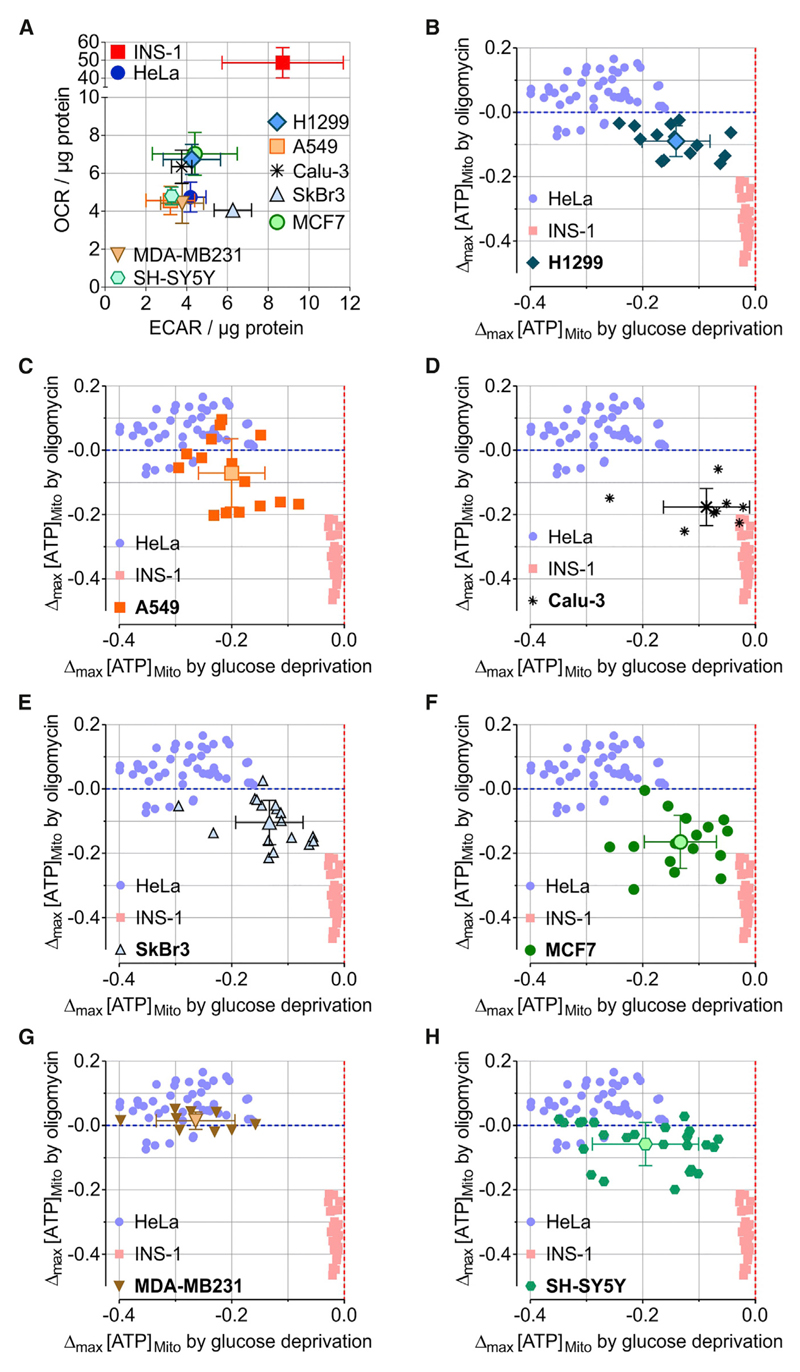
Figure 7
Imaging of Mitochondrial ATP Dynamics in Single Cancer Cells Defines Distinct Metabolic Settings
(A) Oxygen consumption rate (OCR) and extracellular acidification rate (ECAR) of different cancer cell lines (H1299, A549, Calu-3, SkBr3, MCF7, MDA-MB231, and SH-SY5Y) and HeLa and INS-1 cells for com...
Figure images are served from the NIH/NLM PubMed Central Open Access Subset or Europe PMC; copyright remains with the publishers and authors.
💬 Discussion
0 commentsNo comments yet. Be the first to start a discussion!
Leave a Comment