Abstract
ABSTRACT ATP is a key molecule of cell physiology, but despite its importance, there are currently no methods for monitoring single-cell ATP fluctuations in live bacteria. This is a major obstacle in studies of bacterial energy metabolism, because there is a growing awareness that bacteria respond to stressors such as antibiotics in a highly individualistic manner. Here, we present a method for long-term single-cell tracking of ATP levels in Mycobacterium smegmatis based on a combination of microfluidics, time-lapse microscopy, and Förster resonance energy transfer (FRET)-based ATP biosensors. Upon treating cells with antibiotics, we observed that individual cells undergo an abrupt and irreversible switch from high to low intracellular ATP levels. The kinetics and extent of ATP switching clearly discriminate between an inhibitor of ATP synthesis and other classes of antibiotics. Cells that resume growth after 24 h of antibiotic treatment maintain high ATP levels throughout the exposure period. In contrast, antibiotic-treated cells that switch from ATP-high to ATP-low states never resume growth after antibiotic washout. Surprisingly, only a subset of these nongrowing ATP-low cells stains with propidium iodide (PI), a widely used live/dead cell marker. These experiments also reveal a cryptic subset of cells that do not resume growth after antibiotic washout despite remaining ATP high and PI negative. We conclude that ATP tracking is a more dynamic, sensitive, reliable, and discriminating marker of cell viability than staining with PI. This method could be used in studies to evaluate antimicrobial effectiveness and mechanism of action, as well as for high-throughput screening. IMPORTANCE New antimicrobials are urgently needed to stem the rising tide of antibiotic-resistant bacteria. All antibiotics are expected to affect bacterial energy metabolism, directly or indirectly, yet tools to assess the impact of antibiotics on the ATP content of individual bacterial cells are lacking. The method described here for single-cell tracking of intracellular ATP in live bacteria has many advantages compared to conventional ensemble-averaged assays. It provides a continuous real-time readout of bacterial ATP content, cell vitality, and antimicrobial mechanism of action with high temporal resolution at the single-cell level. In combination with high-throughput microfluidic devices and automated microscopy, this method also has the potential to serve as a novel screening tool in antimicrobial drug discovery.
🔬 Techniques
🧬 Organisms
✨ Fluorophores
🧪 Sample Preparation
🧪 Reagent Suppliers
📷 Detectors
💻 Software Details
🏛️ Research Organizations (ROR)
Affiliated research institutions:
📋 Methods
Bacterial strains and culture conditions. M. smegmatis mc 2 155 (wild-type) and derivative strains were grown at 37°C in Middlebrook 7H9 (Difco) liquid medium supplemented with 10% albumin-dextrose-saline (ADS) (BD Biosciences), 0.5% glycerol, and 0.05% Tween 80, Middlebrook 7H10 (Difco) solid medium supplemented with 10% oleic acid-albumin-dextrose-catalase (OADC) (BD Biosciences) and 0.5% glycerol, or Luria-Bertani (LB) solid medium. Frozen stocks were prepared by growing liquid cultures to mid-exponential phase (optical density at 600 nm [OD 600 ] of 0.6 to 0.8), adding glycerol to a 15% final concentration, and storing aliquots at −80°C. For time-lapse experiments bacteria were grown for 3 days at 37°C in M9 minimal medium consisting of M9 salts (Sigma), 2 mM MgSO 4 , and 0.1 mM CaCl 2 supplemented with either 0.5% acetate or 0.5% glucose (minimal-acetate or minimal-glucose). Frozen stocks were prepared by growing minimal-acetate or minimal-glucose cultures to mid-exponential phase and storing aliquots at −80°C. For time-lapse microscopy experiments, aliquots were diluted 10-fold and grown to an OD 600 of ~0.3 to 0.5. ATP biosensors. ATP biosensor plasmids pRSET-ATeam3.10 ( K d = 7.4 µM), pRSET-ATeam1.03 YEMK ( K d = 1.2 mM), and pRSET-ATeam1.03 KK ( K d > 10 mM) were used as templates for PCR amplification to introduce the mycobacterial Shine-Dalgarno sequence and start codon. The forward primer for all three ATeam constructs was 5′ TTAATTAAGAAGGAGATATACATATGCGGGGTTCTCATCATC 3′. The reverse primer for pRSET-ATeam3.10 was 5′ AGTACTTCACTTGTACAGCTCGTCCATGC 3′. The reverse primer for ATeam1.03 YEMK and pRSET-ATeam1.03 KK was 5′ AGTACTCAAGCTTACTCGATGTTGTGGC 3′. PCR products were restricted with PacI and ScaI and ligated into the integrating shuttle vector pND235 (which contains the mycobacteriophage L5 attP - int sequences) downstream of a strong constitutive mycobacterial promoter. Plasmids were electroporated into M. smegmatis , and transformants were selected on LB solid medium supplemented with 50 µg/ml kanamycin.
Show full methods section
Bacterial strains and culture conditions. M. smegmatis mc 2 155 (wild-type) and derivative strains were grown at 37°C in Middlebrook 7H9 (Difco) liquid medium supplemented with 10% albumin-dextrose-saline (ADS) (BD Biosciences), 0.5% glycerol, and 0.05% Tween 80, Middlebrook 7H10 (Difco) solid medium supplemented with 10% oleic acid-albumin-dextrose-catalase (OADC) (BD Biosciences) and 0.5% glycerol, or Luria-Bertani (LB) solid medium. Frozen stocks were prepared by growing liquid cultures to mid-exponential phase (optical density at 600 nm [OD 600 ] of 0.6 to 0.8), adding glycerol to a 15% final concentration, and storing aliquots at −80°C. For time-lapse experiments bacteria were grown for 3 days at 37°C in M9 minimal medium consisting of M9 salts (Sigma), 2 mM MgSO 4 , and 0.1 mM CaCl 2 supplemented with either 0.5% acetate or 0.5% glucose (minimal-acetate or minimal-glucose). Frozen stocks were prepared by growing minimal-acetate or minimal-glucose cultures to mid-exponential phase and storing aliquots at −80°C. For time-lapse microscopy experiments, aliquots were diluted 10-fold and grown to an OD 600 of ~0.3 to 0.5. ATP biosensors. ATP biosensor plasmids pRSET-ATeam3.10 ( K d = 7.4 µM), pRSET-ATeam1.03 YEMK ( K d = 1.2 mM), and pRSET-ATeam1.03 KK ( K d > 10 mM) were used as templates for PCR amplification to introduce the mycobacterial Shine-Dalgarno sequence and start codon. The forward primer for all three ATeam constructs was 5′ TTAATTAAGAAGGAGATATACATATGCGGGGTTCTCATCATC 3′. The reverse primer for pRSET-ATeam3.10 was 5′ AGTACTTCACTTGTACAGCTCGTCCATGC 3′. The reverse primer for ATeam1.03 YEMK and pRSET-ATeam1.03 KK was 5′ AGTACTCAAGCTTACTCGATGTTGTGGC 3′. PCR products were restricted with PacI and ScaI and ligated into the integrating shuttle vector pND235 (which contains the mycobacteriophage L5 attP - int sequences) downstream of a strong constitutive mycobacterial promoter. Plasmids were electroporated into M. smegmatis , and transformants were selected on LB solid medium supplemented with 50 µg/ml kanamycin.
Construction of an F420-deficient strain of M. smegmatis
(Δ fbiC ). An M. smegmatis strain with an in-frame deletion of the fbiC (MSMEG_5126) gene was constructed using a two-step homologous recombination strategy ( 41 ). The recombination template was constructed by PCR amplification of ~800-bp fragments upstream of the fbiC start codon (fragment A) and downstream of the fbiC stop codon (fragment B). Primers were designed to introduce 5′ PacI and 3′ AvrII sites into fragment A and 5′ AvrII and 3′ AscI sites into fragment B. The reverse primers for amplification of the upstream regions were designed with an AvrII restriction site in-frame with the start codon. The forward primers for amplification of the downstream regions were designed with an AvrII restriction site in-frame with the stop codon. Amplicons were restricted and ligated into unique PacI and AscI sites of the suicide vector pJG1100, which contains aph (kanamycin resistance), hyg (hygromycin resistance), and sacB (sucrose sensitivity) markers ( 41 , 42 ). The resulting plasmid (pZM217) was verified by DNA sequencing. pZM217 was electroporated into M. smegmatis , and transformants were selected on 7H10 solid medium containing 50 µg/ml hygromycin and 25 µg/ml kanamycin. Individual colonies were picked, grown in 7H9 liquid medium (no antibiotic), and then plated on 7H10 solid medium containing 5% sucrose to select for cells in which plasmid excision had occurred. Individual colonies were picked, and the deletion of fbiC was confirmed by PCR analysis. The absence of the F420 coenzyme in the Δ fbiC strain was confirmed by high-performance liquid chromatography (HPLC) ( 43 ). Time-lapse microscopy. Bacteria were grown to mid-exponential phase in M9 minimal medium consisting of M9 salts (Sigma), 2 mM MgSO 4 , 0.1 mM CaCl 2 supplemented with either 0.5% acetate or 0.5% glucose (minimal-acetate or minimal-glucose) at 37°C, concentrated 10-fold, and cultured in a custom-made microfluidic device at 37°C, as described previously ( 28 ). Where noted, the flow medium contained 5 µg/ml bedaquiline, 500 µg/ml isoniazid, 125 µg/ml streptomycin, 200 µg/ml rifampin, or 2.5 µg/ml ciprofloxacin. Images were recorded with a CoolSnap HQ2 charge-coupled device (CCD) camera on phase-contrast, CFPex-YFPem (FRET), and YFPex-YFPem (YFP) channels at 10-min intervals using a DeltaVision personal DV microscope (Applied Precision) equipped with a 100× oil immersion objective and a xenon lamp. Fluorescence images were obtained using a FRET CFP/YFP HC filter set (BrightLine HC 438/24, 542/27; HC beam splitter BS 458) and YFP exciter (AHF Analysentechnik 515/10). Exposure times and neutral density filters were 0.1 s and 50% for phase contrast, 0.3 s and 32% for FRET (CFP/YFP), and 0.1 s and 10% for YFP. Propidium iodide (PI) staining was performed using 0.4 µM red PI (Invitrogen) for 30 min. Images were acquired using an exposure time of 0.1 s with a 50% neutral density filter in combination with an mCherry filter set (excitation filter, 575/25; emission filter, 632/60). All experiments were repeated at least two times with similar results for ~100 microcolonies. Image processing and single-cell analysis. Images acquired using Resolve3D softWoRx-Acquire version 4.0.0 (Applied Precision) were exported as 16-bit TIFF files and processed using ImageJ 1.46 (NIH) and BactImAS ( 44 ). Background was subtracted from each fluorescence channel by deducting the fluorescence in a cell-free area. Image stacks were aligned using a custom-made plugin, Stackreg ( http://bigwww.epfl.ch/thevenaz/stackreg/ ). FRET/YFP ratios were calculated using Ratio Plus ( http://rsbweb.nih.gov/ij/plugins/ratio-plus.html ). For ratiometric movies, Ratio Plus was modified to use clipping on FRET images based on the YFP background. FRET/YFP ratiometric values of >2 are represented by the upper bound of the range. Single-cell time traces were obtained by tracking background-subtracted intracellular fluorescence on FRET and YFP channels in a large area within the contours of a single cell. Single-cell measurements of intracellular ATP. Previously, ATeam biosensors have been used for live-cell ATP measurements for no longer than 7 h ( 26 ), which is insufficient for assessment of the impact of antibiotics on bacterial cells. A common effect of antibiotic exposure is inhibition of de novo protein synthesis, which could lead to a gradual decline in the level of the ATeam protein. Ratiometric (FRET/YFP) measurements should be insensitive to the absolute levels of reporter protein in the cell, since the same protein is responsible for both signals, unless reporter-derived fluorescence falls below background fluorescence. In cells that had been exposed to bedaquiline for more than 24 h, we found that there was a slow increase in the measured FRET/YFP ratio ( Fig. 2A and C ), which could be due to a low signal-to-noise (background) ratio when there is not much fluorescent reporter left in the cell ( Fig. 2A and C ; also, see Fig. S2A in the supplemental material). Total fluorescence of a single cell comprises biosensor fluorescence and two sources of background fluorescence: autofluorescence present within cells and background fluorescence in a cell-free image area. Despite subtracting the out-of-cell fluorescence for every image, small variations within an image remained (
📊 Figures
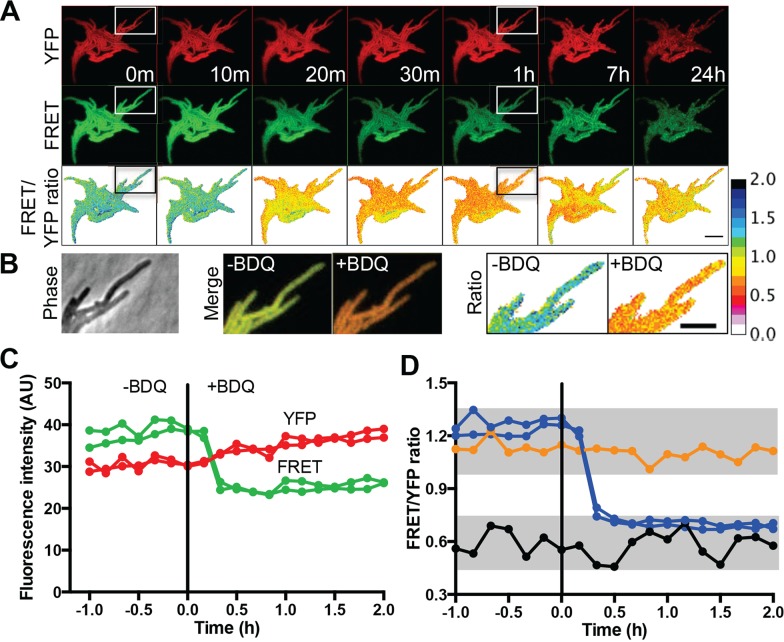
FIGu00a01u00a0
Real-time measurements of single-cell ATP using genetically encoded biosensors. Wild-type M.u00a0smegmatis expressing ATeam biosensors with high (WT_HA), medium (WT_MA), or low (WT_LA) affinity for AT...
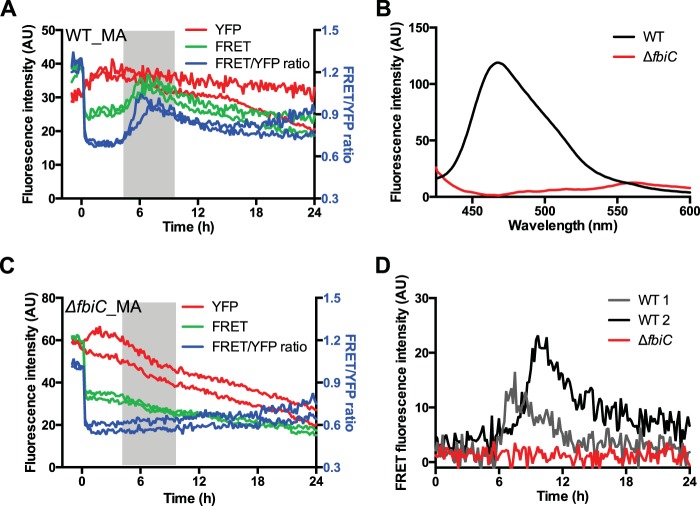
FIGu00a02u00a0
Antibiotic-induced cyan autofluorescence eliminated by deletion of fbiC . Strains used in each experiment are indicated in the top corner of each panel. Cells were cultured in minimal-acetate medium i...
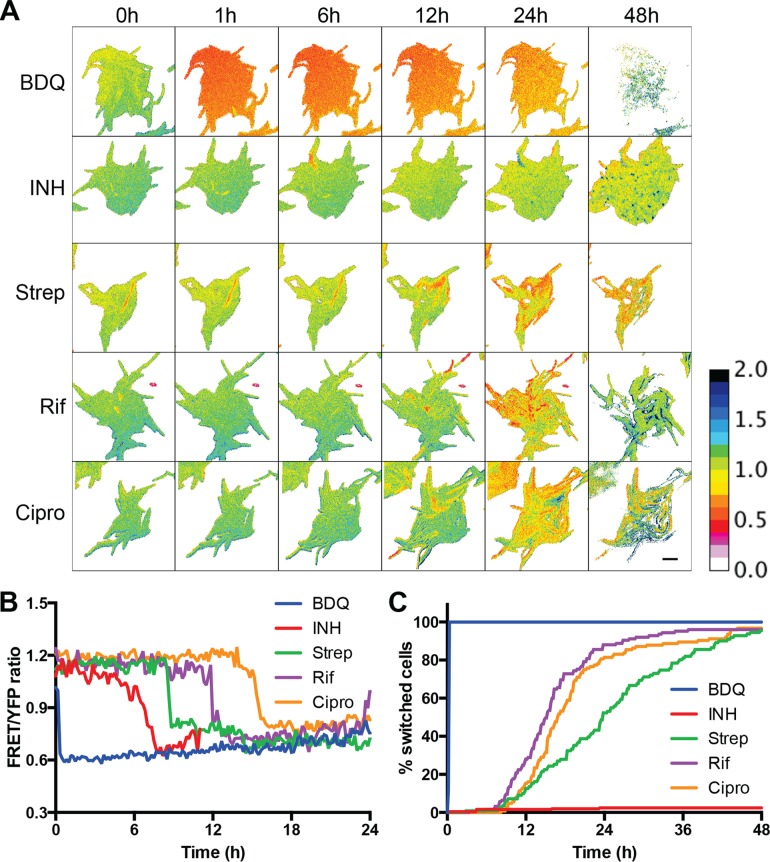
FIGu00a03u00a0
Discrimination of antibiotic classes based on kinetics of ATP switching in single cells. u0394 fbiC _MA cells were cultured in minimal-acetate flow medium in a microfluidic device for 24 h before addi...
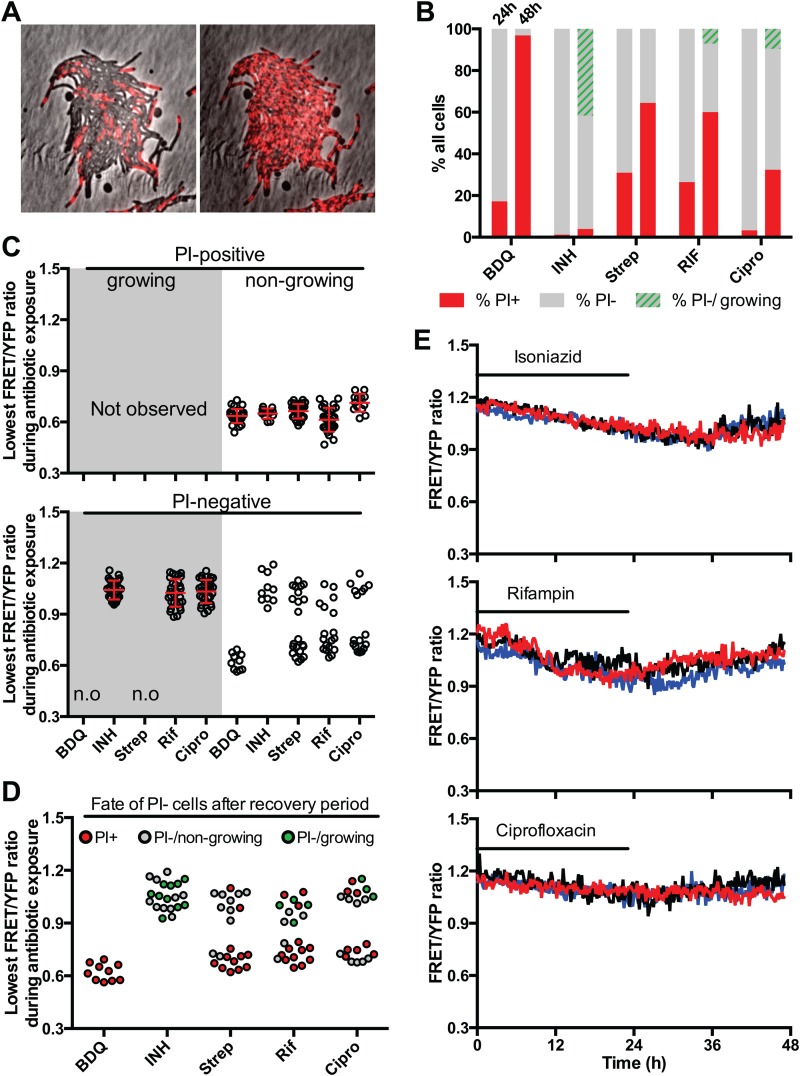
FIGu00a04u00a0
Antibiotic-induced ATP switching and PI staining as markers of live/dead status. u0394 fbiC _MA cells were cultured in minimal-acetate flow medium, exposed to antibiotic, and analyzed as described in ...
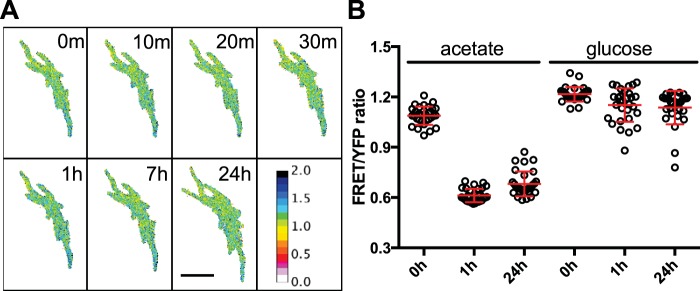
FIGu00a05u00a0
Glucose-grown cells are refractory to bedaquiline-mediated growth inhibition and killing. WT_MA cells were cultured in minimal-acetate or minimal-glucose flow medium in a microfluidic device for ~24 h...
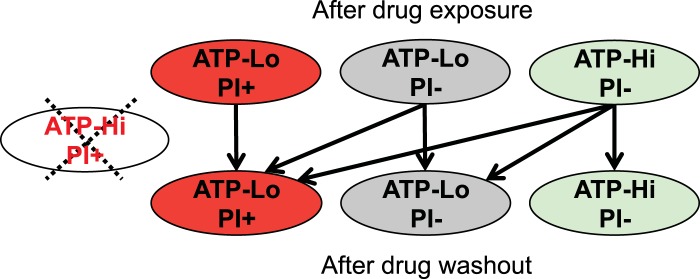
FIGu00a06u00a0
Classification of single-cell fates based on ATP biosensors and PI staining. ATP biosensor tracking and PI staining are compatible and complementary assays for evaluating the physiology and fate of an...
Figure images are served from the NIH/NLM PubMed Central Open Access Subset or Europe PMC; copyright remains with the publishers and authors.
💬 Discussion
0 commentsNo comments yet. Be the first to start a discussion!
Leave a Comment