Abstract
AbstractDifferential interference contrast (DIC) microscopy allows high-contrast, low-phototoxicity, and label-free imaging of transparent biological objects, and has been applied in the field of cellular morphology, cell segmentation, particle tracking, optical measurement and others. Commercial DIC microscopy based on Nomarski or Wollaston prism resorts to the interference of two polarized waves with a lateral differential offset (shear) and axial phase shift (bias). However, the shear generated by these prisms is limited to the rectilinear direction, unfortunately resulting in anisotropic contrast imaging. Here we propose an ultracompact metasurface-assisted isotropic DIC (i-DIC) microscopy based on a grand original pattern of radial shear interferometry, that converts the rectilinear shear into rotationally symmetric along radial direction, enabling single-shot isotropic imaging capabilities. The i-DIC presents a complementary fusion of typical meta-optics, traditional microscopes and integrated optical system, and showcases the promising and synergetic advancements in edge detection, particle motion tracking, and label-free cellular imaging.
🔬 Techniques
💻 Software
🧪 Sample Preparation
🏭 Microscope Brands
🧪 Reagent Suppliers
💻 Software Details
🏛️ Research Organizations (ROR)
Affiliated research institutions:
📋 Methods
Tissue and cell use The study followed the tenets of the Declaration of Helsinki and was approved by the medical ethics committee of the Third Affiliated Hospital of Harbin Medical University.
Simulations
The transmission spectra are calculated using the frequency domain solver of CST Microwave Studio. The complex refractive index of Si is from Aspnes and Studna 1983: n , k 0.21–0.83 µm. The refractive index is set to 3.89 and the extinction coefficient is 0.02 at 620 nm. The refractive index of Al 2 O 3 is from Malitson and Dodge 1972: α-Al 2 O 3 (Sapphire); n (o) 0.20–5.0 µm. The refractive index is set to 1.77. The Si nanofins with the height of 360 nm are modeled as a periodic unit cell (lattice constant 300 nm) on the Al 2 O 3 substrate. Metasurface fabrication The film of single crystalline silicon with a thickness of 360 nm was first grown on a double-side polished sapphire (Latech Scientific Supply Pte. Ltd.). Then hydrogen silsesquioxane (HSQ, Dow Corning XR-1541-006) was spin-coated onto the substrate at the speed of 4000 revolutions per minute (RPM). The mask of metasurface on HSQ was fabricated by electron beam lithography (eLine Plus, Raith GmbH) at 30 kV acceleration voltage and 360 pA beam current with a 100 × 100 μm 2 write field. The exposed samples were developed in 25% tetramethylammonium hydroxide (TMAH) solution for 2 min at room temperature (25 °C), followed by rinsing in deionized water for 20 s and dipping in isopropyl alcohol (IPA) solution for 10 s, then blow-dried using nitrogen gas. Afterward, inductively coupled plasma-reactive ion etching (ICP-RIE, Apex SLR ICP, Advance Vacuum Systems) was used to transfer the pattern into silicon film. A carbon tetrafluoride (CF4) dry-etch was first performed at 45 sccm (standard cubic centimeters per minute) gas flow for 5 s with 100 W ICP power and 100 W bias power to remove the surface oxidization layer, then hydrogen bromide (HBr) was applied with a flow rate of 100 sccm, 400 W ICP power, 100 W bias power to etch the silicon at the speed of 83 nm/min. The substrate table temperature was set as 20 °C and the chamber pressure was 10 mTorr during the etching process. Finally, the samples were immersed into hydrofluoric (HF) acid (10%) for 15 s to remove the residue HSQ mask, then cleaned with deionized water and blow-dried with nitrogen gas. Fabrication of Icon The icon samples were fabricated via direct laser writing in the photoresist. The positive photoresist AZ400K was spin-coated onto the fused-silica substrate at the speed of 3000 RPM. Subsequently, the designed patterns were exposed using direct laser writing (Heidelberg Instruments DWL 66+). Finally, the exposed samples were developed in AZ 400K Developer for 2 min at room temperature (25 °C) and blow-dried using nitrogen gas.
Show full methods section
Tissue and cell use The study followed the tenets of the Declaration of Helsinki and was approved by the medical ethics committee of the Third Affiliated Hospital of Harbin Medical University.
Simulations
The transmission spectra are calculated using the frequency domain solver of CST Microwave Studio. The complex refractive index of Si is from Aspnes and Studna 1983: n , k 0.21–0.83 µm. The refractive index is set to 3.89 and the extinction coefficient is 0.02 at 620 nm. The refractive index of Al 2 O 3 is from Malitson and Dodge 1972: α-Al 2 O 3 (Sapphire); n (o) 0.20–5.0 µm. The refractive index is set to 1.77. The Si nanofins with the height of 360 nm are modeled as a periodic unit cell (lattice constant 300 nm) on the Al 2 O 3 substrate. Metasurface fabrication The film of single crystalline silicon with a thickness of 360 nm was first grown on a double-side polished sapphire (Latech Scientific Supply Pte. Ltd.). Then hydrogen silsesquioxane (HSQ, Dow Corning XR-1541-006) was spin-coated onto the substrate at the speed of 4000 revolutions per minute (RPM). The mask of metasurface on HSQ was fabricated by electron beam lithography (eLine Plus, Raith GmbH) at 30 kV acceleration voltage and 360 pA beam current with a 100 × 100 μm 2 write field. The exposed samples were developed in 25% tetramethylammonium hydroxide (TMAH) solution for 2 min at room temperature (25 °C), followed by rinsing in deionized water for 20 s and dipping in isopropyl alcohol (IPA) solution for 10 s, then blow-dried using nitrogen gas. Afterward, inductively coupled plasma-reactive ion etching (ICP-RIE, Apex SLR ICP, Advance Vacuum Systems) was used to transfer the pattern into silicon film. A carbon tetrafluoride (CF4) dry-etch was first performed at 45 sccm (standard cubic centimeters per minute) gas flow for 5 s with 100 W ICP power and 100 W bias power to remove the surface oxidization layer, then hydrogen bromide (HBr) was applied with a flow rate of 100 sccm, 400 W ICP power, 100 W bias power to etch the silicon at the speed of 83 nm/min. The substrate table temperature was set as 20 °C and the chamber pressure was 10 mTorr during the etching process. Finally, the samples were immersed into hydrofluoric (HF) acid (10%) for 15 s to remove the residue HSQ mask, then cleaned with deionized water and blow-dried with nitrogen gas. Fabrication of Icon The icon samples were fabricated via direct laser writing in the photoresist. The positive photoresist AZ400K was spin-coated onto the fused-silica substrate at the speed of 3000 RPM. Subsequently, the designed patterns were exposed using direct laser writing (Heidelberg Instruments DWL 66+). Finally, the exposed samples were developed in AZ 400K Developer for 2 min at room temperature (25 °C) and blow-dried using nitrogen gas.
Experimental setup
A red LED light source (GCI-060401, λ = 620 ± 10 nm, Daheng Optics Co. Ltd., China) is collimated by a collimating lens (AC127-030-A, Thorlabs, USA) to generate the monochromatic plane wave. The parallel light passes through polarizer 1 (LPVISC100-MP2, Thorlabs, USA) to produce monochromatic polarized light with a polarization direction of 45° to illuminate samples. Metasurface is used to image the sample, and the object distance a and image distance b should satisfy the Gaussian formula 1 /a + 1 /b = 1 /f . The objective lens (95MM M Plan Apo HL 50× NA 0.42 Donglilai Optics Electronics Enterprise Co., LTD.) and tube lens (Zoom Lens Series 10, Donglilai Optics&Electronics Enterprise Co. LTD, China) form a secondary imaging system to visualize the images produced by metasurface. Polarizer 2 (LPVISC100-MP2, Thorlabs, USA) is placed along the −45° and the DIC image is captured by a CMOS camera (DCU224C, Thorlabs, USA) via Thorcam 3.7.0 software, and the images is processed by ImageJ v1.53 g.
Preparation of tissue and cell samples
Fresh breast cancer tissues were fixed in 10% paraformaldehyde for at least 24 h. Afterwards, the fixative was removed, and the tissues were transferred into the dehydration box. Then, breast cancer tissues were sequentially immersed in the solutions for dehydration: 70% alcohol for 4 h, 80% alcohol for 2 h, 90% alcohol for 2 h, 95% alcohol for 1 h, anhydrous ethanol for 30 min, another anhydrous ethanol for 30 min, alcohol benzene for 10 min, xylene I for 10 min, xylene II for 10 min, wax I for 1 h, wax II for 1 h, and finally wax III for 1 h to ensure that the moisture in the tissues was completely removed. The wax-soaked tissues were embedded in the embedding machine according to the requirements. The melted wax was put into the embedding box and the breast cancer tissues were taken out from the dehydration box before the wax solidified. Then, we embedded the tissues in paraffin wax and cooled them at 20 °C until they became wax blocks. After the wax solidified, the wax block was removed from the embedding frame and repaired. Next, we sliced the finished wax block on a paraffin slicer with a thickness of 4 μm. The slices were floated in 40 °C warm water of the spreading machine to flatten the tissues. The tissues were picked up with slides and baked in the oven at 60 °C. Waiting for the water to dry and the wax to melt, then take them out and store them at room temperature. T47D breast cancer cells were purchased from the Type Culture Collection of the Chinese Academy of Sciences and cultured in Dulbecco’s modified Eagle’s minimal essential medium with 10% heat-inactivated fetal bovine serum and 1% penicillin/streptomycin at 37 °C in a humid atmosphere with 5% CO 2 . The cells at the logarithmic growth stage were fixed in paraformaldehyde for 30 min, washed with phosphate buffer saline, and dried naturally.
Statistics and reproducibility
Experiment tissues, cells and imaging region of interests were randomly chosen without prior bias, and data analysis was performed using the same method. All imaging results were repeated with more than 4 times and could be repeated each time. To show the imaging performance, representative imaging results were included in the manuscript. Reporting summary Further information on research design is available in the Nature Portfolio Reporting Summary linked to this article.
Experimental setup
A red LED light source (GCI-060401, λ = 620 ± 10 nm, Daheng Optics Co. Ltd., China) is collimated by a collimating lens (AC127-030-A, Thorlabs, USA) to generate the monochromatic plane wave. The parallel light passes through polarizer 1 (LPVISC100-MP2, Thorlabs, USA) to produce monochromatic polarized light with a polarization direction of 45° to illuminate samples. Metasurface is used to image the sample, and the object distance a and image distance b should satisfy the Gaussian formula 1 /a + 1 /b = 1 /f . The objective lens (95MM M Plan Apo HL 50× NA 0.42 Donglilai Optics Electronics Enterprise Co., LTD.) and tube lens (Zoom Lens Series 10, Donglilai Optics&Electronics Enterprise Co. LTD, China) form a secondary imaging system to visualize the images produced by metasurface. Polarizer 2 (LPVISC100-MP2, Thorlabs, USA) is placed along the −45° and the DIC image is captured by a CMOS camera (DCU224C, Thorlabs, USA) via Thorcam 3.7.0 software, and the images is processed by ImageJ v1.53 g.
Supplementary information Supplementary Information Description of Additional Supplementary Files Supplementary Movie 1 Supplementary Movie 2 Reporting Summary
📊 Figures
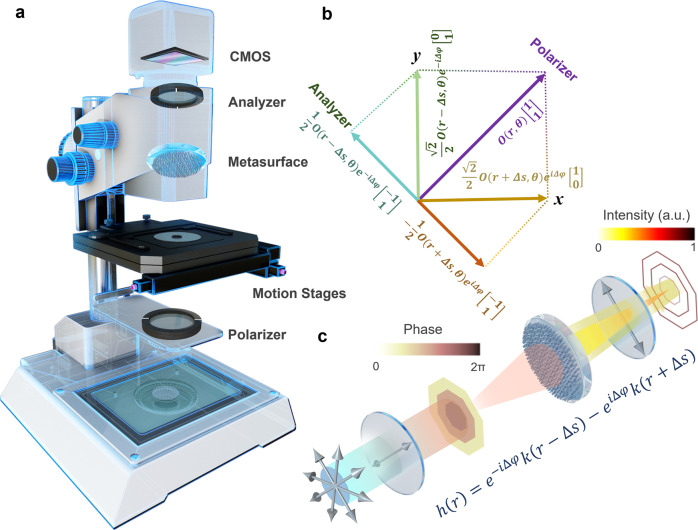
Fig. 1
Principle of metasurface-assisted i-DIC microscopy.
a The schematic of the proposed i-DIC microscopy. CMOS, complementary metal oxide semiconductor. b the polarization conversion and optical field changes in the polarization coordinate system of i-DIC ...
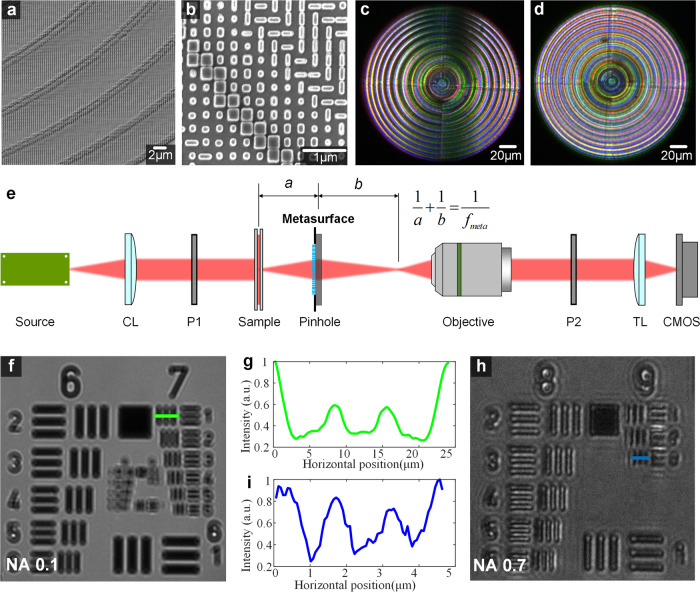
Fig. 2
Characterization and performance tests of the metasurfaces.
a , b SEM image of the fabricated metasurface. Images of a-DIC ( c ) microscopy and i-DIC ( d ) microscopy under white-light illumination in transmission mode. e The schematic configuration of the met...
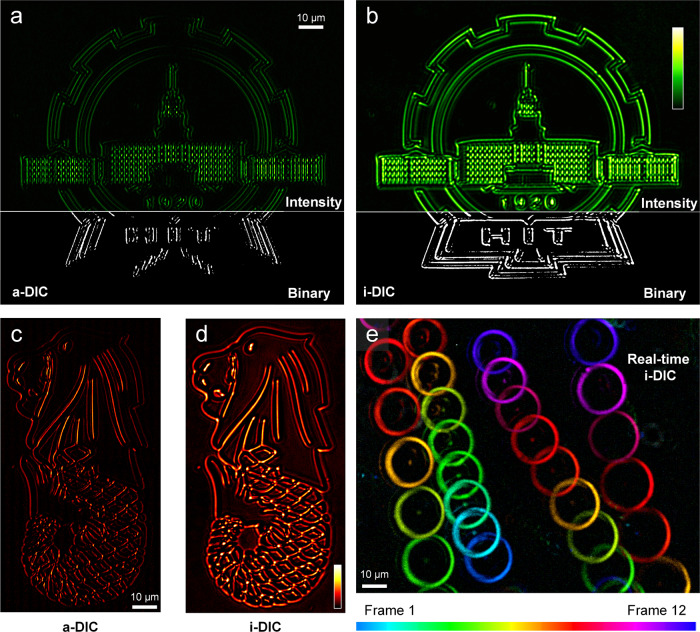
Fig. 3
Imaging results with a-DIC and i-DIC microscopy.
The high-resolution icon imaging results in a-DIC microscopy ( a , c ), i-DIC microscopy ( b , d ) with NAu2009=u20090.7, u03bbu2009=u2009620u2009nm. e The motion tracking of SiO 2 microspheres.
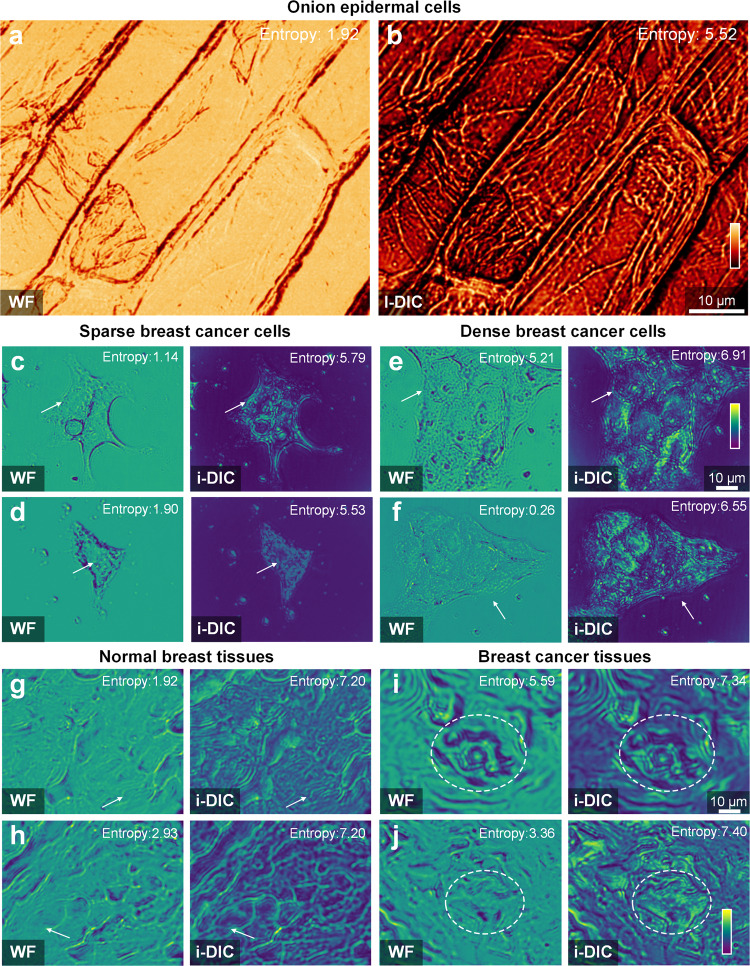
Fig. 4
Cells and tissues imaging with i-DIC microscopy.
WF widefield. The imaging results of onion epidermal cells in widefield ( a ) and i-DIC ( b ) microscopies. c , d Sparse breast cancer cells in widefield (left) and i-DIC (right) microscopies. e , f D...
Figure images are served from the NIH/NLM PubMed Central Open Access Subset or Europe PMC; copyright remains with the publishers and authors.
💬 Discussion
0 commentsNo comments yet. Be the first to start a discussion!
Leave a Comment