Abstract
To improve well-known titanium implants, pores can be used for increasing bone formation and close bone-implant interface. Selective Laser Melting (SLM) enables the production of any geometry and was used for implant production with 250-µm pore size. The used pore size supports vessel ingrowth, as bone formation is strongly dependent on fast vascularization. Additionally, proangiogenic factors promote implant vascularization. To functionalize the titanium with proangiogenic factors, polycaprolactone (PCL) coating can be used. The following proangiogenic factors were examined: vascular endothelial growth factor (VEGF), high mobility group box 1 (HMGB1) and chemokine (C-X-C motif) ligand 12 (CXCL12). As different surfaces lead to different cell reactions, titanium and PCL coating were compared. The growing into the porous titanium structure of primary osteoblasts was examined by cross sections. Primary osteoblasts seeded on the different surfaces were compared using Live Cell Imaging (LCI). Cross sections showed cells had proliferated, but not migrated after seven days. Although the cell count was lower on titanium PCL implants in LCI, the cell count and cell spreading area development showed promising results for titanium PCL implants. HMGB1 showed the highest migration capacity for stimulating the endothelial cell line. Future perspective would be the incorporation of HMGB1 into PCL polymer for the realization of a slow factor release.
🔬 Techniques
🔭 Microscopes
💻 Software
✨ Fluorophores
🧪 Sample Preparation
🔬 Cell Lines
🏭 Microscope Brands
🧪 Reagent Suppliers
💻 Software Details
🏛️ Research Organizations (ROR)
Affiliated research institutions:
📋 Methods
4.1. Manufacturing Titanium Implant For the titanium implant a TiAl6V4 titanium alloy was used. The implants were manufactured by SLM Solutions GmbH, Lübeck, Germany, with an SLM 280HL Selective Laser Melting system. Therefore a standard parameter set was taken using a laser power of 275 W, a scan speed of 805 W and a hatch distance of 120 µm for the core volume. The outer contour was produced using a laser power of 100 W and a scan speed of 350 mm/s. 4.2. Dip-Coating Process for Application of Polymeric Coatings to Porous Titanium Scaffolds For implant coating a manual dip-coating process was established. First titanium implants were washed in isopropanol. For each implant, 2 mL of polymer solution was filled in the dipping tanks. Concentration was 0.4% of PCL. After each dipping process intermediate drying for 10 min at 23 ± 2 °C was performed. This was repeated six times. Finally the titanium PCL implants were dried in a vacuum at 40 °C for 24 h. 4.3.
Scanning Electron Microscopy and EDX Measurements
To examine complete surface covering of the polymer coating, environmental scanning electron microscopy (Quanta FEG 250, FEI, Eindhoven, The Netherlands) equipped with an energy-dispersive X-ray (EDX) analysis unit was used. After fixing the titanium PCL implants and the titanium implants, the scanning electron micrographs were performed at 50 Pa pressure, moisturized atmosphere and an accelerating voltage of 10 kV. EDX measurements were performed at the beam entrance of the electron microscope. Titanium and carbon were determined by analyzing the spectra of the fibers bombarded with electrons. 4.4. Cell Culture 4.4.1. Greenfluorescent Protein (GFP)–Osteoblast Isolation Cell isolation was performed using adult GFP*C57Bl6 mice as previously described [ 45 ]. After mincing the bone of the calvarias into small pieces, 200 U/mL collagenase II (Cell Systems, Troisdorf, Germany) in Hank’s medium (HBSS, PAA Laboratories GmbH, Pasching, Austria) was used. Five milliliters collagenase solution was used for calvarias of ten mice. Digestion took place five times for 10 min at 37 °C. The supernatant of the final three steps was centrifuged (1200 rpm, 7 min). After washing the pellet twice with culture medium, cells were placed in culture plates and incubated at 37 °C. The medium used was DMEM (Biochrom AG, Berlin, Germany) with the addition of 10% fetal calf serum (FCS), 20 mM Hepes, 1000 IU/mL penicillin and 0.1 mg/mL streptomycin (all PAA, Coelbe, Germany). After cells had been isolated they were incubated at 37 °C with 8.5% CO 2 . Media changing was done every 3rd day until cells were confluent. For cell experiments cells were cultured in DMEM with 10% FCS and incubated at 37 °C with 5% CO 2 . 4.4.2. GM7373 The endothelial cell line GM7373 was harvested from the aorta of a bovine calf. For cell culture, we used DMEM and 10% FCS. GM7373 was provided by Leibniz University, Institution of Biophysics, Hannover, Germany. 4.5. Cross Sections Established of Titanium Implants Nine titanium scaffolds were seeded with 2.5 × 10 4 GFP–osteoblasts (P 10). After one, three and seven days, three cell-seeded scaffolds each were fixed in 4% formalin. The samples were rinsed with tap water and dehydrated using an ethanol gradient (4 h in 70%, 80%, 90% and 100% ethanol). Afterwards, samples were defatted in acetone for 4 h, equilibrated with 100% ethanol for 6 h and embedded in methyl metacrylate for 2 days at 37 °C. Thirty-micrometer sections were cut with an internal hole saw (SP 1600, Leica, Wetzlar, Germany) and examined by fluorescence microscopy (DM4000B Leica microsystems, Wetzlar, Germany). Cell distance, cell amount, and difference in cell counting between upper and lower pores were examined by Wimasis Image Analysis (16–19 cross sections for each time point). The scale bar started at the scaffolds’ surface where cells had been settled and upper and lower pore were examined. Cells were counted as cell area, because after embedding the cells were unable to be counted separately. Only cells that had direct contact to the pores surface were counted. Cells that were not attached to the surface were ignored because they could be artifacts of the cutting process. 4.6. Migration Assays of GM7373 on HMGB1, VEGF, CXCL12 Twelve-well transwells (353182, BD Falcon, Erembodegem, Belgium) with 8 µm pore-size were used for the experiment. Seventy thousand GM7373 of passages 20 and 21 were added to a 37 °C pre-warmed 0.1% DMEM and incubated for 20 min. The following factors were added in duplicate: VEGF (450-32, Peprotech, Hamburg, Germany) (5/10/20 ng/mL), HMGB1 (H4652, Sigma–Aldrich, Taufkirchen, Germany) (50/100/150 ng/mL), CXCL12 (250-20A, Peprotech) (50/100/150 ng/mL), and VEGF combined with HMGB1 and HMGB1 plus CXCL12 using half of the mentioned dose. After that in duplicate two assays were performed using HMGB1 (50/100/150 ng/mL) plus CXCL12 (10/20/30 ng/mL) and HMGB1 (10/20/30 ng/mL) plus CXCL12 (50/100/150 ng/mL). Migration time was 4 h under cell culture conditions (37 °C, 5% CO 2 ). Cells that did not migrate were removed with a cotton stick. Migrated cells in the lower chamber were trypsinated and counted with a cell counter (CellometerTM Auto 4, Nexcelom Bioscience, Lawrence, MA, USA). 4.7.
Show full methods section
4.1. Manufacturing Titanium Implant For the titanium implant a TiAl6V4 titanium alloy was used. The implants were manufactured by SLM Solutions GmbH, Lübeck, Germany, with an SLM 280HL Selective Laser Melting system. Therefore a standard parameter set was taken using a laser power of 275 W, a scan speed of 805 W and a hatch distance of 120 µm for the core volume. The outer contour was produced using a laser power of 100 W and a scan speed of 350 mm/s. 4.2. Dip-Coating Process for Application of Polymeric Coatings to Porous Titanium Scaffolds For implant coating a manual dip-coating process was established. First titanium implants were washed in isopropanol. For each implant, 2 mL of polymer solution was filled in the dipping tanks. Concentration was 0.4% of PCL. After each dipping process intermediate drying for 10 min at 23 ± 2 °C was performed. This was repeated six times. Finally the titanium PCL implants were dried in a vacuum at 40 °C for 24 h. 4.3.
Scanning Electron Microscopy and EDX Measurements
To examine complete surface covering of the polymer coating, environmental scanning electron microscopy (Quanta FEG 250, FEI, Eindhoven, The Netherlands) equipped with an energy-dispersive X-ray (EDX) analysis unit was used. After fixing the titanium PCL implants and the titanium implants, the scanning electron micrographs were performed at 50 Pa pressure, moisturized atmosphere and an accelerating voltage of 10 kV. EDX measurements were performed at the beam entrance of the electron microscope. Titanium and carbon were determined by analyzing the spectra of the fibers bombarded with electrons. 4.4. Cell Culture 4.4.1. Greenfluorescent Protein (GFP)–Osteoblast Isolation Cell isolation was performed using adult GFP*C57Bl6 mice as previously described [ 45 ]. After mincing the bone of the calvarias into small pieces, 200 U/mL collagenase II (Cell Systems, Troisdorf, Germany) in Hank’s medium (HBSS, PAA Laboratories GmbH, Pasching, Austria) was used. Five milliliters collagenase solution was used for calvarias of ten mice. Digestion took place five times for 10 min at 37 °C. The supernatant of the final three steps was centrifuged (1200 rpm, 7 min). After washing the pellet twice with culture medium, cells were placed in culture plates and incubated at 37 °C. The medium used was DMEM (Biochrom AG, Berlin, Germany) with the addition of 10% fetal calf serum (FCS), 20 mM Hepes, 1000 IU/mL penicillin and 0.1 mg/mL streptomycin (all PAA, Coelbe, Germany). After cells had been isolated they were incubated at 37 °C with 8.5% CO 2 . Media changing was done every 3rd day until cells were confluent. For cell experiments cells were cultured in DMEM with 10% FCS and incubated at 37 °C with 5% CO 2 . 4.4.2. GM7373 The endothelial cell line GM7373 was harvested from the aorta of a bovine calf. For cell culture, we used DMEM and 10% FCS. GM7373 was provided by Leibniz University, Institution of Biophysics, Hannover, Germany. 4.5. Cross Sections Established of Titanium Implants Nine titanium scaffolds were seeded with 2.5 × 10 4 GFP–osteoblasts (P 10). After one, three and seven days, three cell-seeded scaffolds each were fixed in 4% formalin. The samples were rinsed with tap water and dehydrated using an ethanol gradient (4 h in 70%, 80%, 90% and 100% ethanol). Afterwards, samples were defatted in acetone for 4 h, equilibrated with 100% ethanol for 6 h and embedded in methyl metacrylate for 2 days at 37 °C. Thirty-micrometer sections were cut with an internal hole saw (SP 1600, Leica, Wetzlar, Germany) and examined by fluorescence microscopy (DM4000B Leica microsystems, Wetzlar, Germany). Cell distance, cell amount, and difference in cell counting between upper and lower pores were examined by Wimasis Image Analysis (16–19 cross sections for each time point). The scale bar started at the scaffolds’ surface where cells had been settled and upper and lower pore were examined. Cells were counted as cell area, because after embedding the cells were unable to be counted separately. Only cells that had direct contact to the pores surface were counted. Cells that were not attached to the surface were ignored because they could be artifacts of the cutting process. 4.6. Migration Assays of GM7373 on HMGB1, VEGF, CXCL12 Twelve-well transwells (353182, BD Falcon, Erembodegem, Belgium) with 8 µm pore-size were used for the experiment. Seventy thousand GM7373 of passages 20 and 21 were added to a 37 °C pre-warmed 0.1% DMEM and incubated for 20 min. The following factors were added in duplicate: VEGF (450-32, Peprotech, Hamburg, Germany) (5/10/20 ng/mL), HMGB1 (H4652, Sigma–Aldrich, Taufkirchen, Germany) (50/100/150 ng/mL), CXCL12 (250-20A, Peprotech) (50/100/150 ng/mL), and VEGF combined with HMGB1 and HMGB1 plus CXCL12 using half of the mentioned dose. After that in duplicate two assays were performed using HMGB1 (50/100/150 ng/mL) plus CXCL12 (10/20/30 ng/mL) and HMGB1 (10/20/30 ng/mL) plus CXCL12 (50/100/150 ng/mL). Migration time was 4 h under cell culture conditions (37 °C, 5% CO 2 ). Cells that did not migrate were removed with a cotton stick. Migrated cells in the lower chamber were trypsinated and counted with a cell counter (CellometerTM Auto 4, Nexcelom Bioscience, Lawrence, MA, USA). 4.7.
Live Cell Imaging
LCI was performed with titanium implants and titanium PCL implants seeded with GFP–osteoblasts (LAS AF 2.6.0, Leica–Microsystems, Wetzlar, Germany). Four titanium implants and three titanium PCL implants were placed in a 96 well plate filled with 150 µL DMEM and 10% FCS. GFP–osteoblasts (P 10) were added gently to the top of the scaffolds at a concentration of 2.5 × 10 4 cells/150 μL medium. After a minimum 5 h incubation period at 37 °C, 5% CO 2 , the implants were turned upside down to visualize the cells in the inverse microscope. Subsequently, they were placed in new wells that were prepared with purpose-built Teflon constructs used for lifting the implants to create a gap between cells growing on the implants and the bottom of the culture plates for inverse microscopy. Then proliferation and motility of the cells could be observed by LCI Microscope (DMI 6000B Leica Microsystems, Wetzlar, Germany) during seven days with the program LAS AF 2.6.0. The same implant region was examined for seven days by taking pictures every 15 min. A constant temperature of 37 °C was kept and a 5% CO 2 was ensured by using a heating unit and CO 2 supplier. Cells of the same concentration without scaffolds were used for positive control. Cell count and cell spreading area were examined by Wimasis Image Analysis GmbH, Germany. The cell spreading area of osteoblasts was described by using the following equation: total cell area/total cell number. 4.8.
Statistical Analysis
Statistical analyses were performed with SAS ® software, Version 9.3 (SAS Institute Inc., Cary, NC, USA). The significance level for all tests was set to p < 0.05. The data were shown as mean ± standard deviation.
📊 Figures
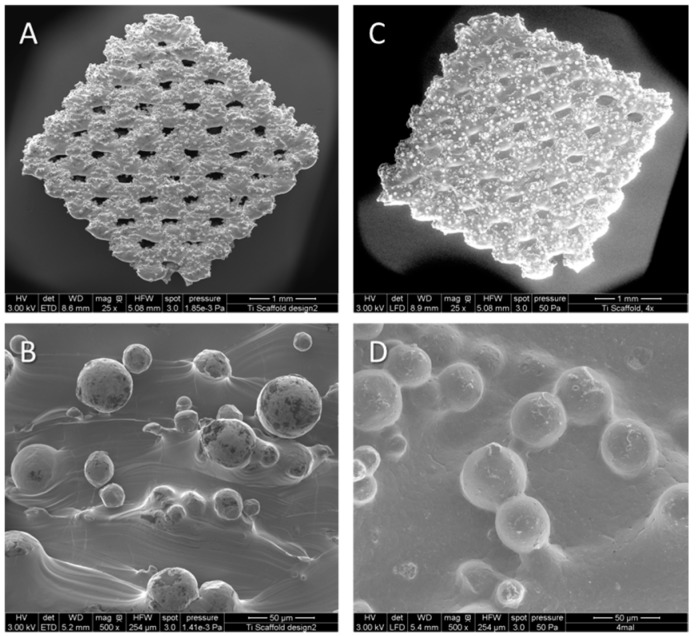
Figure 1
Representative Environmental Scanning Electron Microscopy (ESEM) micrographs of non-coated ( A , B ) and polycaprolactone (PCL)-coated ( C , D ) porous titanium scaffolds in overview and detail.
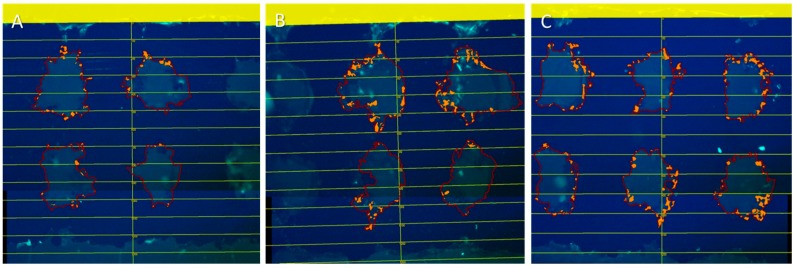
Figure 2
Cross section of titanium implant with green fluorescent protein (GFP)u2013osteoblasts settled for ( A ) one day; ( B ) three days; and ( C ) seven days. Cells were placed on the top of the implant (m...
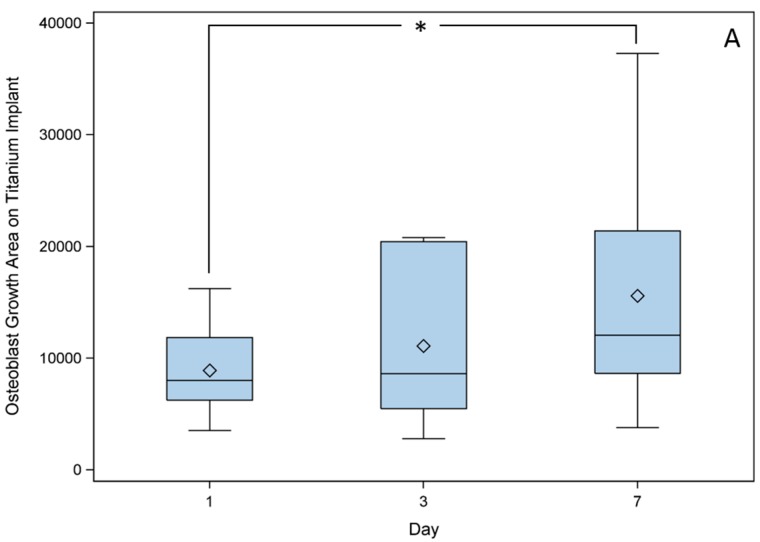
Figure 3
Cross sections were analyzed for changes in ( A ) total area of cell growth (u00b5m 2 ) and ( B ) growth distance (u00b5m) of osteoblasts from topu2013bottom pores at different time points (day 1, day...
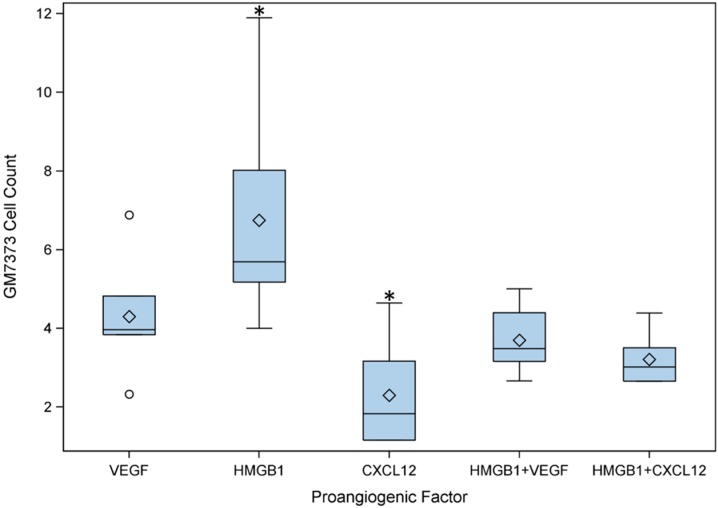
Figure 4
Comparison of chemotactic behavior of the endothelial cell line (GM7373) using vascular endothelial growth factor (VEGF), high mobility group box 1 (HMGB1), chemokine (C-X-C motif) ligand 12 (CXCL12) ...
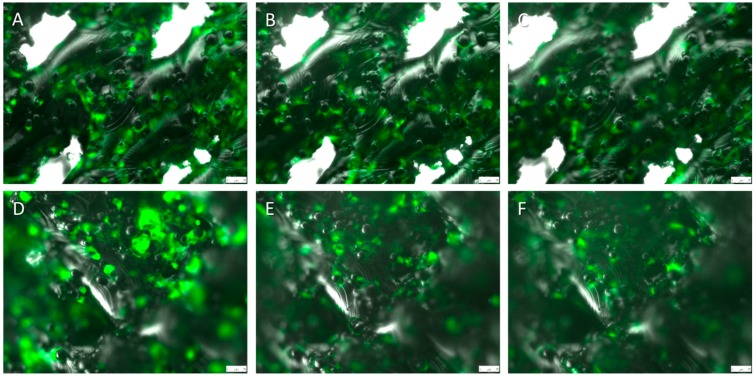
Figure 5
Titanium implant (90 degree angle and visible pore structure) after ( A ) 0 days; ( B ) three days; and ( C ) seven days and titanium PCL implant (45 degree angle and invisible pore structure) after (...
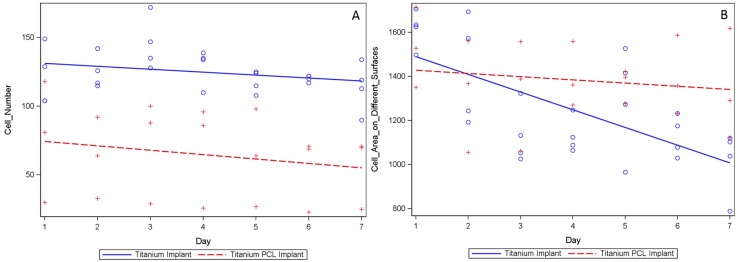
Figure 6
Evaluation of average GFPu2013osteoblast cell number changes ( A ) and cell spreading area (u00b5m 2 /cell) changes ( B ) during seven days settled on titanium (the solid line represents the cell deve...
Figure images are served from the NIH/NLM PubMed Central Open Access Subset or Europe PMC; copyright remains with the publishers and authors.
💬 Discussion
0 commentsNo comments yet. Be the first to start a discussion!
Leave a Comment