Abstract
Viruses causing chronic infection artfully manipulate infected cells to enable viral persistence in vivo under the pressure of immunity. Human T-cell leukemia virus type 1 (HTLV-1) establishes persistent infection mainly in CD4+ T cells in vivo and induces leukemia in this subset. HTLV-1-encoded Tax is a critical transactivator of viral replication and a potent oncoprotein, but its significance in pathogenesis remains obscure due to its very low level of expression in vivo. Here, we show that Tax is expressed in a minor fraction of leukemic cells at any given time, and importantly, its expression spontaneously switches between on and off states. Live cell imaging revealed that the average duration of one episode of Tax expression is ∼19 hours. Knockdown of Tax rapidly induced apoptosis in most cells, indicating that Tax is critical for maintaining the population, even if its short-term expression is limited to a small subpopulation. Single-cell analysis and computational simulation suggest that transient Tax expression triggers antiapoptotic machinery, and this effect continues even after Tax expression is diminished; this activation of the antiapoptotic machinery is the critical event for maintaining the population. In addition, Tax is induced by various cytotoxic stresses and also promotes HTLV-1 replication. Thus, it seems that Tax protects infected cells from apoptosis and increases the chance of viral transmission at a critical moment. Keeping the expression of Tax minimal but inducible on demand is, therefore, a fundamental strategy of HTLV-1 to promote persistent infection and leukemogenesis.
🔬 Techniques
💻 Software
✨ Fluorophores
🧪 Sample Preparation
🔬 Cell Lines
🏭 Microscope Brands
🧪 Reagent Suppliers
💻 Software Details
🏛️ Research Organizations (ROR)
Affiliated research institutions:
📋 Methods
Cells. An IL-2–independent ATL cell line MT-1 ( 62 ), two IL-2–dependent ATL cell lines KK-1 and SO-4 ( 63 ), and an HTLV-1–negative T-cell line Jurkat were used in this study. MT-1 and Jurkat cells were maintained in RPMI supplemented with 10% (vol/vol) FBS. The MT1GFP cell line was maintained as MT-1 cells were, with the addition of 500 μg/mL G418 (Nacalai). KK-1 and SO-4 cell lines were maintained in RPMI supplemented with 10% FBS and IL-2 (100 U/mL; PeproTech). Clinical Samples. Fresh ATL cells were obtained from 20 aggressive-type ATL cases and used for extraction of genomic DNA and total RNA. Use of the clinical samples in this research was approved by the Ethics Committee of Kyoto University (approval no. G204). Written consent was obtained from the patients. Using genomic DNAs from primary ATL cells and ATL cell lines, DNA methylation level of 5′ LTR was analyzed by the Combined Bisulfite Restriction Analysis method as previously described ( 36 ). Expression level of tax in fresh ATL cells was analyzed by a conventional qRT-PCR ( 16 ). GFP Competition Assay. The GFP competition assay ( 64 ) was carried out to observe the long-term effect of Tax-KD on MT-1 or Jurkat cells transduced with pLKO-GFP lentivirus expressing shNC, shTax1, or shTax4. Cells were infected with concentrated lentivirus at a multiplicity of infection (MOI) of 0.5 to adjust the ratio of transduced cells to around 50%. The effect of shRNAs on target cells was evaluated by measuring the percentage of GFP+ cells using a FACSverse flow cytometer (BD Biosciences). Single-Cell qPCR. The C1 Single-Cell Auto Prep Array for PreAmp (Fluidigm) was used for harvest of RNA, cDNA synthesis, and preamplification of cDNA (18 cycles of PCR for the target genes) from single cells according to the manufacturer’s instructions. After loading cells onto an integrated fluidic circuit, we checked all 96 chambers by microscope to verify capture of a single cell. Thereafter, preamplified cDNA was harvested and subjected to qPCR. The Biomark HD system (Fluidigm) combined with EvaGreen chemistry (Bio-Rad) was used for the qPCR assay. To increase specificity, we used nested primers (one pair for the preamplification step and another pair for the subsequent qPCR of 30 cycles). The sequences of the primers used in this study are indicated in Table S3 . Raw data were processed by Fluidigm Real-Time PCR analysis software, and the melting curve was used to determine the pass/failure call of qPCR. Data were analyzed with the R program using the Singular Analysis Toolset package (Fluidigm). Any chamber that contained more than one cell was excluded from analysis; outlier cells that had low global expression were also excluded. The level of detection value was set to 24 cycles according to the manufacturer’s recommendation. Time-Lapse Imaging. For live cell imaging, 8 × 10 4 MT1GFP cells were seeded in a 5-mm glass-bottom dish (Matsunami) precoated with poly- d -lysine (Sigma) and incubated at 37 °C in 5% CO 2 . Images in the differential interference contrast (DIC) and GFP channels were captured with an LCV110 microscope (Olympus) every 20 min for 96 h. Semiautomated cell tracking was done by Fiji software with the Trackmate plugin ( 65 ). Cells, which had already expressed d2EGFP at the beginning of the observation, were excluded from analysis, because the starting point for expression was unknown. To analyze single-cell dynamics of d2EGFP expression, normalized fluorescence intensities are plotted against time. The starting time ( t = 0) is the time at which the cell started expressing d2EGFP above background level. RNA-Seq. MT1GFP or KK1GFP cells were sorted into d2EGFP+ and d2EGFP− populations with a FACSAria III (BD Biosciences), and RNA was then extracted using the RNeasy mini kit (Qiagen). Single-end RNA sequencing was performed (BGI). A quality check was done with FastQC, and then, Tuxedo pipeline was used for RNA quantification ( 66 ). Upstream regulator analysis was carried out by Ingenuity Pathway Analysis (Qiagen). Cell Cycle Analysis. To measure the cell cycle dynamics of MT1GFP cells without cell synchronization, a method combining EdU incorporation and DAPI staining was carried out as previously described ( 25 ) using the Click-iT Plus EdU Alexa Fluor 647 kit (Thermo Fisher). Initially, 1 × 10 7 cells were cultured in complete RPMI medium containing 10 µM EdU for 2 h and washed thereafter. At that point (time = 2 h), one-half of the cells were fixed and stained for EdU and DAPI according to the manufacturer’s protocol. The other one-half of the cells were recultured again for 4 h without adding EdU. At the end of the assay (time = 6 h), those cells were washed, fixed, and stained. Cell cycle status in the d2EGFP+ or d2EGFP− population was analyzed using a FACSVerse based on the levels of EdU and DAPI. Statistical Analysis. Statistical analysis was done using Microsoft Excel, GraphPad Prism, R, or Python. Data obtained by flow cytometry were analyzed with FlowJo. Two-sided t test was used to compare between two different groups. Computational Simulations. A simple deterministic two-state model of Tax-positive feedback was developed (the chemical reaction scheme is shown in Fig. S3 A ) ( 19 ) and simulated by the Gillespie algorithm ( 67 ) to investigate the stochastic dynamics of Tax expression, especially to estimate the length of Tax expression ( t period ) and the interval between Tax expression episodes ( t interval ). In addition, an ABM of cell population dynamics (birth–death Poisson process) with stage transitions as described in Fig. 5 A was constructed based on the individual-based Gillespie algorithm ( 67 ) to confirm the experiment-based hypothesis that the transient expression of Tax is a critical event for the persistence of the MT-1 cell population. Additional details are in SI Materials and Methods .
Show full methods section
Cells. An IL-2–independent ATL cell line MT-1 ( 62 ), two IL-2–dependent ATL cell lines KK-1 and SO-4 ( 63 ), and an HTLV-1–negative T-cell line Jurkat were used in this study. MT-1 and Jurkat cells were maintained in RPMI supplemented with 10% (vol/vol) FBS. The MT1GFP cell line was maintained as MT-1 cells were, with the addition of 500 μg/mL G418 (Nacalai). KK-1 and SO-4 cell lines were maintained in RPMI supplemented with 10% FBS and IL-2 (100 U/mL; PeproTech). Clinical Samples. Fresh ATL cells were obtained from 20 aggressive-type ATL cases and used for extraction of genomic DNA and total RNA. Use of the clinical samples in this research was approved by the Ethics Committee of Kyoto University (approval no. G204). Written consent was obtained from the patients. Using genomic DNAs from primary ATL cells and ATL cell lines, DNA methylation level of 5′ LTR was analyzed by the Combined Bisulfite Restriction Analysis method as previously described ( 36 ). Expression level of tax in fresh ATL cells was analyzed by a conventional qRT-PCR ( 16 ). GFP Competition Assay. The GFP competition assay ( 64 ) was carried out to observe the long-term effect of Tax-KD on MT-1 or Jurkat cells transduced with pLKO-GFP lentivirus expressing shNC, shTax1, or shTax4. Cells were infected with concentrated lentivirus at a multiplicity of infection (MOI) of 0.5 to adjust the ratio of transduced cells to around 50%. The effect of shRNAs on target cells was evaluated by measuring the percentage of GFP+ cells using a FACSverse flow cytometer (BD Biosciences). Single-Cell qPCR. The C1 Single-Cell Auto Prep Array for PreAmp (Fluidigm) was used for harvest of RNA, cDNA synthesis, and preamplification of cDNA (18 cycles of PCR for the target genes) from single cells according to the manufacturer’s instructions. After loading cells onto an integrated fluidic circuit, we checked all 96 chambers by microscope to verify capture of a single cell. Thereafter, preamplified cDNA was harvested and subjected to qPCR. The Biomark HD system (Fluidigm) combined with EvaGreen chemistry (Bio-Rad) was used for the qPCR assay. To increase specificity, we used nested primers (one pair for the preamplification step and another pair for the subsequent qPCR of 30 cycles). The sequences of the primers used in this study are indicated in Table S3 . Raw data were processed by Fluidigm Real-Time PCR analysis software, and the melting curve was used to determine the pass/failure call of qPCR. Data were analyzed with the R program using the Singular Analysis Toolset package (Fluidigm). Any chamber that contained more than one cell was excluded from analysis; outlier cells that had low global expression were also excluded. The level of detection value was set to 24 cycles according to the manufacturer’s recommendation. Time-Lapse Imaging. For live cell imaging, 8 × 10 4 MT1GFP cells were seeded in a 5-mm glass-bottom dish (Matsunami) precoated with poly- d -lysine (Sigma) and incubated at 37 °C in 5% CO 2 . Images in the differential interference contrast (DIC) and GFP channels were captured with an LCV110 microscope (Olympus) every 20 min for 96 h. Semiautomated cell tracking was done by Fiji software with the Trackmate plugin ( 65 ). Cells, which had already expressed d2EGFP at the beginning of the observation, were excluded from analysis, because the starting point for expression was unknown. To analyze single-cell dynamics of d2EGFP expression, normalized fluorescence intensities are plotted against time. The starting time ( t = 0) is the time at which the cell started expressing d2EGFP above background level. RNA-Seq. MT1GFP or KK1GFP cells were sorted into d2EGFP+ and d2EGFP− populations with a FACSAria III (BD Biosciences), and RNA was then extracted using the RNeasy mini kit (Qiagen). Single-end RNA sequencing was performed (BGI). A quality check was done with FastQC, and then, Tuxedo pipeline was used for RNA quantification ( 66 ). Upstream regulator analysis was carried out by Ingenuity Pathway Analysis (Qiagen). Cell Cycle Analysis. To measure the cell cycle dynamics of MT1GFP cells without cell synchronization, a method combining EdU incorporation and DAPI staining was carried out as previously described ( 25 ) using the Click-iT Plus EdU Alexa Fluor 647 kit (Thermo Fisher). Initially, 1 × 10 7 cells were cultured in complete RPMI medium containing 10 µM EdU for 2 h and washed thereafter. At that point (time = 2 h), one-half of the cells were fixed and stained for EdU and DAPI according to the manufacturer’s protocol. The other one-half of the cells were recultured again for 4 h without adding EdU. At the end of the assay (time = 6 h), those cells were washed, fixed, and stained. Cell cycle status in the d2EGFP+ or d2EGFP− population was analyzed using a FACSVerse based on the levels of EdU and DAPI. Statistical Analysis. Statistical analysis was done using Microsoft Excel, GraphPad Prism, R, or Python. Data obtained by flow cytometry were analyzed with FlowJo. Two-sided t test was used to compare between two different groups. Computational Simulations. A simple deterministic two-state model of Tax-positive feedback was developed (the chemical reaction scheme is shown in Fig. S3 A ) ( 19 ) and simulated by the Gillespie algorithm ( 67 ) to investigate the stochastic dynamics of Tax expression, especially to estimate the length of Tax expression ( t period ) and the interval between Tax expression episodes ( t interval ). In addition, an ABM of cell population dynamics (birth–death Poisson process) with stage transitions as described in Fig. 5 A was constructed based on the individual-based Gillespie algorithm ( 67 ) to confirm the experiment-based hypothesis that the transient expression of Tax is a critical event for the persistence of the MT-1 cell population. Additional details are in SI Materials and Methods .
📊 Figures
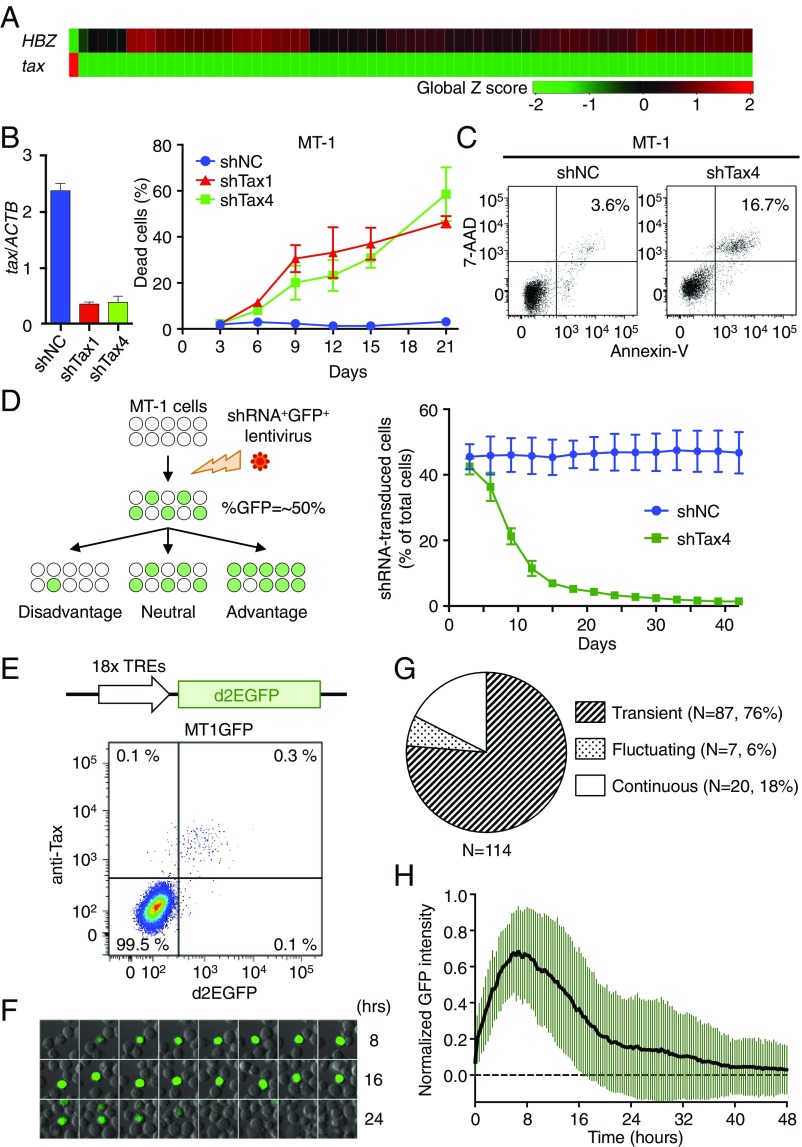
Fig. 1.
Significance and dynamics of Tax expression at a single-cell level in MT-1 cells. ( A ) Single-cell qPCR for tax and HBZ expression in MT-1 cells ( n = 71). ( B , Left ) Efficiency of Tax-KD by shRNA....
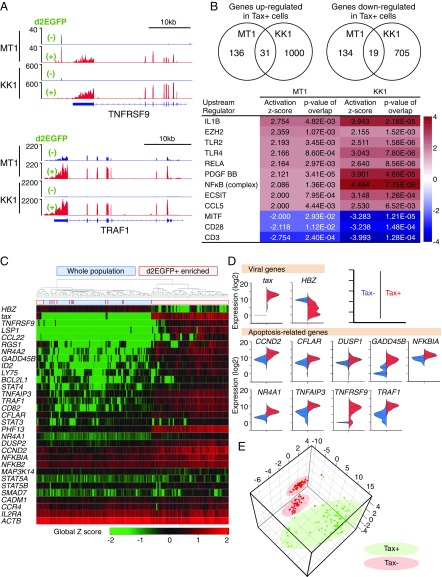
Fig. 2.
Differences in gene expression between Tax-expressing and -nonexpressing MT1GFP cells. ( A ) RNA-Seq analysis comparing Tax+ and Taxu2212 MT1GFP and KK1GFP cells. Read coverage plots for two Tax-assoc...
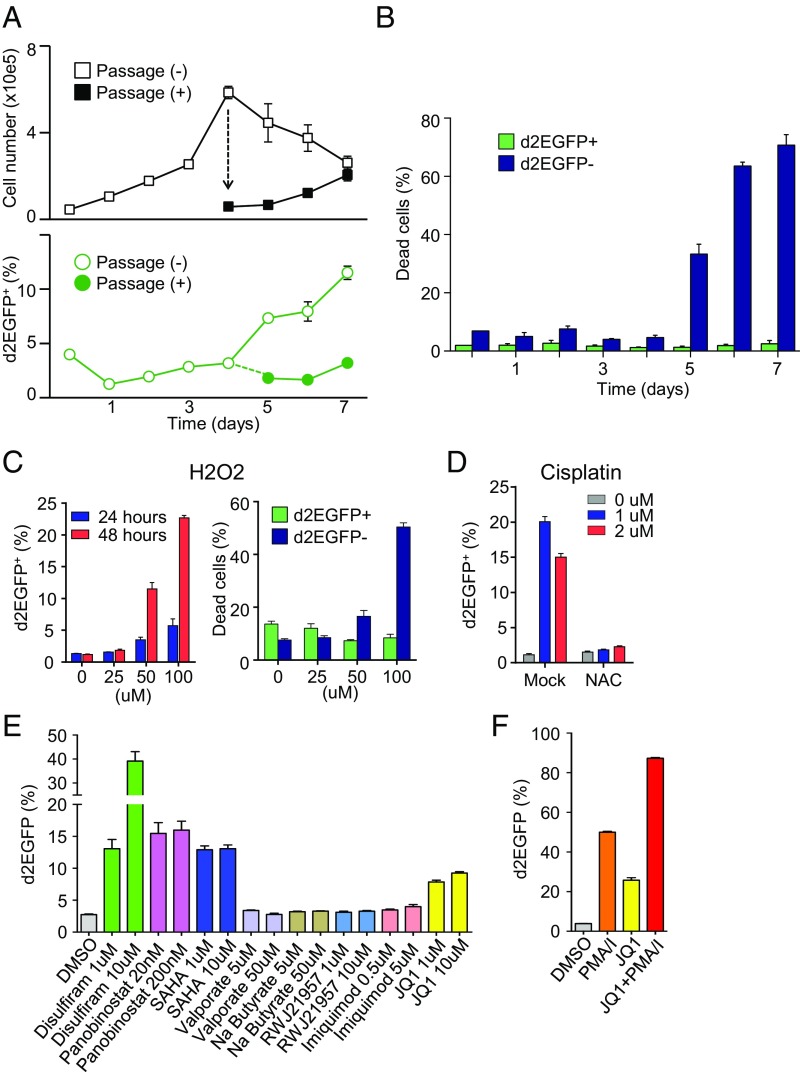
Fig. 3.
Induction of Tax in MT1GFP cells by cytotoxic stresses and HIV-reactivating reagents. ( A ) Effect of cellular overgrowth on Tax expression. On day 4, cells were either passaged or allowed to overgrow...
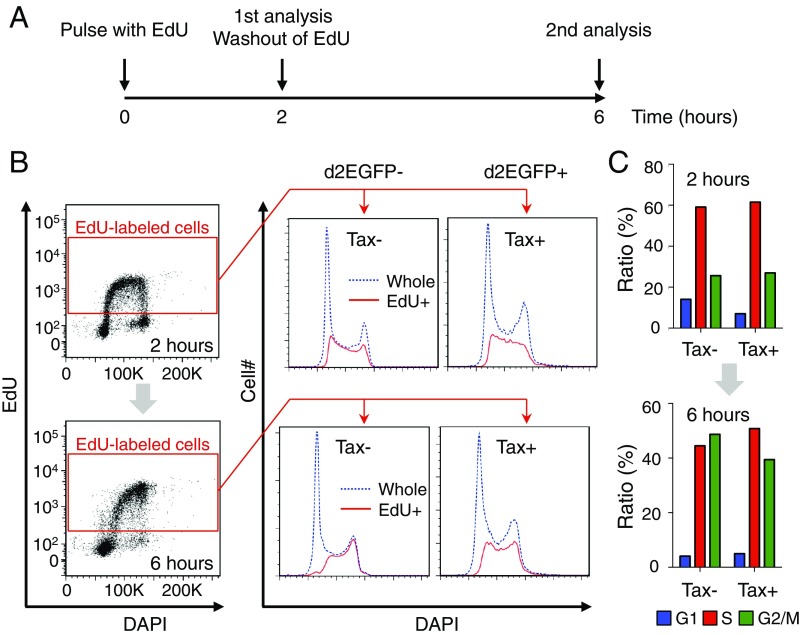
Fig. 4.
Cell cycle transition in d2EGFP+ (Tax+) and d2EGFPu2212 (Taxu2212) cells. ( A ) Scheme for analysis of cell cycle transition without cell synchronization. ( B and C ) Cell cycle phase distributions fo...
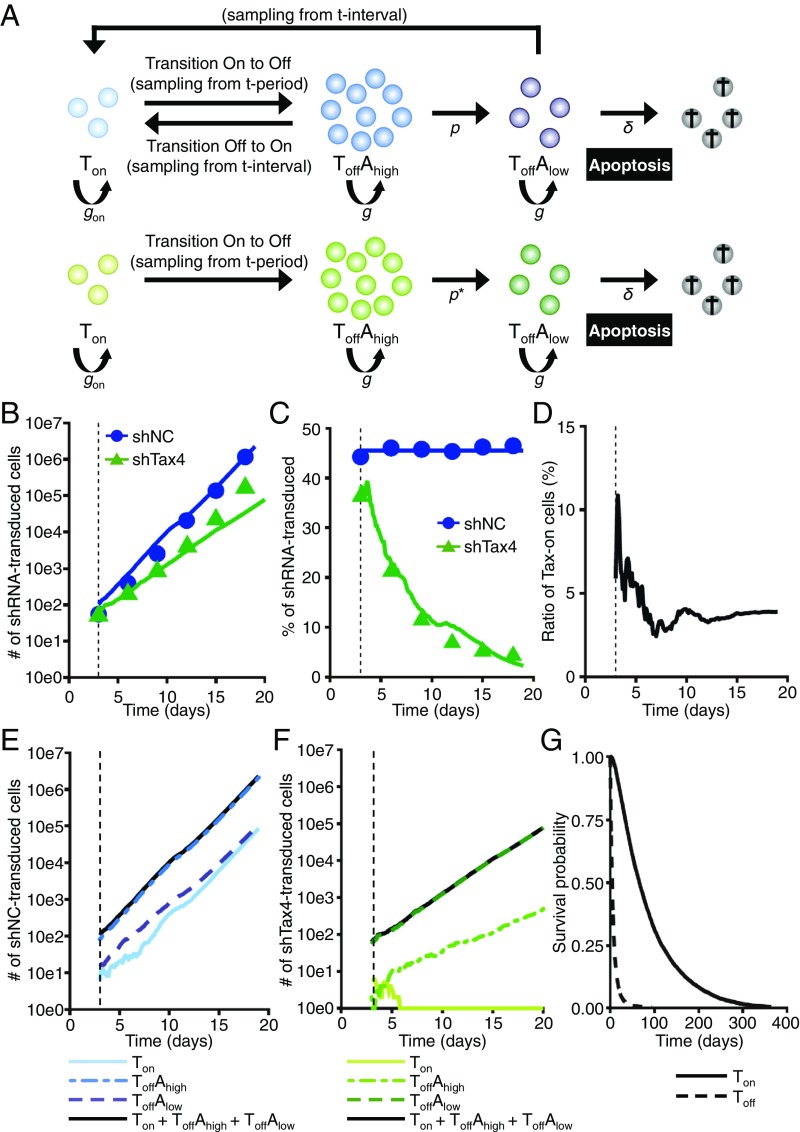
Fig. 5.
Agent-based simulations of cell population dynamics under normal and Tax-KD conditions. ( A ) Scheme for modeling of cell population dynamics as a birthu2013death (Poisson) process with a stage transi...
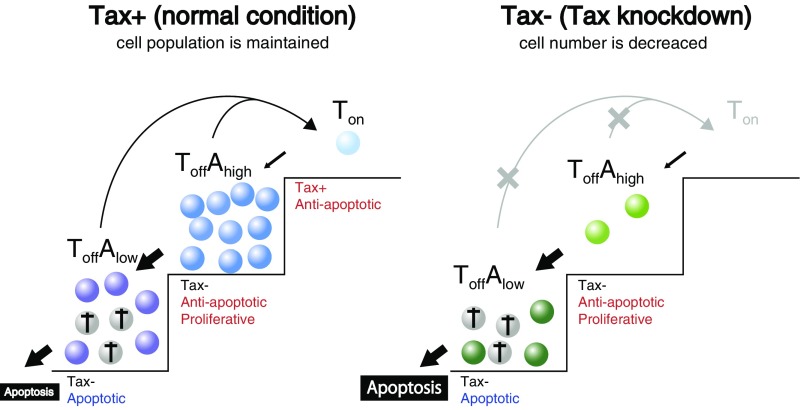
Fig. 6.
Proposed model of the dynamics and significance of Tax expression. ( Left ) Under normal conditions; ( Right ) under Tax-KD conditions.
Figure images are served from the NIH/NLM PubMed Central Open Access Subset or Europe PMC; copyright remains with the publishers and authors.
💬 Discussion
0 commentsNo comments yet. Be the first to start a discussion!
Leave a Comment