Abstract
Despite anticoagulation therapy, up to one-half of patients with deep vein thrombosis (DVT) will develop the post-thrombotic syndrome (PTS). Improving the long-term outcome of DVT patients at risk for PTS will therefore require new approaches. Here we investigate the effects of statins--lipid-lowering agents with anti-thrombotic and anti-inflammatory properties--in decreasing thrombus burden and decreasing vein wall injury, mediators of PTS, in established murine stasis and non-stasis chemical-induced venous thrombosis (N = 282 mice). Treatment of mice with daily atorvastatin or rosuvastatin significantly reduced stasis venous thrombus burden by 25% without affecting lipid levels, blood coagulation parameters, or blood cell counts. Statin-driven reductions in VT burden (thrombus mass for stasis thrombi, intravital microscopy thrombus area for non-stasis thrombi) compared similarly to the therapeutic anticoagulant effects of low molecular weight heparin. Blood from statin-treated mice showed significant reductions in platelet aggregation and clot stability. Statins additionally reduced thrombus plasminogen activator inhibitor-1 (PAI-1), tissue factor, neutrophils, myeloperoxidase, neutrophil extracellular traps (NETs), and macrophages, and these effects were most notable in the earlier timepoints after DVT formation. In addition, statins reduced DVT-induced vein wall scarring by 50% durably up to day 21 in stasis VT, as shown by polarized light microscopy of picrosirius red-stained vein wall collagen. The overall results demonstrate that statins improve VT resolution via profibrinolytic, anticoagulant, antiplatelet, and anti-vein wall scarring effects. Statins may therefore offer a new pharmacotherapeutic approach to improve DVT resolution and to reduce the post-thrombotic syndrome, particularly in subjects who are ineligible for anticoagulation therapy.
🔬 Techniques
💻 Software
✨ Fluorophores
🧪 Sample Preparation
🔬 Cell Lines
🏭 Microscope Brands
🧪 Reagent Suppliers
💻 Software Details
🏛️ Research Organizations (ROR)
Affiliated research institutions:
📋 Methods
Mouse Cohort
Animal studies were approved and performed in accordance with the Subcommittee on Research Animal Care at Massachusetts General Hospital. Venous thrombosis studies were performed in naïve male 14-week-old C57/BL6 mice weighing 27.3 ± 1.1 grams (N = 282). For all surgical procedures, mice were anesthetized with an intraperitoneal injection of ketamine and xylazine (80/12 mg/kg). Surgical procedures utilized a stereozoom microscope. All mice tolerated the surgical procedures well and were kept warm throughout using a recirculating warm-water blanket. Mice were returned to the animal housing facility once ambulant post-procedure. Mice chow and water were provided ad libitum . No qualitative differences in feeding, sleeping, drinking and activity were apparent. Statin Therapy Mice were randomized to treatment groups and started treatment 24 hours after DVT induction and continued until study endpoints ( S1 Fig. ). All dosages were administrated via oral gavage using a straight 22G feeding needle. The atorvastatin (ATV, MGH Pharmacy) treatment group received a daily dose of 0.38 mg/kg (ATV Low) or 1.14 mg/kg (ATV, based on prior therapeutic dose in mice [ 18 ]), dissolved in 0.1 mL of PBS. Rosuvastatin (ROS, MGH Pharmacy) was administered by daily gavage in 0.1mL of PBS at a concentration of 0.28 mg/kg or 0.84 mg/kg (ROS Low and ROS, respectively, at ~25% matched lower doses compared to ATV, due to ROS’ higher potency). The PBS control group received daily oral gavage of 0.1 mL of PBS. Assessment of statin and low molecular weight heparin in VT treatment To compare the magnitude of antithrombotic effect of statins to a conventional anticoagulant, additional mice (N = 32) with stasis IVC VT received subcutaneous low molecular treatment daily (enoxaparin 10 mg/kg SQ) for three days. Control mice received PBS. In addition, evaluation of combination daily statin (atorvastatin 1.14mg/kg or rosuvastatin 0.84 mg/kg) and enoxaparin 10 mg/kg LMWH therapy was examined. To verify the systemic anticoagulant effects of LMWH, factor Xa activity levels were measured in blood samples obtained four hours after the final LMWH injection, and (SensoLyte 520 Factor Xa Assay Kit, AnaSpec Inc.). Stasis-induced venous thrombosis Stasis venous thrombosis was induced following previously published methods [ 19 – 22 ]. Briefly, once anesthetized, male C57/BL6 mice (N = 176) underwent laparotomy, exteriorization of the intestines and exposure of the infrarenal inferior vena cava (IVC). Intestines were kept moist by saline-soaked sterile gauze throughout the procedure. The IVC was then dissected away from the aorta. All visible side branches proximal to the iliac bifurcation were ligated with 7-0 polypropylene sutures. The back branches were left patent. The IVC was then ligated immediately distal to the renal veins with 6-0 polypropylene suture. Exteriorized organs were replaced and the peritoneum was closed using 6-0 polypropylene in a continuous suture, followed by closure of the skin with a 6-0 nylon suture in a simple interrupted pattern. Mice were randomized to various treatment groups 24 hours post-induction of VT. Mice were sacrificed at day 1, 4, 7, 10, 12 or 21 and the abdominal IVC (infrarenal to the iliac bifurcation) was harvested. The thrombus was carefully removed from the IVC, rinsed in PBS, and weighed. At the time of resection, a white-light micrograph of the thrombus was captured using a Nikon D40 camera (Japan) mounted to the dissection scope. Micrographs were calibrated and used to measure thrombus length. Thrombus mass was defined as thrombus weight divided by thrombus length [ 22 – 24 ]. Venous thrombosis was evident in all mice at day 1 and thereafter. Ferric chloride-induced venous thrombosis Ferric chloride (FeCl 3 )-induced VT was induced in the femoral/saphenous vein [ 25 – 27 ] of male C57/BL6 mice (N = 40; 20 per group). The femoral vein was surgically exposed. A small piece of Whatman #1 filter paper was saturated with 7.5% FeCl 3 for 1 minute and then applied to the surface of the vein for 3 minutes. After FeCl 3 treatment, the area was thoroughly rinsed with sterile saline and the incision was closed with a 7-0 nylon suture in a simple interrupted pattern. Venous thrombosis was visible by eye 10 minutes after FeCl 3 application.
Show full methods section
Mouse Cohort
Animal studies were approved and performed in accordance with the Subcommittee on Research Animal Care at Massachusetts General Hospital. Venous thrombosis studies were performed in naïve male 14-week-old C57/BL6 mice weighing 27.3 ± 1.1 grams (N = 282). For all surgical procedures, mice were anesthetized with an intraperitoneal injection of ketamine and xylazine (80/12 mg/kg). Surgical procedures utilized a stereozoom microscope. All mice tolerated the surgical procedures well and were kept warm throughout using a recirculating warm-water blanket. Mice were returned to the animal housing facility once ambulant post-procedure. Mice chow and water were provided ad libitum . No qualitative differences in feeding, sleeping, drinking and activity were apparent. Statin Therapy Mice were randomized to treatment groups and started treatment 24 hours after DVT induction and continued until study endpoints ( S1 Fig. ). All dosages were administrated via oral gavage using a straight 22G feeding needle. The atorvastatin (ATV, MGH Pharmacy) treatment group received a daily dose of 0.38 mg/kg (ATV Low) or 1.14 mg/kg (ATV, based on prior therapeutic dose in mice [ 18 ]), dissolved in 0.1 mL of PBS. Rosuvastatin (ROS, MGH Pharmacy) was administered by daily gavage in 0.1mL of PBS at a concentration of 0.28 mg/kg or 0.84 mg/kg (ROS Low and ROS, respectively, at ~25% matched lower doses compared to ATV, due to ROS’ higher potency). The PBS control group received daily oral gavage of 0.1 mL of PBS. Assessment of statin and low molecular weight heparin in VT treatment To compare the magnitude of antithrombotic effect of statins to a conventional anticoagulant, additional mice (N = 32) with stasis IVC VT received subcutaneous low molecular treatment daily (enoxaparin 10 mg/kg SQ) for three days. Control mice received PBS. In addition, evaluation of combination daily statin (atorvastatin 1.14mg/kg or rosuvastatin 0.84 mg/kg) and enoxaparin 10 mg/kg LMWH therapy was examined. To verify the systemic anticoagulant effects of LMWH, factor Xa activity levels were measured in blood samples obtained four hours after the final LMWH injection, and (SensoLyte 520 Factor Xa Assay Kit, AnaSpec Inc.). Stasis-induced venous thrombosis Stasis venous thrombosis was induced following previously published methods [ 19 – 22 ]. Briefly, once anesthetized, male C57/BL6 mice (N = 176) underwent laparotomy, exteriorization of the intestines and exposure of the infrarenal inferior vena cava (IVC). Intestines were kept moist by saline-soaked sterile gauze throughout the procedure. The IVC was then dissected away from the aorta. All visible side branches proximal to the iliac bifurcation were ligated with 7-0 polypropylene sutures. The back branches were left patent. The IVC was then ligated immediately distal to the renal veins with 6-0 polypropylene suture. Exteriorized organs were replaced and the peritoneum was closed using 6-0 polypropylene in a continuous suture, followed by closure of the skin with a 6-0 nylon suture in a simple interrupted pattern. Mice were randomized to various treatment groups 24 hours post-induction of VT. Mice were sacrificed at day 1, 4, 7, 10, 12 or 21 and the abdominal IVC (infrarenal to the iliac bifurcation) was harvested. The thrombus was carefully removed from the IVC, rinsed in PBS, and weighed. At the time of resection, a white-light micrograph of the thrombus was captured using a Nikon D40 camera (Japan) mounted to the dissection scope. Micrographs were calibrated and used to measure thrombus length. Thrombus mass was defined as thrombus weight divided by thrombus length [ 22 – 24 ]. Venous thrombosis was evident in all mice at day 1 and thereafter. Ferric chloride-induced venous thrombosis Ferric chloride (FeCl 3 )-induced VT was induced in the femoral/saphenous vein [ 25 – 27 ] of male C57/BL6 mice (N = 40; 20 per group). The femoral vein was surgically exposed. A small piece of Whatman #1 filter paper was saturated with 7.5% FeCl 3 for 1 minute and then applied to the surface of the vein for 3 minutes. After FeCl 3 treatment, the area was thoroughly rinsed with sterile saline and the incision was closed with a 7-0 nylon suture in a simple interrupted pattern. Venous thrombosis was visible by eye 10 minutes after FeCl 3 application.
Confocal intravital molecular-structural imaging of DVT resolution
Statin-induced changes in thrombus burden and thrombus inflammation (macrophages, matrix metalloproteinase (MMP) activity) were measured in vivo using molecular-structural intravital microscopy (IVM) of femoral/saphenous VT (N = 24; 12 per group)[ 27 , 28 ]. For IVM molecular imaging of thrombus macrophages and MMP activity at day 4, a macrophage-avid dextranated nanoparticle (CLIO-AF555, 10 mg/kg, Center for Systems Biology Chemistry Core at Massachusetts General Hospital MGH, excitation/emission 555/565nm) and MMP activity sensor (MMP-2,-3,-9, and-13 activatable, MMPSense680, 150 nmol/kg, PerkinElmer, ex/em 680/700nm) dissolved in sterile PBS were injected via tail vein 24 hours beforehand, on day 3. On day 4 fifteen minutes prior to IVM, anesthetized mice were intravenously injected with fluorescent isothiocyanate-conjugated dextran (FITC-dextran, MW: 2,000,000, ex/em 490/520 nm, 0.5 mg in 100 μL PBS, Sigma) to provide angiograms and quantification of venous thrombosis [ 27 ]. In addition, serial IVM of thrombus burden was used to quantify statin-driven reductions in thrombus burden dynamically (N = 16 mice; 8 per group). For serial IVM studies at day 2 and day 4 in ferric chloride-induced femoral/saphenous VT, FITC-dextran was injected each time immediately before imaging. Residual FITC-dextran was not present 48 hours after injection, and therefore the thrombus length and volume measures were not confounded by retained FITC-dextran from prior injections delivery [ 27 ]. Intravital images were obtained on a custom-built, multiplexed confocal, two-photon microscope system [ 29 ]. High-resolution images of the femoral vein were captured at 30 frames/sec utilizing a 30X water-dipping LOMO objective, yielding a field-of-view of 714 μm by 714 μm. Images were generated as the summation of 30 time-averaged frames, and Z-stacks were acquired using a 5 μm step-size up-to depths of 150 μm from the superficial vein surface. Vessels were excited with laser light at wavelengths of 491 nm and 532 nm, generated by a single diode-pumped solid state laser (Dual Calypso, Cobolt AB) and the 635 nm excitation light generated by a diode laser (Radius, Coherent Inc.). FITC-dextran, CLIO-AF555, and MMPSense680 fluorescence were collected through a 509–547 nm bandpass filter, a 573–613 nm bandpass filter, and a 667–722 nm bandpass filter, respectively. Polarized microscopy of picrosirius red stained vein wall collagen Stasis-induced VT sections were stained with picrosirius red (S2365, Poly Scientific) to visualize collagen content in the venous wall in at day 2, 4, 8, 14, or 21 (n = 40; 4 mice per timepoint per group). Polarized micrographs were obtained via an Eclipse 90i microscope (Nikon, Japan) equipped with a color camera and utilizing NIS Elements Software. The vein wall thickness defined by the polarized micrographs were then measured on NIH ImageJ.
Image analysis
All image analysis utilized ImageJ software (64-bit, 1.47g, NIH, Bethesda, MD,[ 27 ]) unless otherwise noted. Briefly, z-stacks covering adjacent healthy vein and the thrombosed area were automatically stitched together in three-dimensions to create one large image stack of the entire thrombosed vein (ImageJ plugin[ 30 ]). The target-to-background ratios (TBRs) of CLIO- and MMPSense-enhanced thrombi were calculated from the 40 μm thick mid-lumen volume of z-steps from 20 μm to 60 μm from the surface of the vein. The thrombus TBR for CLIO or MMPSense was defined as: (whole thrombus ROI signal)/(healthy vessel background ROI signal). The background signal was measured on the healthy contralateral veins using a 40 μm thick mid-lumen summation. Whole thrombus ROIs were manually selected from the mid-lumen micrographs on the FITC-dextran angiogram channel. A previous publication reported a high intraclass correlation coefficient for the IVM measurement of thrombus area, and the IVM thrombus length was not statistically different compared to histological-based measurements [ 27 ].
Histology and Immunohistochemistry
Thrombosed veins or resected thrombi were carefully embedded in optimal cutting temperature (OCT) media and flash-frozen using a dry ice/isopentane slurry. 6-μm cryosections were cut for all histological analyses. FeCl 3 -induced venous thrombosis sections, were stained for the presence of plasminogen activator inhibitor (PAI-1,1:50, sc-8979, Santa Cruz Biotechnology Inc.) and tissue factor (TF, 1:100, ab104513, Abcam). Endogenous peroxidase activity was neutralized with 0.3% hydrogen peroxide treatment in PBS for 30 minutes followed by blocking (3% goat serum, 30 minutes) and primary antibody incubation overnight at 4°C. Immunopositive areas were visualized with Vectastain ABC kit and DAB substrate (Vector Labs). All sections were counterstained with Harris hematoxylin. Sections from 24 animals (12 animals per group) were quantified for each histological analysis. Adjacent sections were stain by hematoxylin-eosin (HE). Measurement of total cholesterol, plasma PAI-1, D-dimer, TAT, and fibrinogen levels At the time of sacrifice, blood was obtained by cardiac puncture with a heparinized syringe, and then centrifuged at 5000 rpm for 5 minutes. Plasma was isolated and stored at −80°C until time of assay. The total cholesterol levels were determined using a commercial colorimetric assay (T-Cho, Wako Chemicals). A PAI-1 ELISA kit (MPAI KT, Molecular Innovations) was utilized to measure plasma levels of total PAI-1. D-dimer (D2D, USCN Life Science Inc.), thrombin-antithrombin (TAT) complexes (IRAPKT175, Innovative Research) and fibrinogen levels (MFBGNKT, Molecular Innovations) were measured using commercially available ELISA kits. Immunoblotting The IVC thrombi were minced, homogenized and extracted with RIPA lysis buffer (Sigma) supplemented with proteinase inhibitors (cOmplete, Roche). Extracted protein concentration was determined by Bradford and after SDS-PAGE and transfer, membrane were probed for the presence of PAI-1 (1:200) and TF (1:1000) using above antibodies. Mac-3 (1:200, sc-19991, Santa Cruz), myeloperoxidase (1:1000, Ab-1, ThermoScientific), Ly6G (1:1000, 551459, BD Pharmigen) and citrullinated histone H3 (CitH3, 1:1000, ab5103, Abcam). Secondary HRP-conjugated goat anti-rabbit (1:1000, sc-2004, Santa Cruz Biotechnology Inc.) and HRP-conjugated goat anti-rat (1:1000, sc-2065, Santa Cruz Biotechnology Inc.) antibodies were utilized where applicable and then detected with ECL substrate (PerkinElmer). The loading control was β-actin (Sigma). Measurement of platelet function In C57/BL6 mice without thrombosis (N = 12 statin, N = 12 control), the effect of 3 days of statin therapy on platelet function was assessed by whole blood impedance aggregometry using the Multiplate platelet function analyzer (Verum Diagnostica Gmbh, [ 31 , 32 ]). Briefly, the Multiplate platelet analyzer is a U.S.
Food and Drug Administration
(FDA)-approved platelet function analyzer that measures electrical impedance generated by activated platelets attached to two sets of electrodes (for internal control) in a heparinized whole blood sample. The result consists of platelet aggregation curves with arbitrary aggregation units, measured over a 5-minute activation period. Platelet function is quantified as the mean area under the curve (AUC) and expressed in arbitrary units (a.u.). Whole blood was obtained via cardiac puncture into lithium-heparinized tubes and rested for 30 minutes at room temperature prior to analysis. Platelets were activated with agonists–adenosine diphosphate (ADP, final concentration 6.5 μg/ml), collagen (COL, type 1 Collagen, final concentration 3.2 μg/ml), and arachidonic acid (AA, final concentration 0.5 mM). We also attempted platelet activation with thrombin receptor-activating peptide—6 (TRAP-6, SFLLRN, final concentration 32 μM), but it resulted in little or no activation of murine platelets (data not shown). Consequently, analysis with this agonist was discontinued and results are not reported. All agonists were purchased from the Multiplate manufacturer as part of the clinical standard assay, and all protocols followed manufacturer guidelines. Thrombelastography Thrombelastography (TEG) was performed using the TEG-5000 system (Haemonetics) according to the manufacturer’s instructions. Briefly, citrated whole blood was collected and then rested for 15 minutes prior to assaying. Each sample was activated with kaolin as part of the standard assay. Recorded values were reaction time (r time; time to initial fibrin formation), alpha angle (α-angle; speed of clot build-up indicating interaction between fibrin and activated platelets and thus an indirect marker of platelet function) and maximum clot strength (MA, final product of fibrin and platelet interaction and thus also an indirect marker of clot strength). (N = 3 mice were pooled per group per run). A total of N = 18 C57/BL6 mice without thrombosis (9 atorvastatin and 9 PBS control) were used for 6 separate runs (3 for atorvastatin and 3 for PBS).
Measurement of bleeding time
The tail vein bleeding time was measured by determining the time required for clotting to occur after a transverse incision was made by an #10 scalpel blade over a lateral vein at a position where the tail was 2.5 mm thick [ 33 ]. After the incision, the tail vein was immersed in 37°C PBS in a conical tube. The time from incision to the cessation of bleeding was recorded as the bleeding time.
Statistical analysis
All results are reported as mean ± SD. Statistical analysis was performed using Prism (ver. 5.0c, GraphPad). Datasets were tested for normality using the Shapiro-Wilk test. If normal, two-group comparisons of parametric data were tested using the two-tailed Student’s t test, while nonparametric data were analyzed with the Mann-Whitney test. Significance between multiple groups was assessed by ANOVA with Dunnett’s test to compare all groups to control. Correlation coefficients were calculated as Pearson correlation coefficients. P values less than 0.05 were considered statistically significant.
Supporting Information S1 Fig Scheme of experimental groups utilized for in vivo studies in IVC stasis-induced VT (upper panel) and intravital morphological analysis of femoral ferric chloride/nonstasis-induced VT (lower panel). For control groups, statin therapy was replaced by PBS administration. ATV = atorvastatin, LMWH = low molecular weight heparin, ROS = rosuvastatin. (TIF) Click here for additional data file. S2 Fig Combination statin and LMWH therapies show significant reduction in thrombus burden in stasis-incuded VT compared to PBS-treated animals. Low molecular weight heparin (LMWH) only, and combination atorvastatin+LMWH (ATV+ROS) and rosuvastatin+LMWH (ROS+LMWH) have similar thrombus masses at day 4 ( A ).PBS, ATV and ROS only groups are included from Fig. 1A for ease of comparison to LMWH groups. LMWH- and ATV+LMWH-treatment showed reduced Factor Xa activity compared to PBS ( B ). Atorvastatin alone nonsignificantly reduced Factor Xa activity ( B ). *p
📊 Figures
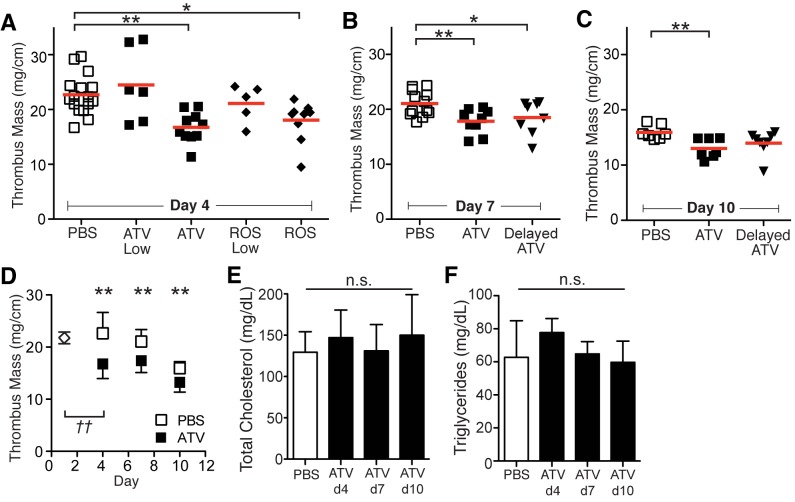
Figure 1
Statin therapy reduces thrombus burden in stasis-induced murine VT.
Atorvastatin-treated and rosuvastatin-treated mice animals showed decreased thrombus mass at days 4, 7 and 10 compared to PBS ( A-D ). Atorvastatin therapy started 72 hours (Late ATV) after VT inducti...
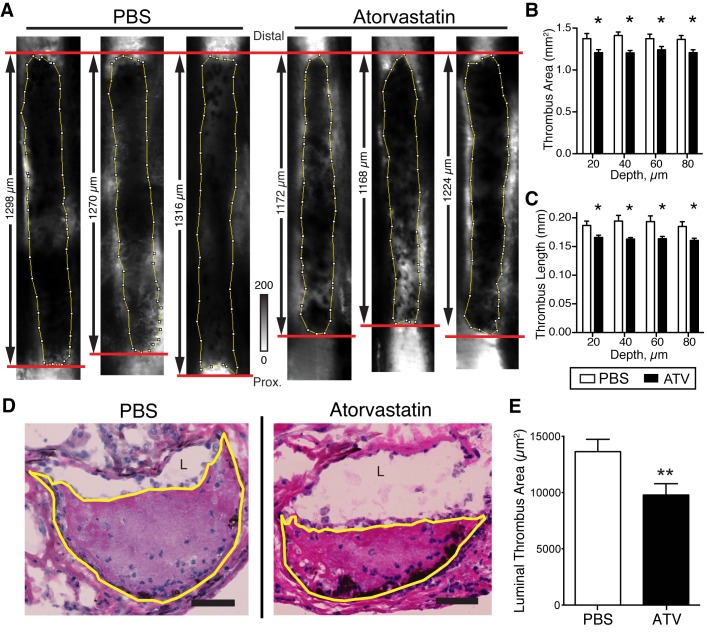
Figure 2
Statins reduce thrombus burden in non-stasis murine DVT.
Thrombi were visualized on IVM via a FITC-dextran angiogram as hypointense areas in the vein ( A ). Thrombus area and length measurements at 20, 40, 60, and 80 u03bcm below the superficial wall-lumen ...
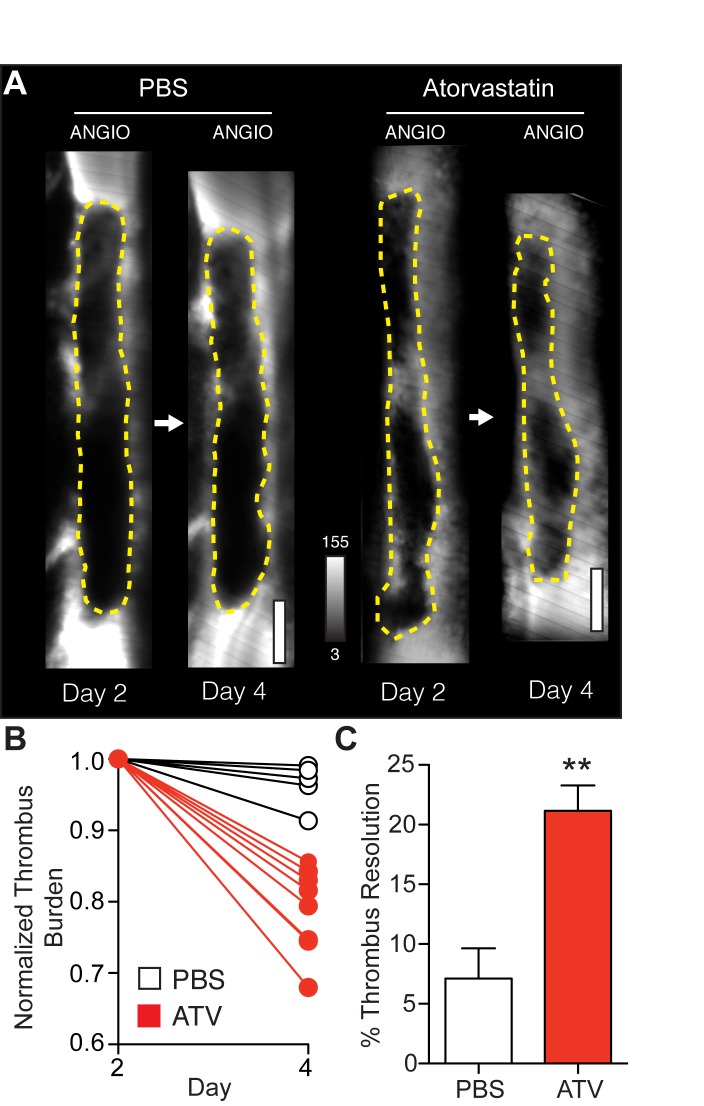
Figure 3
Early venous thrombus resolution is accelerated in atorvastatin-treated animals.
Representative serial IVM angiograms at days 2 and 4 post-DVT induction are shown in PBS- and atorvastatin-treated animals with non-stasis VT ( A ). Atorvastatin-treated animals showed greater thrombu...
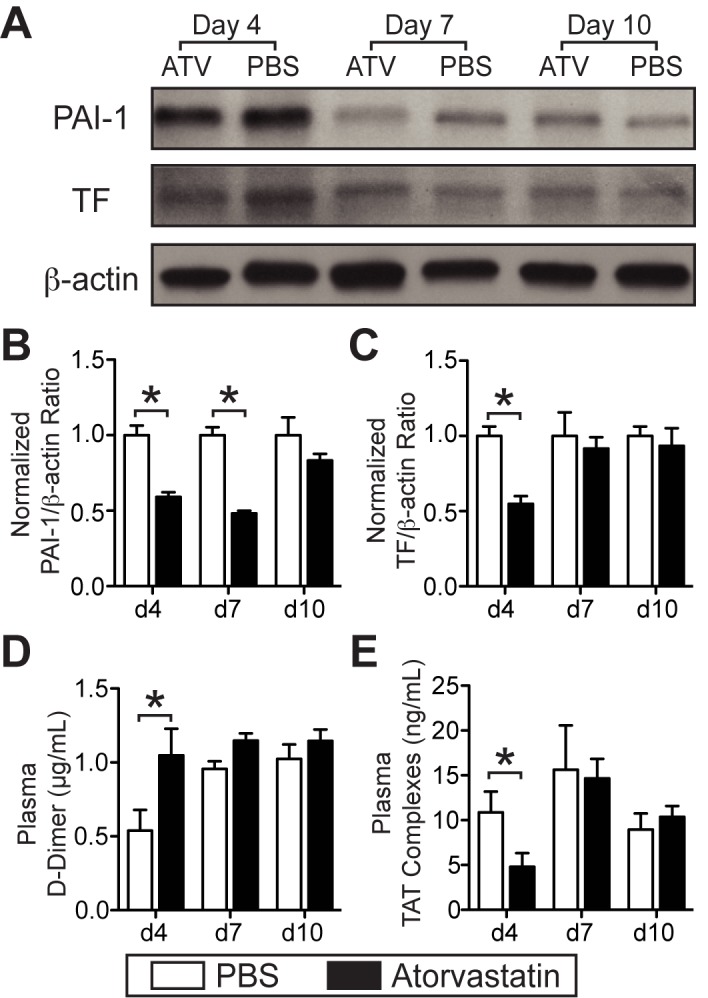
Figure 4
Atorvastatin enhances fibrinolysis and suppresses coagulation in murine VT at early timepoints.
Representative immunoblot of PAI-1, TF and loading control u03b2-actin from day 4, 7, and 10 stasis-induced VT is shown ( A ). Immunoblot analysis shows a reduction in the expression of PAI-1 at days ...
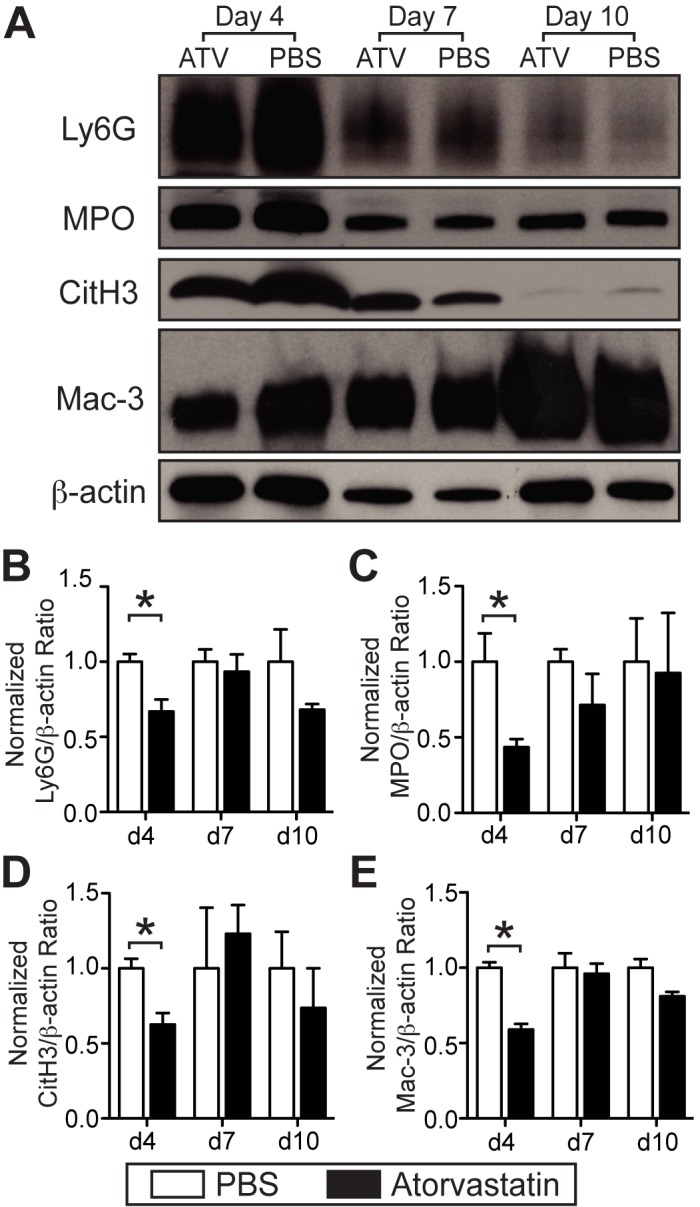
Figure 5
Atorvastatin reduces thrombus inflammation in murine VT at early timepoints.
Representative immunoblot of neutrophil markers Ly6G and MPO, NET marker CitH3 and macrophage marker Mac-3 from days 4, 7, and 10 stasis-induced VT is shown ( A ). Immunoblot analysis of stasis-induce...
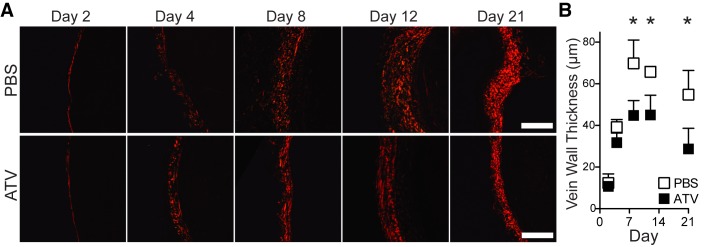
Figure 6
Atorvastatin reduces venous wall injury in stasis-induced murine IVC VT.
Representative polarized micrographs of Picrosirius red-stained sections from days 2, 4, 8, 12, or 21 VT show vein wall collagen (red fibers) from atorvastatin- and PBS-treated animals. IVC vein wall ...
Figure images are served from the NIH/NLM PubMed Central Open Access Subset or Europe PMC; copyright remains with the publishers and authors.
💬 Discussion
0 commentsNo comments yet. Be the first to start a discussion!
Leave a Comment