Abstract
Recent years have witnessed the emergence of bacterial semiorganelle encapsulins as promising platforms for bio-nanotechnology. To advance the development of encapsulins as nanoplatforms, a functional and structural basis of these assemblies is required. Encapsulin from Brevibacterium linens is known to be a protein-based vessel for an enzyme cargo in its cavity, which could be replaced with a foreign cargo, resulting in a modified encapsulin. Here, we characterize the native structure of B. linens encapsulins with both native and foreign cargo using cryo-electron microscopy (cryo-EM). Furthermore, by harnessing the confined enzyme (i.e., a peroxidase), we demonstrate the functionality of the encapsulin for an in vitro surface-immobilized catalysis in a cascade pathway with an additional enzyme, glucose oxidase. We also demonstrate the in vivo functionality of the encapsulin for cellular uptake using mammalian macrophages. Unraveling both the structure and functionality of the encapsulins allows transforming biological nanocompartments into functional systems.
🔬 Techniques
🧬 Organisms
✨ Fluorophores
🔬 Cell Lines
🏭 Microscope Brands
🧪 Reagent Suppliers
📷 Detectors
💻 Software Details
💾 Data Repositories
🏛️ Research Organizations (ROR)
Affiliated research institutions:
📋 Methods
Materials B. linens encapsulin was recombinantly expressed in E. coli and purified based on reported procedures. 14 , 18 Encapsulin samples were stored in “encapsulin storage buffer” containing 20 mM Tris-HCl, 150 mM NH 4 Cl, and 1 mM β-mercaptoethanol at pH 7.5 at 4 °C. For pH variation studies, 100 mM acetate buffer (CH 3 COONa–CH 3 COOH) was used to prepare pH 3, pH 4, and pH 5 buffers, 20 mM Tris-HCl buffer was used for pH 7.5 and pH 9 buffers, and 10 mM phosphate buffer (Na 2 HPO 4 –NaOH) was used for pH 10 and pH 11 buffers. All chemicals were purchased from Sigma-Aldrich unless stated otherwise. All incubations and reactions were conducted at room temperature unless stated otherwise.
Cryo-electron Microscopy and Image Processing Nonloaded and DyP- and TFP-loaded
B. linens encapsulin (5 μL) were applied to one side of Quantifoil R 2/2 holey grids, blotted, and plunged into liquid ethane in a Leica EM CPC cryofixation unit. Samples were analyzed in a Tecnai G2 electron microscope equipped with a field emission gun operating at 200 kV, and images were recorded under low-dose conditions with a FEI Eagle CCD at a detector magnification of 69 444× (2.16 Å/pixel sampling rate). Image processing operations were performed using Xmipp 36 and Relion 37 packages integrated in the Scipion platform. 38 Graphic representations were produced by UCSF Chimera. 39 The Xmipp automatic picking routine was used to select 6785, 19 591, and 29 680 individual particle images of nonloaded and DyP- and TFP-loaded encapsulin, respectively. A 1.2–4.1 μm defocus range was determined for each image with CTFfind4. 40 Particle images were extracted, normalized, and downsampled to a factor of 2, with a final sampling ratio of 4.32 Å/pixel. Using the Relion routine, a two-dimensional (2D) classification was performed to discard low-quality particles, and 5357, 15 941, and 19 779 isometric particles were selected for nonloaded and DyP- and TFP-loaded encapsulin, respectively. A 3D classification was run using the structure of Thermotoga maritima encapsulin (PDB entry 3DKT), low-pass filtered to 40 Å, as an initial model. When icosahedral symmetry was imposed, a single class with 4246, 12 833, and 15 976 particles was obtained for nonloaded and DyP- and TFP-loaded encapsulin, respectively. When assuming no symmetry for nonloaded and DyP- and TFP-loaded encapsulin, three classes were obtained, but no significant differences were observed between them at the resolutions achieved, and particles were refined together. DyP-loaded encapsulin particles were analyzed considering C 3 symmetry, and a single class with 9930 particles was selected. These data sets were used to obtain the final 3DR using the Relion autorefinement routine. Resolutions of 3D with icosahedral symmetry were estimated from two independent half data sets using the 0.5 (or 0.3) criterion of the Fourier shell correlation, and the values for nonloaded and DyP- and TFP-loaded encapsulin were 11.4 (10.7), 15.1 (13.5), and 13.5 (12) Å, respectively. Similarly, resolution values for asymmetric 3DR were 27.3 (23.8), 28.3 (25), and 24.2 (22.7) Å. For the DyP-loaded encapsulin with C 3 symmetry, resolution was 24.7 (22.8) Å. The Chimera fitting tool was used to dock the atomic crystallographic model T. maritima encapsulin into our cryo-EM encapsulin maps. The encapsulin 3DR are deposited in the Electron Microscopy Data Bank ( http://www.ebi.ac.uk/pdbe/emdb ) with accession no. EMD-3608 (nl-E), EMD-3612 (DyP-E), and EMD-3615 (TFP-E) for maps with icosahedral symmetry; EMD-3609 (nl-E), EMD-3614 (DyP-E) and EMD-3616 (TFP-E) for maps without imposing icosahedral symmetry; and EMD-3613 (DyP-E with C3 symmetry).
Show full methods section
Materials B. linens encapsulin was recombinantly expressed in E. coli and purified based on reported procedures. 14 , 18 Encapsulin samples were stored in “encapsulin storage buffer” containing 20 mM Tris-HCl, 150 mM NH 4 Cl, and 1 mM β-mercaptoethanol at pH 7.5 at 4 °C. For pH variation studies, 100 mM acetate buffer (CH 3 COONa–CH 3 COOH) was used to prepare pH 3, pH 4, and pH 5 buffers, 20 mM Tris-HCl buffer was used for pH 7.5 and pH 9 buffers, and 10 mM phosphate buffer (Na 2 HPO 4 –NaOH) was used for pH 10 and pH 11 buffers. All chemicals were purchased from Sigma-Aldrich unless stated otherwise. All incubations and reactions were conducted at room temperature unless stated otherwise.
Cryo-electron Microscopy and Image Processing Nonloaded and DyP- and TFP-loaded
B. linens encapsulin (5 μL) were applied to one side of Quantifoil R 2/2 holey grids, blotted, and plunged into liquid ethane in a Leica EM CPC cryofixation unit. Samples were analyzed in a Tecnai G2 electron microscope equipped with a field emission gun operating at 200 kV, and images were recorded under low-dose conditions with a FEI Eagle CCD at a detector magnification of 69 444× (2.16 Å/pixel sampling rate). Image processing operations were performed using Xmipp 36 and Relion 37 packages integrated in the Scipion platform. 38 Graphic representations were produced by UCSF Chimera. 39 The Xmipp automatic picking routine was used to select 6785, 19 591, and 29 680 individual particle images of nonloaded and DyP- and TFP-loaded encapsulin, respectively. A 1.2–4.1 μm defocus range was determined for each image with CTFfind4. 40 Particle images were extracted, normalized, and downsampled to a factor of 2, with a final sampling ratio of 4.32 Å/pixel. Using the Relion routine, a two-dimensional (2D) classification was performed to discard low-quality particles, and 5357, 15 941, and 19 779 isometric particles were selected for nonloaded and DyP- and TFP-loaded encapsulin, respectively. A 3D classification was run using the structure of Thermotoga maritima encapsulin (PDB entry 3DKT), low-pass filtered to 40 Å, as an initial model. When icosahedral symmetry was imposed, a single class with 4246, 12 833, and 15 976 particles was obtained for nonloaded and DyP- and TFP-loaded encapsulin, respectively. When assuming no symmetry for nonloaded and DyP- and TFP-loaded encapsulin, three classes were obtained, but no significant differences were observed between them at the resolutions achieved, and particles were refined together. DyP-loaded encapsulin particles were analyzed considering C 3 symmetry, and a single class with 9930 particles was selected. These data sets were used to obtain the final 3DR using the Relion autorefinement routine. Resolutions of 3D with icosahedral symmetry were estimated from two independent half data sets using the 0.5 (or 0.3) criterion of the Fourier shell correlation, and the values for nonloaded and DyP- and TFP-loaded encapsulin were 11.4 (10.7), 15.1 (13.5), and 13.5 (12) Å, respectively. Similarly, resolution values for asymmetric 3DR were 27.3 (23.8), 28.3 (25), and 24.2 (22.7) Å. For the DyP-loaded encapsulin with C 3 symmetry, resolution was 24.7 (22.8) Å. The Chimera fitting tool was used to dock the atomic crystallographic model T. maritima encapsulin into our cryo-EM encapsulin maps. The encapsulin 3DR are deposited in the Electron Microscopy Data Bank ( http://www.ebi.ac.uk/pdbe/emdb ) with accession no. EMD-3608 (nl-E), EMD-3612 (DyP-E), and EMD-3615 (TFP-E) for maps with icosahedral symmetry; EMD-3609 (nl-E), EMD-3614 (DyP-E) and EMD-3616 (TFP-E) for maps without imposing icosahedral symmetry; and EMD-3613 (DyP-E with C3 symmetry).
Characterization of Encapsulin Stability
Size-exclusion profiles of encapsulins upon pH and ionic strength variation were obtained by injecting and running 500 μL of each sample (∼15 μM) into a Superose 6 preparative column 10/100 GL (GE Healthcare FPLC Äkta purifier 900 with a 24 mL bed volume). The size-exclusion analysis was repeated two times. The hydrodynamic size distribution of the particles was determined using a Nanotrac Wave (Microtrac) particle analyzer. For particle imaging with TEM, 5 μL of a sample was applied onto Formvar-carbon-coated grids, and the liquid was drained after 30 s. Afterward, 5 μL of a staining solution consisting of uranyl acetate (1% w/v) was added onto the grids, and the liquid was drained after 1 min. For protein characterization with denaturing gel electrophoresis (SDS-PAGE), experiments using 12% polyacrylamide gel were conducted based on procedures in the literature, 41 and Bio-Safe Coomassie (Bio-Rad) was used for visualization of protein bands. Immobilization of Encapsulin onto a Glass/Si Surface Substrates were rinsed with water, activated by immersion/cycling piranha solution (H 2 SO 4 –H 2 O 2 , 3:1), rinsed with water and ethanol, and then dried with a steam of nitrogen. Perfluorophenyl-11-(triethoxysilyl)undecanoate (PFPS) was deposited by substrate immersion into a PFPS solution (dichloromethane (DCM), 10 mM) for 24 h at room temperature under an argon atmosphere. The glass wafer was rinsed with DCM to remove unreacted reagent and dried in a stream of N 2 . Encapsulin particles were deposited from buffered solution (0.2 M phosphate buffer, pH 7.2). The particles were drop-coated on the flat glass substrate overnight in a closed vessel to avoid solvent evaporation. Afterward, the glass was rinsed with buffer solution to remove nonimmobilized particles. Catalysis of Surface-Immobilized Encapsulin A 200 μL amount of glucose (three different final concentrations: 0.5, 3.2, and 5 mM) and 200 μL of ABTS (2.5 mM) in Tris-HCl buffer pH 7.5 were placed inside a cuvette together with the glass surface with the immobilized encapsulin particles. Afterward, 100 μL of GOx (1 μM) in PBS buffer pH 7.4 was added into the cuvette to start the reaction, and the absorption value at λ = 410 nm was immediately recorded for at least 6 min using a PerkinElmer Lamba 850 UV–visible spectrometer. As control experiments, a PFPS-modified glass surface without encapsulin particles was used for similar kinetic studies. The reaction rate based on radical ABTS production is calculated as follows: where A is the absorbance of radical ABTS at λ = 410 nm, ε is the extinction coefficient of radical ABTS at λ = 410 nm (36 000 M –1 cm –1 ), and b is the cuvette path length (1 cm). d A /d t corresponds to the maximum slope of the kinetic plots in Figures 4 D and S4 derived using OriginPro 9.0 software. The apparent turnover number k cat was calculated based on V max /DyP concentration. Although the particles were immobilized on the glass surface, the catalytic assay was performed in solution ( i . e ., the modified surface was fully immersed inside a cuvette). The DyP concentration was calculated based on the number of particles on the surface and the volume of the reaction. The catalytic assay was repeated at least two times. Cell Experiments B. linens encapsulins containing mTFP (monomeric teal fluorescent protein) were recombinantly produced in E. coli and purified using the same protocol established for native B. linens encapsulin. The concentration of TFP-E was 0.30 μM.
Murine macrophage cells
(J774) were cultivated in DMEM. Following the cultivation, 100 μL of ∼2000 cells was plated per well on a 96-well plate, and either 0 or 10 μL of TFP-E was added into the well (0 or 0.03 μM TFP-E, respectively). The treated cells were incubated at 37 °C and 5% CO 2 for 4 h to allow the cells to take up the particles. After 3.5 h of incubation, Hoechst nucleus stain was added to a final concentration of 0.5 μg/mL. Following the incubation, the medium was removed and the cells were rinsed 2× with phosphate buffer saline (10 mM PBS, pH 7.4) to further remove nonabsorbed species. A 100 μL amount of HEPES was added to the cells prior to visualization. For the visualization based on fluorescence, the cells were imaged using a fluorescence microscope (Olympus TH4-200 with an X-Cite series 120pc Q laser from Lumen Dynamics, excitation at λ = 460–490 nm, emission at λ = 525 nm).
Data and Schematic Representation
All data plotting and mathematical calculations were performed with OriginPro 9.0 software. Protein structures are rendered using PyMOL 1.3 software, and chemical structures are drawn using ChemBioDraw Ultra 12.0 software.
Materials B. linens encapsulin was recombinantly expressed in E. coli and purified based on reported procedures. 14 , 18 Encapsulin samples were stored in “encapsulin storage buffer” containing 20 mM Tris-HCl, 150 mM NH 4 Cl, and 1 mM β-mercaptoethanol at pH 7.5 at 4 °C. For pH variation studies, 100 mM acetate buffer (CH 3 COONa–CH 3 COOH) was used to prepare pH 3, pH 4, and pH 5 buffers, 20 mM Tris-HCl buffer was used for pH 7.5 and pH 9 buffers, and 10 mM phosphate buffer (Na 2 HPO 4 –NaOH) was used for pH 10 and pH 11 buffers. All chemicals were purchased from Sigma-Aldrich unless stated otherwise. All incubations and reactions were conducted at room temperature unless stated otherwise.
Supplementary Material nn7b07669_si_001.pdf
📊 Figures
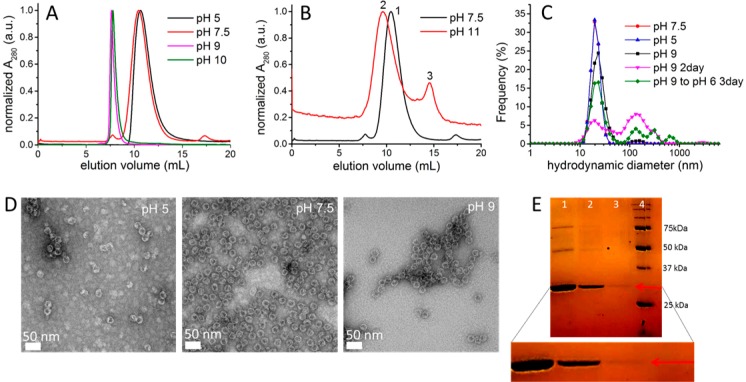
Figure 1
Characterization of encapsulin at different pH values.n(A) Size-exclusionnprofiles of encapsulin at acidic, native, and basic pH monitored atnu03bb = 280 nm, revealing a single peak of encapsulin ( V ...
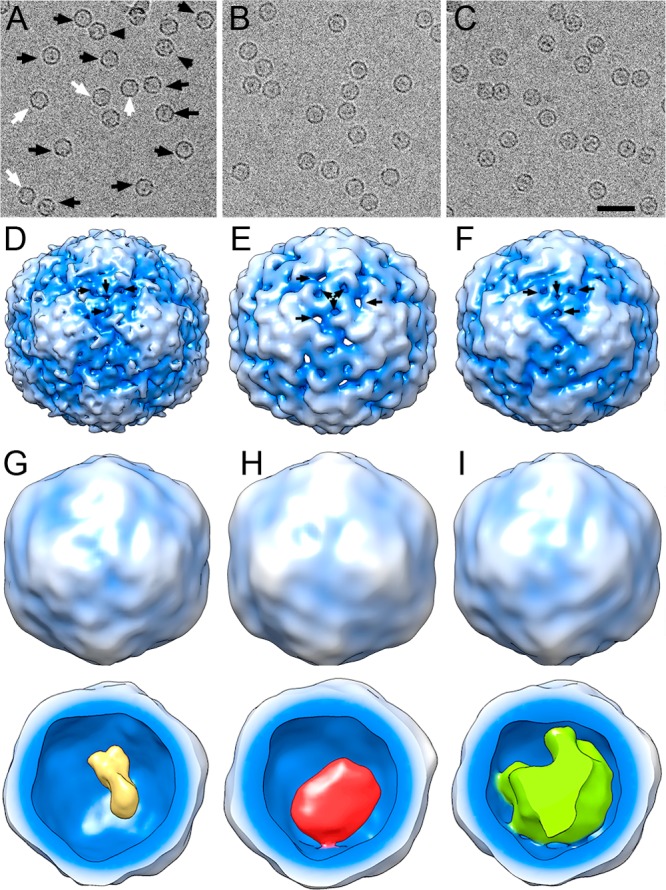
Figure 2
Cryo-EM images and 3DR of nonloaded and DyP-nand TFP-loaded encapsulinnfrom B. linens. (Au2013C) Cryo-electron micrographsnof purified nonloaded encapsulin (nl-E) (A), DyP-loaded encapsulinn(DyP-E) (B...
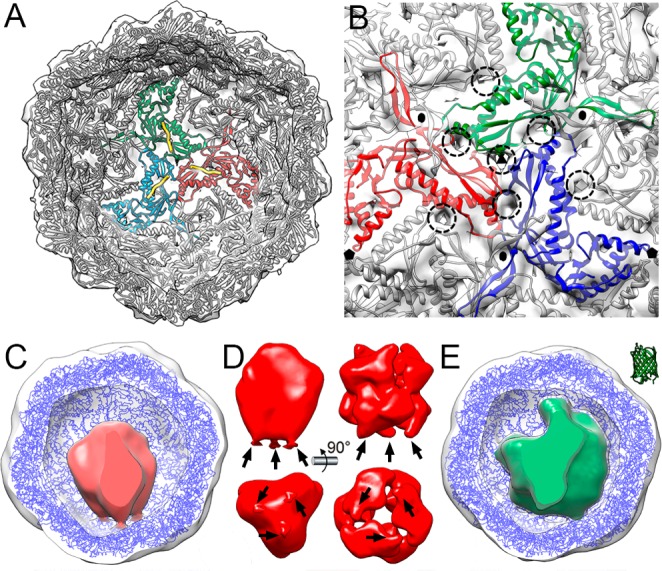
Figure 3
Pseudoatomic models of nl-E, DyP-E, and TFP-E.n(A) nl-E inner surfacenviewed along a 3-fold axis, with docked T. maritima encapsulin atomic coordinates. Encapsulin monomers at the 3-foldnaxis are depi...
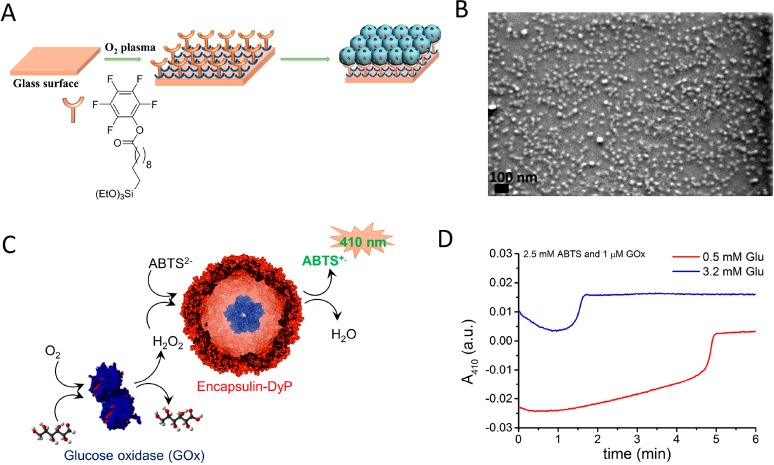
Figure 4
Surface-immobilized encapsulin as a bionanoreactor. (A)nImmobilizationnstrategy of encapsulin particles on a glass surface using PFPS moleculesnas linkers. (B) SEM image of surface-immobilized encapsu...
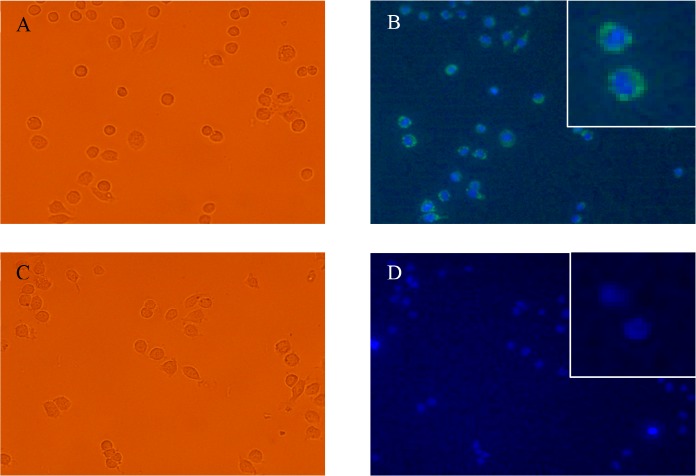
Figure 5
Fluorescence microscopy images of J774 macrophagesntreated withnTFP-E. (A) Bright-field image of macrophages treated with 0.033 u03bcMnTFP-E. (B) Fluorescence microscopy images of macrophages treated ...
Figure images are served from the NIH/NLM PubMed Central Open Access Subset or Europe PMC; copyright remains with the publishers and authors.
💬 Discussion
0 commentsNo comments yet. Be the first to start a discussion!
Leave a Comment