Abstract
Abstract The organic anion transporting polypeptides OATP1B1 and OATP1B3 are membrane proteins that mediate uptake of drugs into the liver for subsequent conjugation and biliary excretion, a key step in drug elimination from the human body. Polymorphic variants of these transporters can cause reduced drug clearance and adverse drug effects such as statin-induced rhabdomyolysis, and co-administration of OATP substrates can lead to damaging drug-drug interaction. Despite their clinical relevance in drug disposition and pharmacokinetics, the structure and mechanism of OATPs are unknown. Here we present cryo-EM structures of human OATP1B1 and OATP1B3 bound to synthetic Fab fragments and in functionally distinct states. A single estrone-3-sulfate molecule is bound in a pocket located in the C-terminal half of OATP1B1. The shape and chemical nature of the pocket rationalize the preference for diverse organic anions and allow in silico docking of statins. The structure of OATP1B3 is determined in a drug-free state but reveals a bicarbonate molecule bound to the conserved signature motif and a histidine residue that is prevalent in OATPs exhibiting pH-dependent activity.
🔬 Techniques
🔭 Microscopes
🧬 Organisms
💻 Software
✨ Fluorophores
🔬 Cell Lines
🏭 Microscope Brands
🧪 Reagent Suppliers
📷 Detectors
💻 Software Details
💾 Data Repositories
🏛️ Research Organizations (ROR)
Affiliated research institutions:
📋 Methods
Construct design and protein expression Human OATP1B1 (Uniprot: Q9Y6L6 ) and OATP1B3 (Uniprot: Q9NPD5 ) genes were codon-optimized for expression in human cells and purchased from GenScript. The synthetic genes were independently cloned in a pcDNA5 vector with a cleavable C-terminal YFP-1D4 tag. For protein expression, tetracycline-inducible stable cell lines (Flp-In™ T-REx™ 293 Cell Line, Thermo Fisher Scientific) were generated for each construct. Cells were grown and maintained in Dulbecco’s Modified Eagle Medium (DMEM, Gibco) supplemented with 10% fetal bovine serum (FBS, Thermo Fisher Scientific), 100 μg/mL streptomycin, 100 units/mL penicillin (Thermo Fisher Scientific) at 37 °C with 5% CO 2 under humidified conditions. Before protein expression, the media was aspirated, the cells were washed once with phosphate-buffered saline (PBS) buffer, and expression medium consisting of fresh phenol red dye-free DMEM (Gibco) supplemented with 2% FBS, 100 μg/mL streptomycin, 100 units/mL penicillin, 1x GlutMAX (Thermo Fisher Scientific), and 1x Sodium Pyruvate (Thermo Fisher Scientific), was added. Protein expression was induced with 1 μg/mL tetracycline (Sigma) at 37 °C. Following 72 h of expression, cells were harvested, washed with PBS, flash-frozen in liquid nitrogen, and stored at −80 °C for a maximum of 6 months.
Cell-based transport experiments Stable cell lines expressing
OATP1B1 or OATP1B3 were independently seeded onto a 24-well plate (300,000 cells/well) previously coated with poly-D-lysine. Cells were grown for 18-24 h until they were 60–80% confluent. Before induction with 1 μg/mL tetracycline, the cells were washed with 1 mL of PBS. Afterwards, 0.75 mL/well of expression medium were added. For negative control, tetracycline was omitted. Following 24 h of expression, media was removed, and the cells were washed three times with 500 μL of pre-warmed Uptake Buffer (UB; 136 mM NaCl, 1.8 mM CaCl 2 , 1.1 mM KH 2 PO 4 , 0.8 mM MgSO 4 , 5.3 mM KCl, 11 mM D-glucose, and 20 mM HEPES, pH adjusted with 3 M Tris to pH 7.4). Transport was initiated by the addition into each well of 250 μL of UB containing 1.0125 μM of non-radiolabelled (Sigma) and radiolabelled (40 Ci/mmol, PerkinElmer) estrone-3-sulfate (E1S) for OATP1B1, and 1.01 μM non-radiolabelled (Sigma) and radiolabelled (46.3 Ci/mmol) estradiol-17-β-D-glucuronide (E17βG) for OATP1B3, at a molar ratio of 1:80 or 1:100 hot to cold substrate, respectively. For the competition assays, statins (100 μM atorvastatin or pitavastatin for OATP1B1 and 100 μM pitavastatin or 50 μM telmisartan for OATP1B3) were added to the UB. The uptake assay was stopped after 30 sec by aspirating the UB and immediately washing the cells three times with 500 μL ice-cold UB supplemented with 20 μM non-radiolabelled substrate. Cells were solubilized by adding 500 μL buffer composed of 2% Triton-X-100 and 1 M NaCl for 1 h at 37 °C. Total protein concentration per condition was measured in triplicates for OATP1B1, and duplicates for OATP1B3 using the BCA assay according to the manufacturer’s manual. For OATP1B1 350 μL of lysed cells, and for OATP1B3 450 μL were transferred to a 4 mL Scintillation Vial Ultima Gold (PerkinElmer). Intracellular radioactivity was measured by liquid scintillation counting after 24 h incubation. Data points compromised by technical errors were omitted from the analysis, resulting in an uneven number of replicates for different conditions. Data were processed and analyzed using ordinary one-way ANOVA, multiple comparison test (Dunnett’s test at 95% CI) in GraphPad Prism (version 9.0).
Show full methods section
Construct design and protein expression Human OATP1B1 (Uniprot: Q9Y6L6 ) and OATP1B3 (Uniprot: Q9NPD5 ) genes were codon-optimized for expression in human cells and purchased from GenScript. The synthetic genes were independently cloned in a pcDNA5 vector with a cleavable C-terminal YFP-1D4 tag. For protein expression, tetracycline-inducible stable cell lines (Flp-In™ T-REx™ 293 Cell Line, Thermo Fisher Scientific) were generated for each construct. Cells were grown and maintained in Dulbecco’s Modified Eagle Medium (DMEM, Gibco) supplemented with 10% fetal bovine serum (FBS, Thermo Fisher Scientific), 100 μg/mL streptomycin, 100 units/mL penicillin (Thermo Fisher Scientific) at 37 °C with 5% CO 2 under humidified conditions. Before protein expression, the media was aspirated, the cells were washed once with phosphate-buffered saline (PBS) buffer, and expression medium consisting of fresh phenol red dye-free DMEM (Gibco) supplemented with 2% FBS, 100 μg/mL streptomycin, 100 units/mL penicillin, 1x GlutMAX (Thermo Fisher Scientific), and 1x Sodium Pyruvate (Thermo Fisher Scientific), was added. Protein expression was induced with 1 μg/mL tetracycline (Sigma) at 37 °C. Following 72 h of expression, cells were harvested, washed with PBS, flash-frozen in liquid nitrogen, and stored at −80 °C for a maximum of 6 months.
Cell-based transport experiments Stable cell lines expressing
OATP1B1 or OATP1B3 were independently seeded onto a 24-well plate (300,000 cells/well) previously coated with poly-D-lysine. Cells were grown for 18-24 h until they were 60–80% confluent. Before induction with 1 μg/mL tetracycline, the cells were washed with 1 mL of PBS. Afterwards, 0.75 mL/well of expression medium were added. For negative control, tetracycline was omitted. Following 24 h of expression, media was removed, and the cells were washed three times with 500 μL of pre-warmed Uptake Buffer (UB; 136 mM NaCl, 1.8 mM CaCl 2 , 1.1 mM KH 2 PO 4 , 0.8 mM MgSO 4 , 5.3 mM KCl, 11 mM D-glucose, and 20 mM HEPES, pH adjusted with 3 M Tris to pH 7.4). Transport was initiated by the addition into each well of 250 μL of UB containing 1.0125 μM of non-radiolabelled (Sigma) and radiolabelled (40 Ci/mmol, PerkinElmer) estrone-3-sulfate (E1S) for OATP1B1, and 1.01 μM non-radiolabelled (Sigma) and radiolabelled (46.3 Ci/mmol) estradiol-17-β-D-glucuronide (E17βG) for OATP1B3, at a molar ratio of 1:80 or 1:100 hot to cold substrate, respectively. For the competition assays, statins (100 μM atorvastatin or pitavastatin for OATP1B1 and 100 μM pitavastatin or 50 μM telmisartan for OATP1B3) were added to the UB. The uptake assay was stopped after 30 sec by aspirating the UB and immediately washing the cells three times with 500 μL ice-cold UB supplemented with 20 μM non-radiolabelled substrate. Cells were solubilized by adding 500 μL buffer composed of 2% Triton-X-100 and 1 M NaCl for 1 h at 37 °C. Total protein concentration per condition was measured in triplicates for OATP1B1, and duplicates for OATP1B3 using the BCA assay according to the manufacturer’s manual. For OATP1B1 350 μL of lysed cells, and for OATP1B3 450 μL were transferred to a 4 mL Scintillation Vial Ultima Gold (PerkinElmer). Intracellular radioactivity was measured by liquid scintillation counting after 24 h incubation. Data points compromised by technical errors were omitted from the analysis, resulting in an uneven number of replicates for different conditions. Data were processed and analyzed using ordinary one-way ANOVA, multiple comparison test (Dunnett’s test at 95% CI) in GraphPad Prism (version 9.0).
OATP1B1 and OATP1B3 protein purification
Cell pellets were thawed at room temperature, broken by 25 strokes in a Dounce homogenizer in lysis buffer containing 25 mM HEPES pH 7.4, 150 mM NaCl, 20% (v/v) glycerol, 1 mM PMSF (phenylmethylsulfonyl fluoride), 2 μg/mL DNaseI (Roche), and protease inhibitor cocktail (Sigma). All subsequent steps were performed at 4 °C. Cell lysate was solubilized with 1% DDM (n-dodecyl-β-d-maltopyranoside, Anatrace), 0.2% (w/v) CHS (cholesteryl hemisuccinate, Anatrace) for 60–90 min. The solubilized lysate was ultracentrifuged at 140,000 × g in a Type 45-Ti rotor (Beckman) and the supernatant was incubated with pre-equilibrated Sepharose-coupled Rho-ID4 antibody (University of British Columbia) for 2–3 h. The resin was washed four times with ten column volumes (CV) of purification buffer containing 25 mM HEPES, pH 7.4, 150 mM NaCl, 20% glycerol, 0.025% DDM, and 0.005% CHS, followed by four washes with ten CV of wash buffer containing 25 mM HEPES, pH 7.4, 150 mM NaCl, 0.025% DDM, 0.005% CHS or supplemented with 10% glycerol for OATP1B1. After this step, OATP1B1 was eluted from the resin with 3 CV of wash buffer supplemented with 0.5 mg/mL 1D4 peptide following overnight incubation. OATP1B3 was eluted by incubating the resin with 3 CV of wash buffer containing 3C protease at a 1:50 wt/wt ratio for 1 h at 4 °C. Nanodisc reconstitution Pre-mixed lipids (Brain Polar Lipid Extract, Avanti) with cholesterol (Avanti) were solubilized with detergent and added to purified OATP1B1 or OATP1B3 and incubated for 10 min at room temperature. Purified membrane scaffold protein MSP1D1 was added to the mixture and incubated for an additional 20 min at room temperature. Bio-Beads SM-2 were pre-washed with HBS (25 mM HEPES, pH 7.4, 150 mM NaCl) and added before overnight incubation. Nanodisc-reconstituted OATP1B3 was pre-mixed with Fab19 at a molar ratio of 1:1 and the OATP1B3-Fab19 sample was further purified by size-exclusion chromatography in HBS prior to sample freezing. For OATP1B1, the eluted mixture was incubated for 5 h with pre-equilibrated Sepharose-coupled Rho-ID4 antibody and washed four times with 3 CV of HBS to remove empty nanodiscs. The purification tag was removed by incubating for 2 h with 3C protease. Eluted mixture was premixed with 1:1.75 molar excess Fab18 prior to size-exclusion chromatography step (Superdex 200 Increase 10/300 column, GE Healthcare) in HBS buffer to remove excess Fab. OATP1B3 biotinylation An OATP1B3 expression construct containing an Avi-tag sequence (GLNDIFEAQKIEWHE) was generated using PCR-restriction cloning (forward primer 5′-TCG ACG GGT TGA ATG ATA TTT TCG AAG CAC AGA AAA TTG AAT GGC ATG AGG − 3′ and reverse primer 5′-CGG GTT GAA TGA TAT TTT CGA AGC ACA GAA AAT TGA ATG GCA TGA GGT CGA − 3′). Protein expression and purification were performed as described above with the following changes. Cell pellets were lysed and subsequently solubilized with 1% LMNG (lauryl maltose meopentyl glycol, Anatrace), 0.2% CHS (w/v). Following elution with 3C protease to remove the purification tag, the sample was enzymatically biotinylated using in-house purified BirA, as described previously 44 . Briefly, the OATP1B3 Avi-tag construct was incubated overnight at a 1:1 molar ratio with in-house purified BirA to protein in buffer supplemented with 0.02% LMNG, 0.004% CHS, 250 μM biotin, 10 mM ATP, 50 mM Bicine, pH 8.3, and 10 mM Mg Acetate. Biotinylation efficiency of the sample was verified by a pull-down assay on streptavidin-coated (SA) magnetic particles (Promega). Biotinylated OATP1B3 was purified by size-exclusion chromatography in HBS supplemented with 0.02% LMNG and 0.004% CHS. Phage display selection Biotinylated OATP1B3 was used for phage display selection. Phage display selection was performed at 4 °C according to published protocols 45 . The selection buffer consisted of 25 mM HEPES, pH 7.4, 150 mM NaCl, 0.02% LMNG, 0.004% CHS, and 0.5% BSA. In the first round, 250 nM of target was immobilized on 250 µL SA magnetic beads. Then, 100 μL of a phage library E were added to the target bound to the SA beads and incubated for 30 min 46 . The resuspended beads containing bound phages were washed extensively and then used to infect log phase E.coli XL1-Blue cells. Phages were amplified overnight in 2xYT media with 50 µg/mL ampicillin and 10 9 p.f.u./mL of M13-KO7 helper phage. To obtain binders of high affinity and specificity, four additional rounds of selection were performed with decreasing the target concentration in each round with the final concentration of the target being 25 nM in the 5 th round of selection. In each round, the amplified pool of phages of the preceding round was used as the input. From the second round onwards, the bound phages were eluted using 100 mM glycine, pH 2.7. This elution technique often results in the elution of non-specific and Streptavidin binders. To eliminate them, the precipitated phage pool from the second round onwards were negatively selected against 100 µL of SA magnetic beads before adding them to the target. The pre-cleared phage pool was then used as input for the selection. Single-point phage ELISA The ELISA experiments were performed at 4 °C in 96-well plates coated with 50 µL of 2 µg/mL neutravidin in Na 2 CO 3 buffer, pH 9.6 and subsequently blocked by 0.5% BSA in PBS. A single-point phage ELISA was used to rapidly screen the binding of the obtained Fab fragments displayed on phage. Colonies of E.coli XL1-Blue harboring phagemids from 5th round of selection were inoculated directly into 500 μL of 2xYT broth supplemented with 100 μg/mL ampicillin, and M13-KO7 helper phage. The cultures were grown overnight at 37 °C in a 96-deep-well block plate. The ELISA buffer was identical to that used in selection. The experimental wells in the ELISA plates were incubated with 50 nM OATP1B3 in ELISA buffer for 15 min. Only buffer was added to the control wells. Overnight culture supernatants containing Fab phage were diluted 10-fold in ELISA buffer. The diluted phage supernatants were then transferred to ELISA plates that were pre-incubated with biotinylated target and washed with ELISA buffer. The ELISA plates were incubated with the phage for another 15 min and then washed with ELISA buffer. The washed ELISA plates were incubated with a 1:1 mixture of mouse anti-M13 monoclonal antibody (GE HealthCare, 1:5000 dilution in ELISA buffer) and peroxidase conjugated goat anti-mouse IgG (Jackson Immunoresearch, 1:5000 dilution in ELISA buffer) for 30 min. The plates were washed again, developed with TMB substrate, then quenched with 1.0 M HCl, and the absorbance at 450 nm was determined. The background binding of the phage was monitored by the absorbance from the control wells. Sequencing, cloning, expression and purification of Fab fragments From phage ELISA, clones (selected based on a high ratio of ELISA signal of target binding to background) were sequenced at the DNA Sequencing Facility at the University of Chicago. Twelve unique clones were obtained. These were sub-cloned in pRH2.2, an IPTG inducible vector for expression of Fabs in E. coli . E. coli C43 (Pro + ) cells were transformed with sequence-verified clones of Fab fragments in pRH2.2 47 . Fab fragments were grown in TB autoinduction media with 100 μg/mL ampicillin overnight at 30 °C. Harvested cells were kept frozen at −80 °C until use. Frozen pellets were re-suspended in PBS supplemented with 1 mM PMSF, and 1 μg/mL DNaseI. The suspension was lysed by ultrasonication. The cell lysate was incubated at 65 °C for 30 min followed by centrifugation. The supernatant was filtered through 0.22 µm filter and loaded onto a HiTrap Protein L 5-mL column pre-equilibrated with lysis buffer (20 mM HEPES buffer, pH 7.4, 500 mM NaCl). The column was washed with 10 column volumes of lysis buffer followed by elution of Fab fragments with elution buffer (100 mM acetic acid). Fractions containing protein were directly loaded onto a Resource S 1-mL column pre-equilibrated with buffer A (50 mM sodium acetate, pH 5.0) followed by washing with 10 column volumes wash with buffer A. Fab fragments were eluted with a linear gradient 0–50% of buffer B (50 mM sodium acetate, pH 5.0, 2.0 M NaCl). Affinity and ion-exchange chromatography were performed using an automated program on ÄKTA explorer system. Purified Fabs were dialyzed overnight against 20 mM HEPES, pH 7.4, 150 mM NaCl. The quality of purified Fab fragments was analyzed by SDS–PAGE. Multipoint protein ELISA for EC 50 determination Multipoint ELISA was performed at 4 °C to estimate the affinity of the Fabs to OATP1B3. 25 mM HEPES, pH 7.4, 150 mM NaCl, 0.02% LMNG, and 0.004% CHS supplemented with 0.5% BSA was used as the ELISA buffer. 50 nM of target immobilized on a neutravidin coated ELISA plate was incubated with 3-fold serial dilutions of the purified Fabs starting from 4 μM for 20 min. The plates were washed, and the bound target-Fab complexes were incubated with a secondary HRP-conjugated Pierce recombinant protein L (Thermo Fisher Scientific, 1:5000 dilution in ELISA buffer) for 30 min. The plates were again washed, developed with TMB substrate, quenched with 1.0 M HCl, and absorbance (A 450 ) was determined. To determine the affinities, the data were fitted in a dose-response sigmoidal function in GraphPad Prism and EC 50 values were calculated. Cryo-EM studies Cryo-EM grids were prepared using a Vitrobot Mark IV (FEI) with an environmental chamber set at 95% humidity and 4 °C. Aliquots of 3.5 μL of purified OATP1B1 in complex with Fab18 in presence of 0.065 mM E1S or OATP1B3:Fab19 complex in presence of 0.05 mM atazanavir at a protein concentration of 0.22 mg/mL and 0.54 mg/mL respectively, were placed onto Quantifoil carbon grids (R1.2/1.3, 300 mesh, copper) previously glow-discharged for 45 s with 25 mA using Pelco easiGlow Glow Discharge Cleaning System. Grids were blotted for 3.5 s and flash-frozen in a mixture of liquid ethane and propane cooled by liquid nitrogen. Grids were imaged with a Titan Krios (Thermo Fisher Scientific) electron microscope operated at 300 keV, equipped with a Gatan K3 Summit direct electron detector and Gatan Imaging Filter (GIF), with a slit width of 20 eV to remove inelastically scattered electrons. Movies were recorded semi-automatically with EPU2 software (Thermo Fisher Scientific) in super-resolution counting mode with a defocus range of –0.6 to –2.2 μm and a super-resolution pixel size of 0.255 Å/pixel. The final E1S-bound OATP1B1-Fab18 dataset consisted of 21,416 super-resolution movies collected during three separate Titan Krios sessions, including 20 degrees and a 30 degrees tilted datasets containing 1424 and 7041 movies, respectively. Tilted datasets were collected to overcome the problem of particle preferred orientation. Each movie was exposed for 1.5 s with an exposure time of 0.03 s per frame with electron exposure of 10.5 e-/pix/s, resulting in 50 frames per movie and a frame exposure rate of 1.2 e-/Å 2 . The final OATP1B3-Fab19 dataset was composed of 25,887 super-resolution movies collected during two cryo-EM sessions. Movie stacks had identical exposure time, dose, and frame number as the the E1S-bound OATP1B1-Fab18 dataset.
Image processing
The analyses of data processing are presented in Supplementary Figs. 4 and 5 . Briefly, the multiframe micrographs from all datasets were processed in Relion 4 starting with the motion correction (MotionCor2), the dose weighting and binning by a factor of 2 (resulting in a pixel size of 0.51 Å/px) 48 , 49 . Gctf was used to estimate the parameters of contrast transfer function (CTF) 50 The micrographs were automatically sorted in Relion, and only those with an estimated resolution lower than 4 Å (or lower than 5 Å for datasets with tilt stage) were selected for further processing. First, particles were autopicked using Laplacian-of-Gaussian filtering and 2D classified in several rounds, followed by a generation of ab initio models of both OATP1B1-Fab18 and OATP1B3-Fab19 complexes. These models were used accordingly as template for the particles autopicking. Extracted particles were binned by a factor of 4 and used for several rounds of 2D and 3D classifications. From each dataset the 3D classes that most closely represented the expected structure of the complexes were selected. For the OATP1B1-Fab18 dataset, the combined particles from three datasets (737,734 particles) were re-extracted (unbinned to 0.51 Å/px) and used for 3D classification. The class with the well-resolved TMD region was selected (198,430 particles) and used for another 3D classification. Then the class, in which ICLs were well-resolved, was selected, 3D refined and CTF refined. The particles (104,547) were Bayesian polished (first 20 frames), again CTF refined and 3D refined using mask that excluded the density of the nanodisc and the constant domain (Fc) of the Fab18. The final EM density map generated in Relion yielded 3.55 Å resolution. Next, the shiny particles from Relion were transferred to CryoSPARC4.1. 51 The NU-refinement, followed by the Local CTF refinement and another NU-refinement yielded the final map at 3.67 Å resolution. The half-maps from the last 3D refinement were sharpened and post-processed with DeepEMhancer. 52 For the OATP1B3-Fab19 complex dataset, the combined particles from two datasets (729,787 particles) were used for 3D classification. The class with the well-resolved TMD and ECD regions was selected (287,710 particles) and the particles were re-extracted (unbinned to 0.51 Å/px), followed by the 3D refinement. Then the particles were 3D classified without alignment and with masking out the nanodisc and constant domain (Fc) of the Fabs. Among the four classes, we did not observe more than a single conformation or any density indicating the presence of the atazanavir molecule. Therefore, the class that showed good connectivity of the signal and the best resolved TMD and ECD regions was selected for further processing. The 75,610 particles were 3D refined, Bayesian polished (first 15 frames), CTF refined, 3D refined and post-processed (B-factor sharpened) yielding the final EM density map at 2.97 Å resolution.
Model building and refinement
Model building for both OATP1B1 and OATP1B3 was performed using Coot 53 . Both maps were of sufficient resolution to allow de novo building of the transmembrane regions and parts of the extracellular domains of the transporters. The variable domain of the Fab binders were modelled de novo in Coot and the chemical structures for E1S, HCO 3 − and cholesterol were obtained from the monomer library available in Coot, using the codes FY5, BCT and CLR, respectively. The generated models were refined in Phenix using Real Space Refinement, and the quality was assessed by MolProbity. Further analyses of the EM density map and the model for each structure are presented in Supplementary Figs. 7 and 8 . Q-scores were calculated with the MapQ plug-in in UCSF Chimera. The directional FSC plots were generated on the remote 3DFSC Processing Server 54 , 55 .
Ligand docking
The chemical structures of the compounds (E1S, statins, estradiol 17β-D-glucuronide) were taken from the Zinc15 database ( https://zinc15.docking.org/ ) or PubChem ( https://pubchem.ncbi.nlm.nih.gov/ ). If necessary, the carboxyl group was modified (deprotonated) in JSME Molecular Editor (Zinc15) and the SMILES strings were copied. The SMILES were converted to SDF format in OpenBabel 56 . The ligand PDBQT files were generated from SDF files using the Meeko python package (mk_prepare_ligand.py, with default settings: add Gasteiger partial charges, merge non-polar hydrogen atoms, assign atom types). The protonation state of the ligands was checked before docking. For molecular docking with flexible side chains, we used the PDBQT ligand files. Flexible docking was performed using Autodock Vina as described in the online tutorial ( https://autodock-vina.readthedocs.io/en/latest/docking_flexible.html# ). Briefly, docking was performed with either our current OATP1B1 model (the E1S was removed) or the OATP1B3 homology model based on our OATP1B3 and OATP1B1 structures built in SWISS-MODEL ( https://swissmodel.expasy.org/ ). The models were prepared for the docking using Autodock Vina with prepare_receptor with the default settings; the missing hydrogen atoms (prepare_receptor, -A “hydrogens” flag) and Gasteiger charges were added to the models. For each of the OATP1B transporters, a set of eight flexible residues from TM7, TM9 and TM10 involved in the substrate binding was selected, i.e., Phe356, Tyr352, Val359, Tyr422, Tyr425, Asn544, Leu545, Gln541 for OATP1B1, and Phe356, Phe352, Val359, Gln422, Tyr425, Asn544, Ser545, Gln541 for OATP1B3. The rigid and flexible parts of the transporters were calculated (prepare_flexreceptor.py, -s flag). The Vina forcefield was used for the analyses. The center and dimensions of the grid space were defined (in Angstrom) Grid center: X 120 Y 130 Z 110. Grid size: X 30 Y 30 Z 30. An exhaustiveness of 64 was used for a more extensive sampling of poses. Nine poses were generated for each system and classified based on their affinity scores (in kcal/mol). Autodock Vina wrote the PDBQT output files which were displayed in ChimeraX using the interactive ViewDockX tool.
Figure preparation
Figures were prepared using the programs ChimeraX, PyMOL (The PyMOL Molecular Graphics System, DeLano Scientific), and GraphPad. Multiple sequence alignments were generated using Clustal Omega online software 57 . Chemical structures were prepared using ChemDraw (Revvity Signals Software). Reporting summary Further information on research design is available in the Nature Portfolio Reporting Summary linked to this article.
Supplementary information Supplementary Information Peer Review File Reporting Summary Source data Source Data
📊 Figures
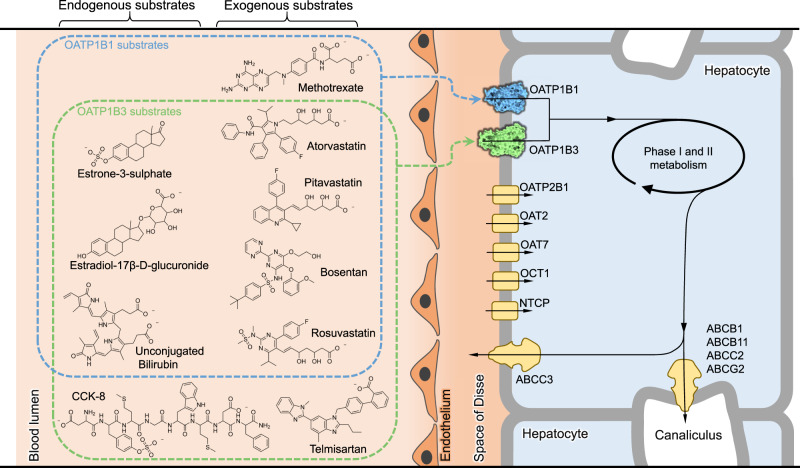
Fig. 1
Physiological role of human OATP1B1 and OATP1B3.
The schematic shows the uptake of endogenous and exogenous substrates from the blood lumen (systemic circulation) via the space of Disse into hepatocytes. Transporters in the basolateral membrane are ...
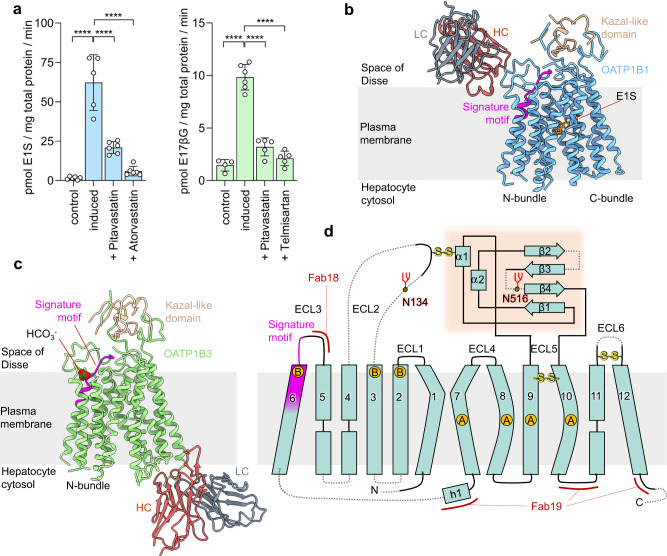
Fig. 2
Functional analysis and structures of OATP1B1 and OATP1B3.
a Cellular import of [ 3 H]-E1S mediated by OATP1B1 (blue bars) or of [ 3 H]-E17u03b2G mediated by OATP1B3 (green bars). Non-induced (control) and tetracycline-induced stable cell lines were used for ...
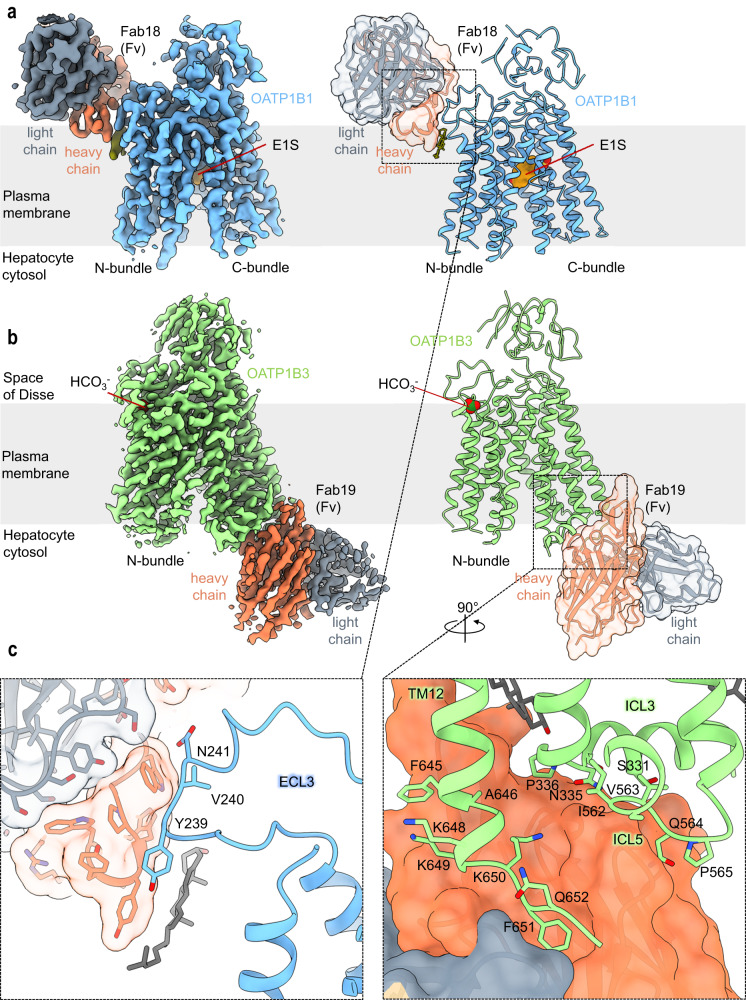
Fig. 3
Fab-fragments facilitate structural study of OATP1B1 and OATP1B3.
a EM density map (left) and ribbon representation (right) of the E1S-bound OATP1B1-Fab18 complex. Chains are colored separately and labeled. Fab fragment is also displayed as transparent surface. b EM...
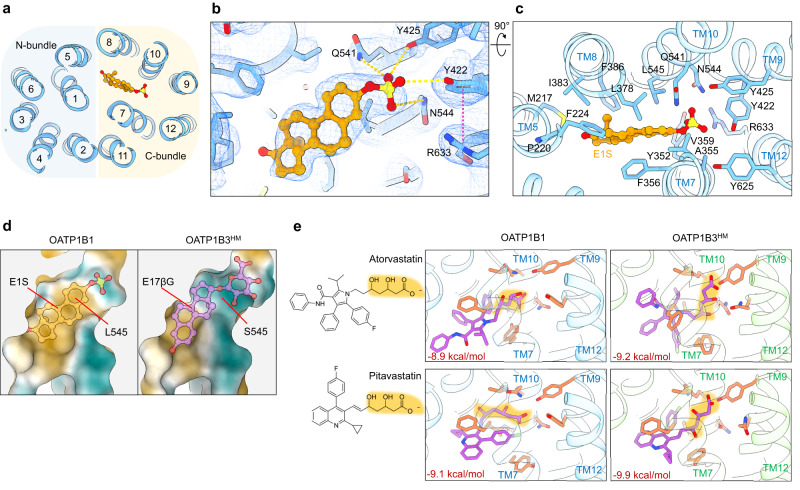
Fig. 4
Drug binding pocket and statin docking.
a Horizontal slice through a ribbon representation of E1S-bound OATP1B1, viewed from the external side, andu00a0with E1S shown as orange sticks. TM helices are numbered, and blue and yellow background...
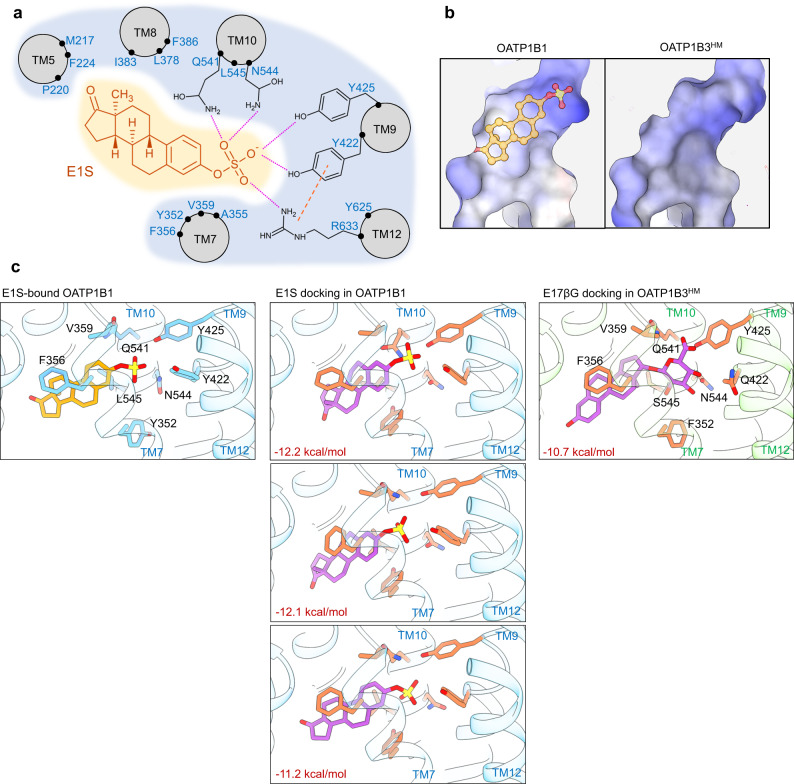
Fig. 5
Characterization of the binding pocket of OATP1B1 and OATP1B3.
a Road-kill plot presenting the interaction between bound E1S and the residues of OATP1B1. Hydrogen bonds are depicted as pink dotted lines. Cation-u03c0 interaction is shown as orange line. TM helice...
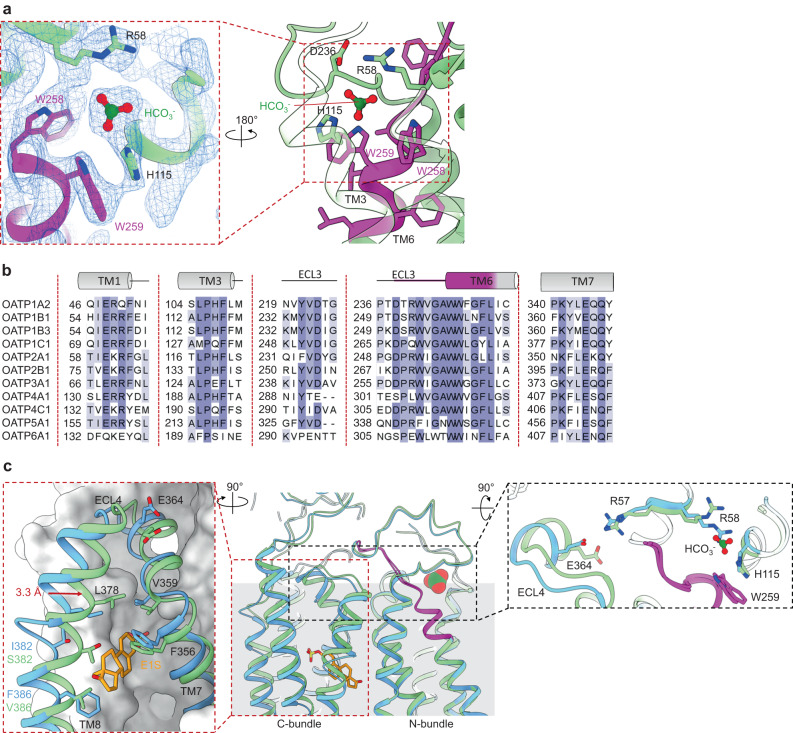
Fig. 6
Bicarbonate binding pocket and allosteric changes.
a Close-up views of the bicarbonate binding pocket in the OATP1B3 structure. Left panel depicts the EM density (blue mesh) assigned to the bicarbonate molecule. Residues in close contact with the HCO ...
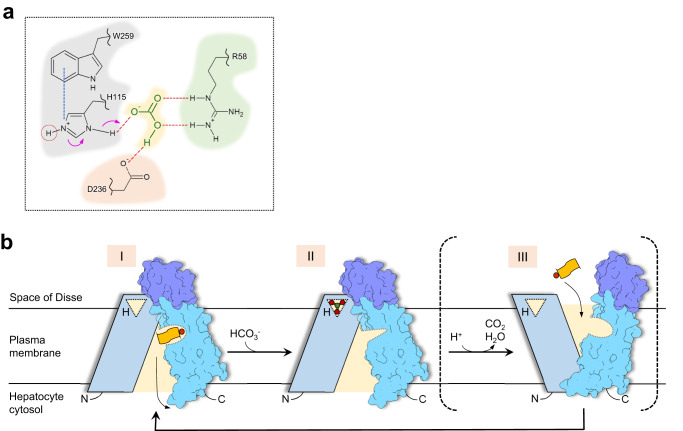
Fig. 7
Protonation-dependent transport mechanism of organic anion substrates mediated by OATP.
a Residues within the bicarbonate binding site are shown. Blue line indicates the cation-u03c0 interaction. Red lines show hydrogen bonds. Red circle indicates the hydrogen atom responsible for pH-sen...
Figure images are served from the NIH/NLM PubMed Central Open Access Subset or Europe PMC; copyright remains with the publishers and authors.
💬 Discussion
0 commentsNo comments yet. Be the first to start a discussion!
Leave a Comment