Abstract
BACKGROUND: This study evaluated the relationship between ulcerative colitis and obesity, which are both chronic diseases characterized by inflammation and increases in immune cells and pro-inflammatory cytokines. METHODS: Mice with chronic ulcerative colitis induced by 2 cycles of dextran sodium sulfate (DSS) in the first and fourth week of the experiment were fed a high-fat diet (HFD) to induce obesity by 8 weeks. The animals were divided into 4 groups (control, colitis, HFD and colitis + HFD). RESULTS: Obesity alone did not raise histopathology scores, but the combination of obesity and colitis worsened the scores in the colon compared to colitis group. Despite the reduction in weight gain, there was increased inflammatory infiltrate in both the colon and visceral adipose tissue of colitis + HFD mice due to increased infiltration of macrophages, neutrophils and lymphocytes. Intravital microscopy of VAT microvasculature showed an increase in leukocyte adhesion and rolling and overexpression of adhesion molecules compared to other groups. Moreover, circulating lymphocytes, monocytes and neutrophils in the spleen and cecal lymph nodes were increased in the colitis + HFD group. CONCLUSION: Our results demonstrated the relationship between ulcerative colitis and obesity as aggravating factors for each disease, with increased inflammation in the colon and adipose tissue and systemic alterations observed in the spleen, lymph nodes and bloodstream.
🔬 Techniques
✨ Fluorophores
🧪 Sample Preparation
🔬 Cell Lines
🏭 Microscope Brands
🧪 Reagent Suppliers
🎨 Filters
💻 Software Details
🏛️ Research Organizations (ROR)
Affiliated research institutions:
📋 Methods
Mice with chronic ulcerative colitis induced by 2 cycles of dextran sodium sulfate (DSS) in the first and fourth week of the experiment were fed a high-fat diet (HFD) to induce obesity by 8 weeks. The animals were divided into 4 groups (control, colitis, HFD and colitis + HFD).
Methods
The project was approved by the Ethics Committee for Animal Experimentation at the Federal University of Minas Gerais (CETEA/UFMG # 110/2010). Six-week-old male C57BL/6 mice were group-housed in an environment with light cycles of 12 hours (7:00 to 19:00) and controlled temperature (20 to 24°C). All mice had free access to food and water for 8 weeks. The animals were divided into the following groups: control, colitis, HFD and colitis + HFD. Animals from the control and colitis groups were fed a standard chow diet (Labina ® , 7.8% energy as fat, 50.3% in the form of carbohydrates, 41.9% protein, caloric density of 2.18 kcal/g) for 8 weeks, while mice from the HFD and Colitis + HFD groups received a high-fat diet (HFD) to induce obesity [ 42 ]. The composition of the HFD was 61% energy as fat, 24.5% carbohydrates, and 14.5% protein and had a caloric density of 5.21 kcal/g. Chronic ulcerative colitis was induced in the colitis and colitis + HFD groups by replacing drinking water with a solution of 3% (w/v) dextran sulfate sodium (DSS, 36.000 to 50.000, MP Biomedicals) for 5 days as previously described [ 9 , 43 ] at the 1 st and 4 th experimental weeks. The animals without induction of colitis (the control and HFD groups) received water throughout the experiment. At the end of the 8 th experimental week, all animals were euthanized under anesthesia after overnight fast. Blood, adipose tissue, spleens, lymph nodes and colons were removed for analysis.
Show full methods section
Mice with chronic ulcerative colitis induced by 2 cycles of dextran sodium sulfate (DSS) in the first and fourth week of the experiment were fed a high-fat diet (HFD) to induce obesity by 8 weeks. The animals were divided into 4 groups (control, colitis, HFD and colitis + HFD).
Methods
The project was approved by the Ethics Committee for Animal Experimentation at the Federal University of Minas Gerais (CETEA/UFMG # 110/2010). Six-week-old male C57BL/6 mice were group-housed in an environment with light cycles of 12 hours (7:00 to 19:00) and controlled temperature (20 to 24°C). All mice had free access to food and water for 8 weeks. The animals were divided into the following groups: control, colitis, HFD and colitis + HFD. Animals from the control and colitis groups were fed a standard chow diet (Labina ® , 7.8% energy as fat, 50.3% in the form of carbohydrates, 41.9% protein, caloric density of 2.18 kcal/g) for 8 weeks, while mice from the HFD and Colitis + HFD groups received a high-fat diet (HFD) to induce obesity [ 42 ]. The composition of the HFD was 61% energy as fat, 24.5% carbohydrates, and 14.5% protein and had a caloric density of 5.21 kcal/g. Chronic ulcerative colitis was induced in the colitis and colitis + HFD groups by replacing drinking water with a solution of 3% (w/v) dextran sulfate sodium (DSS, 36.000 to 50.000, MP Biomedicals) for 5 days as previously described [ 9 , 43 ] at the 1 st and 4 th experimental weeks. The animals without induction of colitis (the control and HFD groups) received water throughout the experiment. At the end of the 8 th experimental week, all animals were euthanized under anesthesia after overnight fast. Blood, adipose tissue, spleens, lymph nodes and colons were removed for analysis.
Blood analysis
Samples were collected without anticoagulant for lipid profiling and insulinemia analysis and with EDTA/KF for glycemia analysis. Blood glucose, total and HDL cholesterol and triglycerides were determined as previously described [ 44 ] using commercial kits (Labtest, Brazil). Non-HDL cholesterol was calculated as the difference between total cholesterol and HDL cholesterol. Insulin was measured by a radioimmunoassay kit (Millipore, USA), according to the manufacturer's instructions for the calculation of HOMA-IR and HOMA-BETA [ 45 ]. Oral glucose tolerance and insulin sensitivity tests were performed 1 and 3 days before sacrifice, respectively, as previously described [ 46 ]. The total and differential count of leukocytes were performed the day before sacrifice as described by Nowakowski et al. [ 47 ].
Histological Analysis
Colon tissue was removed and fixed in 10% formalin for 4 hours. The visceral (epididymal) adipose tissue (VAT) was removed, washed in saline solution and fixed in 10% formalin. The colon and adipose tissue were embedded in paraffin and processed into 10um histological sections and stained with hematoxylin and eosin [ 48 ]. The sections were analyzed using an optical microscope coupled to a camera to capture images with a 100x magnification and analyzed with Image Pro Plus (Media Cybernetics, MD, USA). Semi-quantitative scoring for the colon was performed as previously described [ 49 ]. The adipocyte area was calculated by the analysis of 100 adipocytes/section/per animal. The crown-like structures (CLS) were determined by the average of the number of CLS in 10 fields per mouse.
Flow Cytometry
The leukocytes in colonic lamina propria were separated as previously described [ 50 , 51 ]. Cell suspensions were incubated with appropriate antibodies (against CD4, CD8, CD69, CD25, LAP, CD21, CD19, MOMA, CD80, or GR1), fixed with formaldehyde and read in a flow cytometer (FACScan - Becton Dickinson, USA) using the CELLQuestTM program (USA). Analyses were performed with FlowJo software 7.6 (USA) in the specific quadrants for each cell type. Cytokines and chemokines by ELISA We analyzed TNFa, IFNy, IL-4, IL-6, IL-10 and MCP1/CCL2 expression in the colon. Serum leptin, adiponectin and resistin were measured by ELISA. Colons were washed with PBS, dried, weighed and homogenized with cytokine extraction solution (BSA 0.05%, aprotinin 0.02 mg/mL, benzethonium chloride 0.05 mg/mL, NaCl 0.023 mg/mL, EDTA 0.37 mg/mL, PMSF 0.02 mg/mL, 0.5 mL Tween20/PBS 1x mL) and centrifuged (10,000rpm, 10 min at 4°C). The supernatant was used for ELISA analysis, according to the manufacturer's protocol (R & D Systems). Reverse transcription polymerase chain reaction (RT-PCR) The epididymal adipose tissue was removed for evaluation of TNFa, IL-6, monocyte chemotactic protein-1 (MCP1/CCL2), serine/threonine protein kinase (AKT/PKS), glucose transporter type 4 (GLUT4), intercellular adhesion molecule 1 (ICAM-1), vascular cell adhesion protein 1 (VCAM 1), toll-like receptor 4 (TLR4), resistin, adiponectin and leptin expression. RT-PCR was also performed in colon tissue to evaluate expression of TLR4 and leptin receptor b (Ob-Rb). Samples were transferred to Trizol solution (Invitrogen, USA) for RNA extraction as described previously [ 52 ]. In animals receiving DSS, the extracted colon RNA was purified with an RNA purification kit (Qiagen, Germany), according to the manufacturer's instructions. To obtain cDNA, samples were placed in the thermocycler at 72°C for 5 min for annealing and 42°C for 3 h and 72°C for 15 min for transcription. Real-time semi-quantitative PCR was performed using Power SYBR MasterMix (AppliedBiosystems, Foster City, California, USA) and specific primers (Table 2 ) in an ABI 7900 HT Fast Real-Time PCR System (Applied Biosystems). PCR reactions were initiated with a 2 minute incubation at 95 °C, followed by 35 cycles at 95 °C for 15 seconds and at 60°C for 60 seconds. The results were normalized to β-actin expression and are expressed as the fold increase compared to the control [ 52 ]. Table 2 List of used primers Foward Reverse Leptina 5CCTGTCGCTTTGGTCCTATCTG3' 5'AGGCAAGCTGGTGAGGATCTG3' Adiponectina 5'AGGTTGGATGGCAGGC3' 5'GTCTCACCCTTAGGACCAAGAA3' Resistina 5'AGACTGCTGTGCCTTCTGGG3' 5'CCCTCCTTTTCCTTTTCTTCCTTG3' TNFα 5'CGTCGTAGCAAACCACCAAG3' 5'GAGATAGCAAATCGGCTGACG3' IL6 5'ACAACCACGGCCTTCCCTACTT3' 5'CACGATTTCCCAGAGAACATGTG3' MCP1 5'CCACTCACCTGCTGCTACTACT3' 5'TGGTGATCCTCTAGCTCTCC3' GLUT4 5'CTGCAAAGC GTAGGTACCAA3' 5'CCTCCCGCCCTTAGTTG3' AKT 5'GGCAGGAAGAAGAGACGATGG3' 5'CCATCTCTTCAGCCCCTGAG3' VCAM 5'CCTCACTTGCAGCACTACGGGC3' 5'TTTTCCAATATCCTCAATGACGGG3' ICAM 5'TGCGTTTTGGAGCTAGCGGACCA3' 5'CGAGGACCATACAGCAGCTGCAG3' TLR4 5'TGACAGGAAACCCTATCCAGAGT3 5'TCTCCACAGCCACCAGATTCT3' Ob-Rb 5'GTG TGA GCA TCT CTC CTG GAG3' 5 ACC ACA CCA GAC CCT GAA AG3' β-actina 5'CTGCCTGACCAAGTC3' 5'CAAGAAGGAAGGCTGGAAAGG A3' Intravital microscopy Intravital microscopy was performed in the epididymal adipose tissue and colon microvasculature. Mice were anesthetized with 10 mg/kg xylazine and 100 mg/kg ketamine hydrochloride, injected i.p. The right jugular vein was cannulated, and rhodamine 6G (Sigma, St. Louis, MO, USA) was injected intravenously (i.v.; 0.15 mg/kg) to visualize the leukocyte/endothelial cell interactions. Rhodamine epi-illumination was achieved with a 150 W variable HBO mercury lamp in conjunction with a Zeiss filter set 15 (546/12 nm band-pass filter, 580 nm Fourier transforms, 590 nm late potentials; Zeiss, Wetzlar, Germany). Microscopic images were captured using a Nikon Eclipse 50i (Nikon Instruments Inc., Japan) microscope (x20 objective) with a video camera (5100 HS; Panasonic, Secaucus, NJ) and consecutive digital recordings using both filters. Data analysis was performed off-line. Rolling leukocytes were defined as those cells moving slower than the cells at a regular flux in a given vessel. The flux of rolling cells was measured as the number of rolling cells passing by a given point in the venule per minute, with results expressed as cells/minute. A leukocyte was considered to be adherent if it remained stationary for at least 30 s, and total leukocyte adhesion was quantified as the number of adherent cells within a 100 μm length of venule, with results expressed as cells/100 μm [ 53 ].
Statistical Analysis
The results were evaluated for normal distribution by the Kolmogorov-Smirnov test, and outliers were identified by the Grubbs and Box-Plot tests. A one-way ANOVA followed by a Newman-Keuls multiple comparison test was used for normally distributed data, and the Kruskal-Wallis test followed by Dunn's multiple comparison test were used for non-parametric data. The results are expressed as the mean ± standard error. Statistical analysis was performed using GraphPad Prism 5.0 software, (USA) with a significance level of 5% (p < 0.05).
Supplementary Material Additional file 1 Parameters of lipid profile, glucose homeostasis, intravital microscopy of the colonic microvasculature . Parameters of lipid profile, glucose homeostasis, intravital microscopy of the colonic microvasculature (rolling and adherent cells) of control and HFD groups (receiving standard chow or HFD, respectively) or colitis and colitis + HFD groups (receiving the respective diets and treated with 2 cycles of DSS [3%] to induce ulcerative colitis). Click here for file Additional file 2 Profile of immune cells in blood, spleen and lymph node . Profile of immune cells in blood, spleen and lymph node of control and HFD groups (receiving standard chow or HFD, respectively) or colitis and colitis + HFD groups (receiving the respective diets and treated with 2 cycles of DSS [3%] to induce ulcerative colitis). Click here for file Additional file 3 Intravital microscopy in control adipose tissue . Intravital microscopy performed in adipose tissue microvasculature of group Control. Click here for file Additional file 4 Intravital microscopy in colitis adipose tissue . Intravital microscopy performed in adipose tissue microvasculature of group Colitis. Click here for file Additional file 5 Intravital microscopy in HFD adipose tissue . Intravital microscopy performed in adipose tissue microvasculature of group HFD. Click here for file Additional file 6 Intravital microscopy in colitis + HFD adipose tissue . Intravital microscopy performed in adipose tissue microvasculature of group colitis + HFD, showing an increase of rolling and adherent leukocyte compared to control. Click here for file
📊 Figures
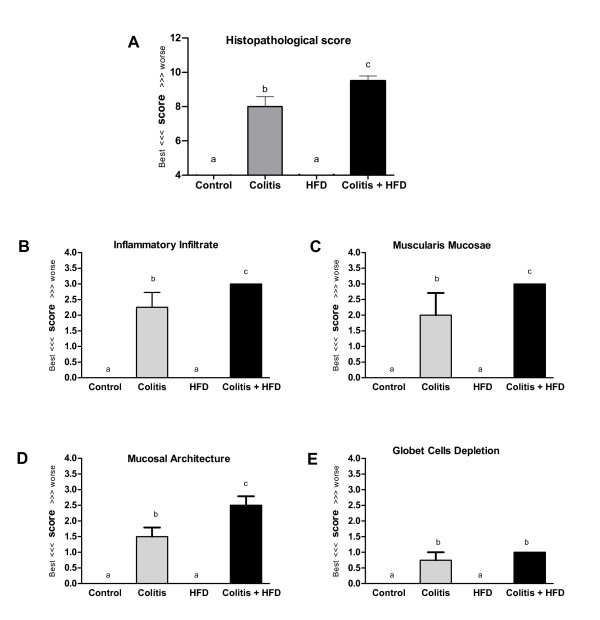
Figure 1
Histopathological scores (A) and components: inflammatory infiltrate (B), muscularis mucosa thickness (C), mucosa general architecture (D) and goblet cell depletion (E) of mice from control and HFD gr...
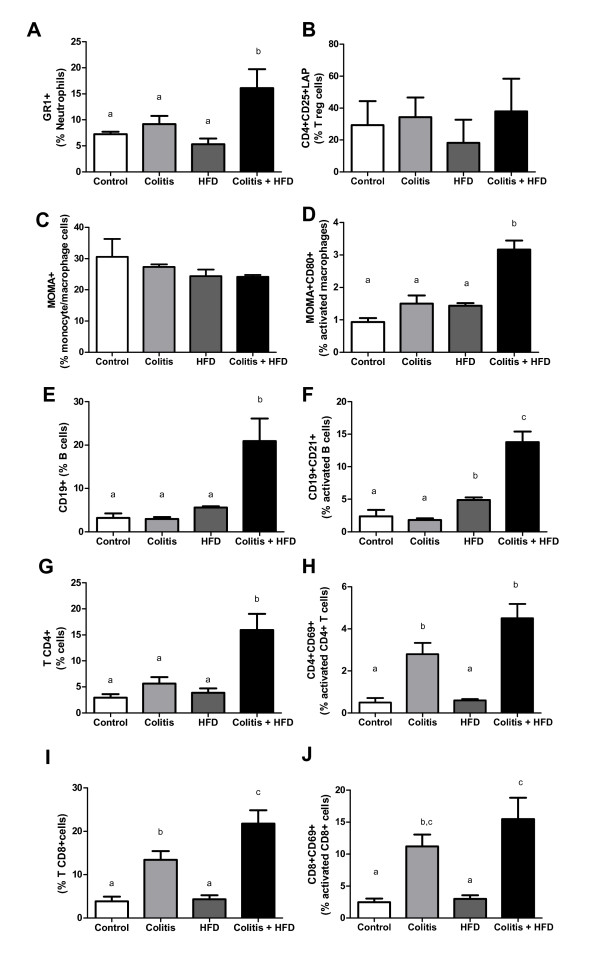
Figure 2
Percentage of leukocyte subtypes in the colon lamina propria . Neutrophils (A), regulatory T lymphocytes (B), total macrophages and monocytes (C), activated macrophages (D), B lymphocytes (E), activat...
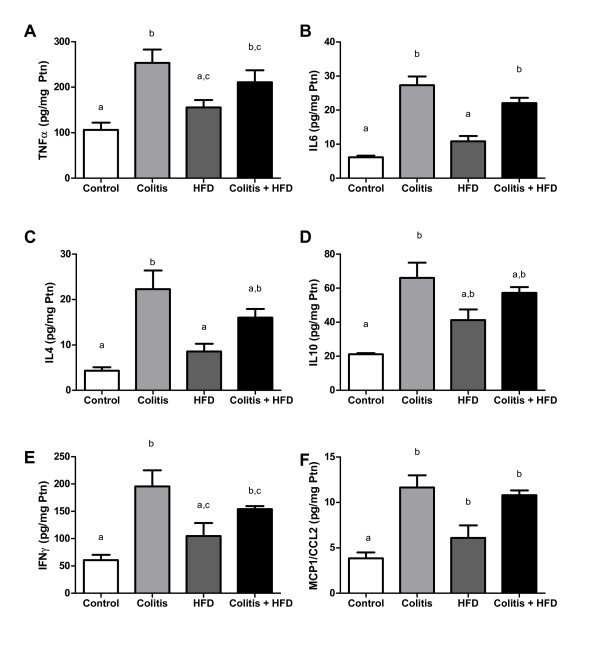
Figure 3
Lamina propria cytokine and chemokine concentrations . TNFa (A), IL6 (B), IL4 (C), IL10 (D), IFN-y (E) and MCP1/CCL2 (F) of mice from control and HFD groups (receiving standard chow or HFD, respective...
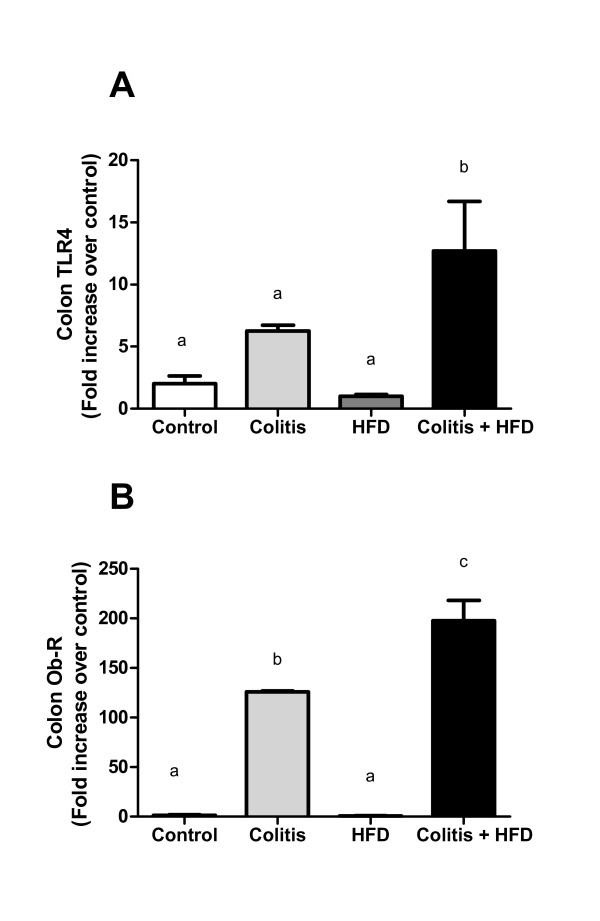
Figure 4
Expression of TLR4 (A) and Ob-R (B) in the colon mucosa of mice from control and HFD groups (receiving standard chow or HFD, respectively) or colitis and colitis + HFD groups (receiving the respective...
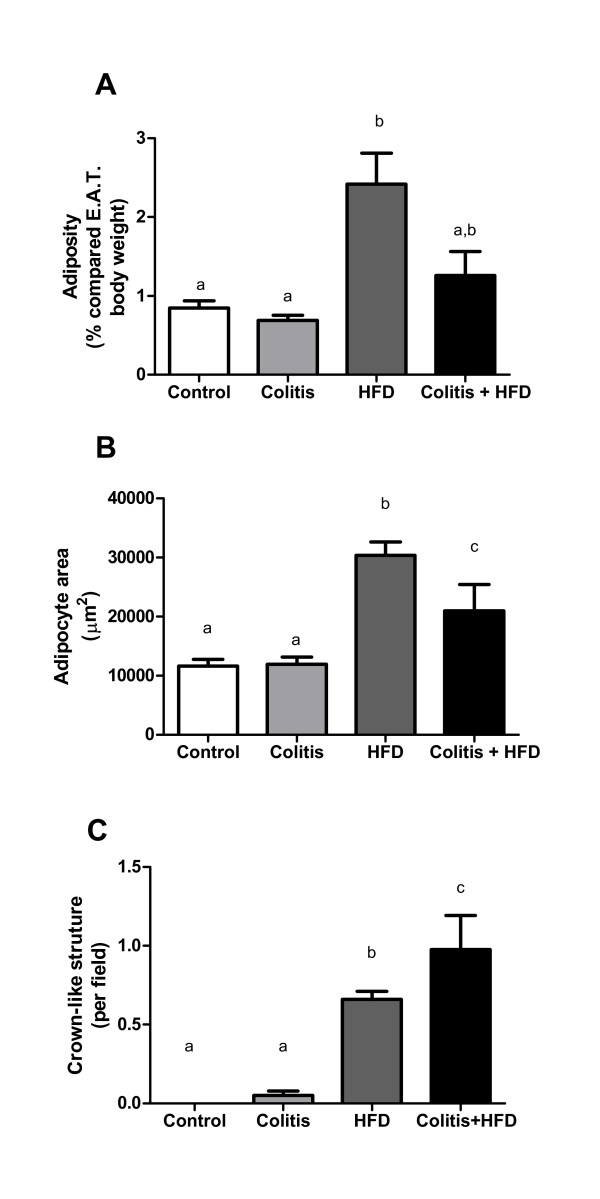
Figure 5
Percentage of epididymal adipose tissue in relation to body (A), adipocyte area (B) and average of number of crown-like structures (C) of mice from control and HFD groups (receiving standard chow or H...
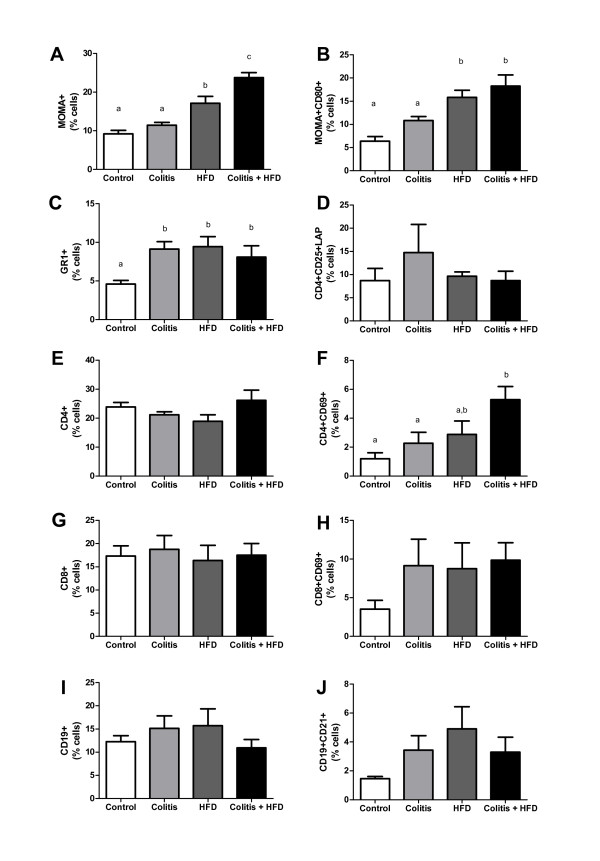
Figure 6
Macrophages and monocytes (A), activated macrophages (B), neutrophils (C), regulatory T lymphocytes (D), total (E) and activated (F) CD4+ T cells, total (G) and activated (H) CD8+ T cells, total (I) ...
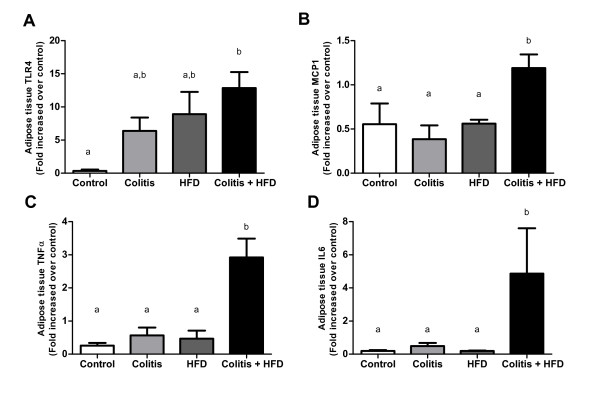
Figure 7
Expression of TLR4 (A), MCP1/CCL2 (B), TNFu03b1 (C) and IL6 (D) in adipose tissue of mice from control and HFD groups (receiving standard chow or HFD, respectively) or colitis and colitis + HFD groups...
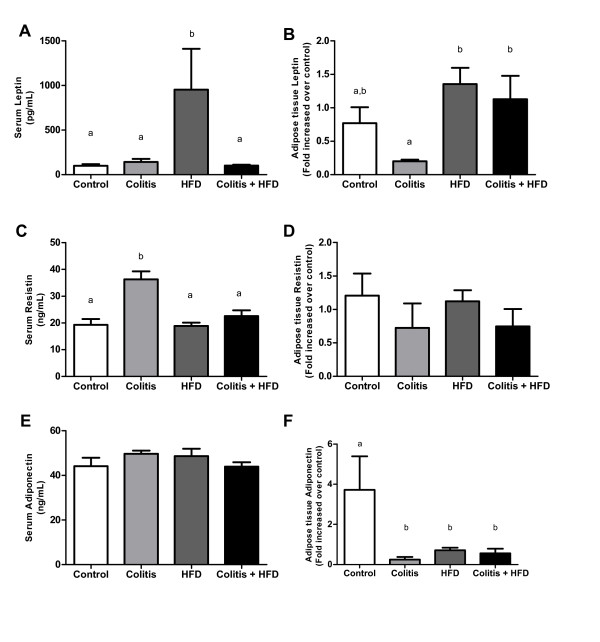
Figure 8
Serum levels and adipose tissue expression of leptin (A, B), resistin (C,D) and adiponectin (E,F) of mice from control and HFD groups (receiving standard chow or HFD, respectively) or colitis and coli...
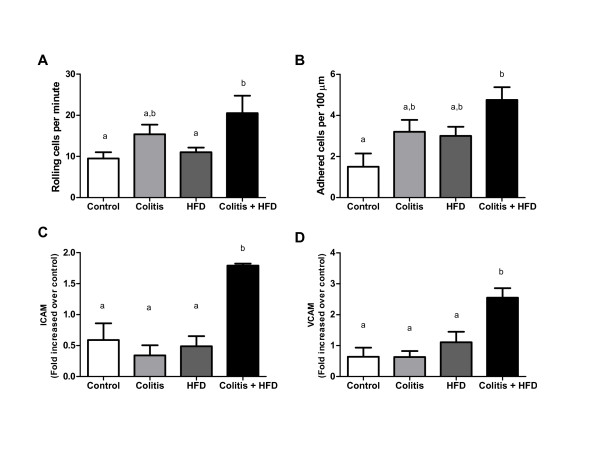
Figure 9
Intravital microscopy showing the rolling (A) and adhesion (B) of leukocytes on microvasculature of epididymal adipose tissue and ICAM (C) and VCAM-1 (D) expression in control and HFD groups (receivin...
Figure images are served from the NIH/NLM PubMed Central Open Access Subset or Europe PMC; copyright remains with the publishers and authors.
💬 Discussion
0 commentsNo comments yet. Be the first to start a discussion!
Leave a Comment