Abstract
Developing thymocytes are screened for self-reactivity before they exit the thymus, but how thymocytes scan the medulla for self antigens is unclear. Using two-photon microscopy, we observed that medullary thymocytes migrated rapidly and made frequent, transient contacts with dendritic cells. In the presence of a negative selecting ligand, thymocytes slowed, became confined to areas of approximately 30 microm in diameter and had increased contact with dendritic cells surrounding confinement zones. One third of polyclonal medullary thymocytes also showed confined, slower migration and may correspond to autoreactive thymocytes. Our data suggest that many autoreactive thymocytes do not undergo immediate arrest and death after encountering a negative selecting ligand but instead adopt an altered migration program while remaining in the medullary microenvironment.
🔬 Techniques
💻 Software
✨ Fluorophores
🧪 Sample Preparation
🔬 Cell Lines
🏭 Microscope Brands
🧪 Reagent Suppliers
🔴 Lasers
🎨 Filters
💻 Software Details
🏛️ Research Organizations (ROR)
Affiliated research institutions:
📋 Methods
Mice
All mice were housed and bred in pathogen-free conditions at the AALAC approved animal facility at Life Sciences Addition of University of California, Berkeley. All animal experiments were approved by the Animal Care and Use Committee of UC Berkeley. C57BL/6 (B6) mice (Jackson Labs) were crossed to CD11c-YFP transgenic mice on a B6 background 20 for use as neonatal hosts to generate partial hematopoietic chimeras as described previously 18 , 23 . RIPmOVA transgenic mice on a B6 background 25 , provided by Mark Anderson (UCSF), were crossed to CD11c-YFP mice for use as neonatal hosts in some experiments. BM donors were either UBI-GFP transgenic mice 40 , or UBI-GFP mice crossed several times to OT1 TCR transgenic Rag2 − / − mice (Taconic) or P14 TCR transgenic Rag2 − / − mice (Taconic). In addition, OT1 TCR, UBI-GFP double transgenic Rag2 −/− mice were crossed to CD11c-DTR mice to make OT1 TCR, UBI-GFP, CD11cDTR triple transgenic Rag2 −/− donors. Co-chimeras were generated using actin-CFP transgenic B6 donors 22 . MHC-I −/− ( β2microglobulin −/− ) and MHC-II −/− ( H2-Aβ −/− ) mice (Taconic) were used as neonatal hosts. OT1 Rag2 −/− mice crossed to RIPmOVA mice were used to generate OT1 + Rag2 −/− RIPmOVA + mice. Foxp3-GFP transgenic mice 31 were purchased from Jackson Labs. Two-Photon Imaging At 4 to 6 weeks of age, chimeric mice were injected via tail vein with 100–200 μg of lectin-Texas Red (Vector Labs) just prior to sacrifice 19 . Cut thymic lobe preparations presented here are based on the modification of a previously described protocol 17 . Briefly, individual thymic lobes were embedded in low-melting-temperature agarose and sectioned with a Vibratome in two halves along the sagittal plane. Intact thymic lobes or cut thymic lobes were imaged by Two-Photon Laser Scanning Microscopy while being perfused with warmed, oxygenated medium as described previously 19 . Imaging volumes of 171 × 143 × 60–80 μm 3 were scanned every 25 seconds for 15–30 minutes using a custom-built microscope with a Spectra-Physics MaiTai Laser tuned to 900nm for excitation of CFP, GFP, and YFP and TexRed and separation of emission spectra using and 495nm, 510nm and 560nm dichroics as well as 450/80nm and 645/75nm band-pass filters (Chroma). The imaging volumes were at least 30 μm under the cut site for cut thymuses or 80 μm under the surface of the capsule for intact thymic lobes. Individual imaging volumes were assigned to cortex or medulla based on the density of DCs and the location and orientation of large blood vessels at the cortico-medullary junction. Imaging volumes where this assignment was ambiguous were excluded from the analysis. For the chimeras using MHC-I and MHC-II deficient hosts, in which DCs were not labeled, the medulla was identified based exclusively on the blood vessel pattern.
Show full methods section
Mice
All mice were housed and bred in pathogen-free conditions at the AALAC approved animal facility at Life Sciences Addition of University of California, Berkeley. All animal experiments were approved by the Animal Care and Use Committee of UC Berkeley. C57BL/6 (B6) mice (Jackson Labs) were crossed to CD11c-YFP transgenic mice on a B6 background 20 for use as neonatal hosts to generate partial hematopoietic chimeras as described previously 18 , 23 . RIPmOVA transgenic mice on a B6 background 25 , provided by Mark Anderson (UCSF), were crossed to CD11c-YFP mice for use as neonatal hosts in some experiments. BM donors were either UBI-GFP transgenic mice 40 , or UBI-GFP mice crossed several times to OT1 TCR transgenic Rag2 − / − mice (Taconic) or P14 TCR transgenic Rag2 − / − mice (Taconic). In addition, OT1 TCR, UBI-GFP double transgenic Rag2 −/− mice were crossed to CD11c-DTR mice to make OT1 TCR, UBI-GFP, CD11cDTR triple transgenic Rag2 −/− donors. Co-chimeras were generated using actin-CFP transgenic B6 donors 22 . MHC-I −/− ( β2microglobulin −/− ) and MHC-II −/− ( H2-Aβ −/− ) mice (Taconic) were used as neonatal hosts. OT1 Rag2 −/− mice crossed to RIPmOVA mice were used to generate OT1 + Rag2 −/− RIPmOVA + mice. Foxp3-GFP transgenic mice 31 were purchased from Jackson Labs. Two-Photon Imaging At 4 to 6 weeks of age, chimeric mice were injected via tail vein with 100–200 μg of lectin-Texas Red (Vector Labs) just prior to sacrifice 19 . Cut thymic lobe preparations presented here are based on the modification of a previously described protocol 17 . Briefly, individual thymic lobes were embedded in low-melting-temperature agarose and sectioned with a Vibratome in two halves along the sagittal plane. Intact thymic lobes or cut thymic lobes were imaged by Two-Photon Laser Scanning Microscopy while being perfused with warmed, oxygenated medium as described previously 19 . Imaging volumes of 171 × 143 × 60–80 μm 3 were scanned every 25 seconds for 15–30 minutes using a custom-built microscope with a Spectra-Physics MaiTai Laser tuned to 900nm for excitation of CFP, GFP, and YFP and TexRed and separation of emission spectra using and 495nm, 510nm and 560nm dichroics as well as 450/80nm and 645/75nm band-pass filters (Chroma). The imaging volumes were at least 30 μm under the cut site for cut thymuses or 80 μm under the surface of the capsule for intact thymic lobes. Individual imaging volumes were assigned to cortex or medulla based on the density of DCs and the location and orientation of large blood vessels at the cortico-medullary junction. Imaging volumes where this assignment was ambiguous were excluded from the analysis. For the chimeras using MHC-I and MHC-II deficient hosts, in which DCs were not labeled, the medulla was identified based exclusively on the blood vessel pattern.
Data Analysis
The x,y,z co-ordinates of individual thymocytes over time were obtained using Imaris Bitplane Software and motility parameters were calculated using MATLAB (Mathworks Inc., Boston; code available upon request), and graphed using GraphPad Prism. Speed was defined as pathlength divided by time (μm/min). Straightness ratio was defined as the maximum displacement divided by the total length of the path. Random walk analysis for each imaging volume was performed by plotting the average displacement from origin of the thymocytes in the volume against the square root of time 14 . The slope of the linear part of the plot corresponds to the motility coefficient, and was determined by linear regression analysis using GraphPad Prism data analysis software. The confinement distance was determined by visually identifying the plateau value. The first order rate constant for cells leaving confinement zones (k=0.0069, corresponding to a half-life of 100 minutes or 1.7 hours) was estimated based on a first-order rate equation -d[cells]/dt = k [cells], where -d[cells] = 6 (cells that left zones), dt = 13 minutes (average track duration) and [cells] = 67 (number of tracked cells in zones). For manual scoring of thymocyte-DC interactions, individual thymocytes tracks were inspected in 3D space at each time point by an unbiased observer and scored for time points in which visible contacts with DCs occurred 19 .
Statistical Analysis GraphPad
Prism was used for graphing and statistical analysis. Unpaired t-tests were performed to compare the means of different data sets, except for paired data sets (e.g. samples from the same imaging volume), for which a pairwise t-test was used Antibodies and flow cytometry OT1 + Rag2 −/− and OT1 + Rag2 −/− RIPmOVA + littermates were sacrificed at 4 week old. Thymocytes were stained with different combinations of the following antibodies (Abs): anti-CD8-FITC, -PECy5 or -PECy7 (clone 53–6.7); anti-Vα2 TCR-PE or – APC (clone b20.1); anti-CD4-PE-TxRed (clone RM4–5); anti-CD24-PE (clone M1/69) Abs (BD Biosciences and eBioscience). In some cases, cells were then fixed, permeabilized, and stained for active-caspase 3 as previously described 28 . Cell events were collected with a Beckman-Coulter FC-500 flow cytometer and analyzed with FlowJo software (Tree Star Inc.).
Supplementary Material 1 2 3 4 5 6 7 8 9
📊 Figures
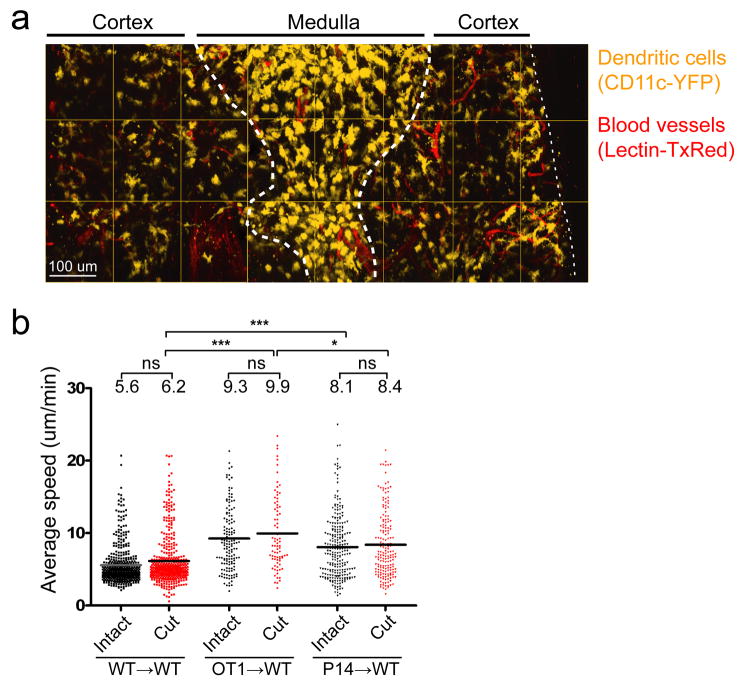
Figure 1
Sectioning the thymus facilitates imaging of the medulla
a. The thymus of a CD11c-YFP + mouse, injected with lectin-Texas Red before sacrifice to label blood vessels, was cut and imaged by two-photon microscopy. Image shows a montage of maximal projections ...
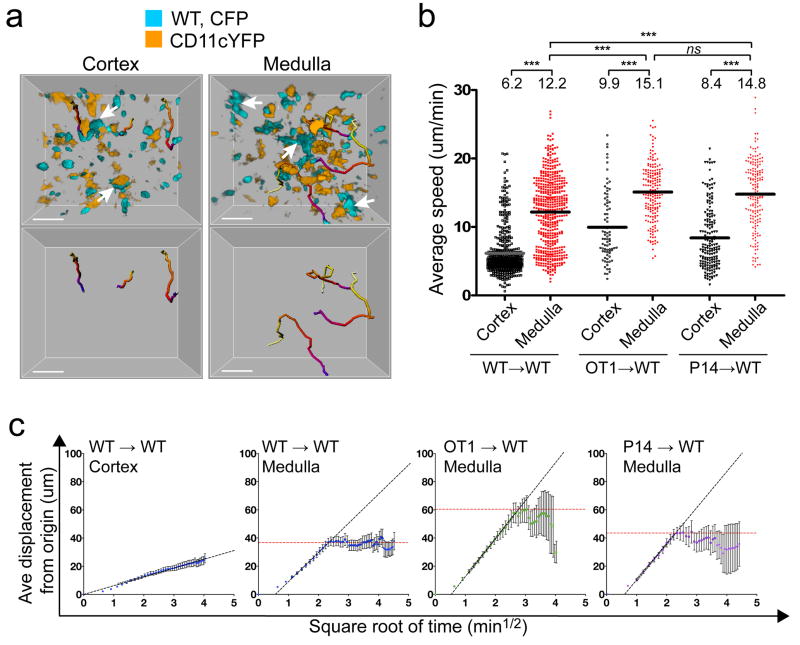
Figure 2
Thymocyte migration in the medulla is rapid and confined
a. Representative stills of two-photon imaging volumes in the cortex or the medulla of a cut thymic lobe with WT CFP-labeled thymocytes and CD11c-YFP + DCs. Three representative tracks with the durati...
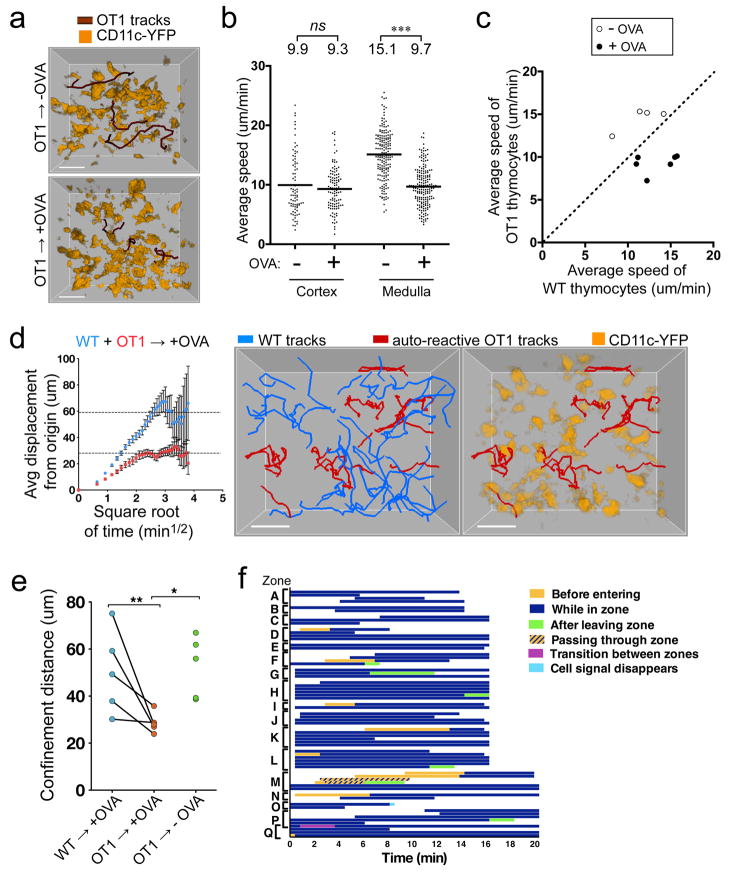
Figure 3
The impact of negative selection on thymocyte migration
a. Two-photon imaging volumes in the medulla show CD11c-YFP + cells and 3 representative OT1 thymocyte tracks with durations of 12.5 min in hosts without or with OVA. Scale bar indicates 30 u03bcm. b....
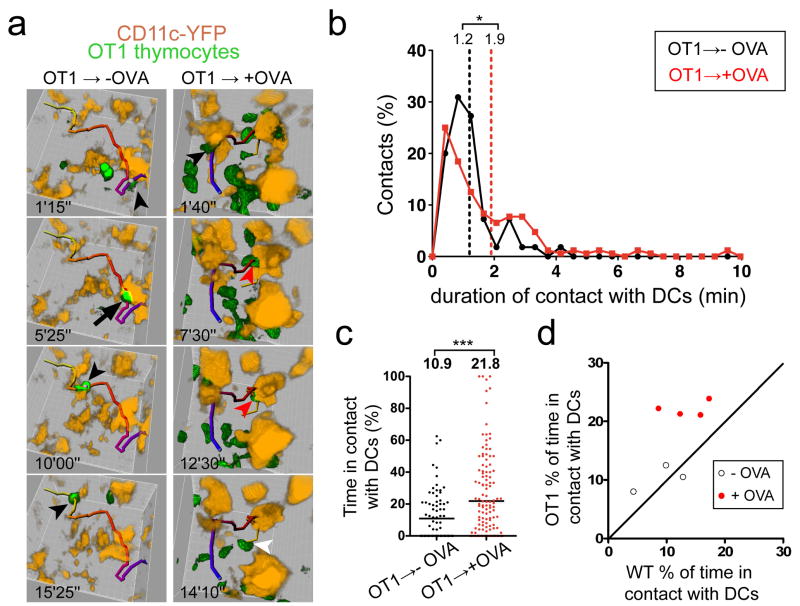
Figure 4
Increased thymocyte-DC interactions during negative selection
a. Examples of OT1 GFP thymocytes that make successive interactions with CD11c-YFP + DCs in hosts in the presence or absence of OVA. Thymocyte tracks are color-coded to indicate the passage of time (b...
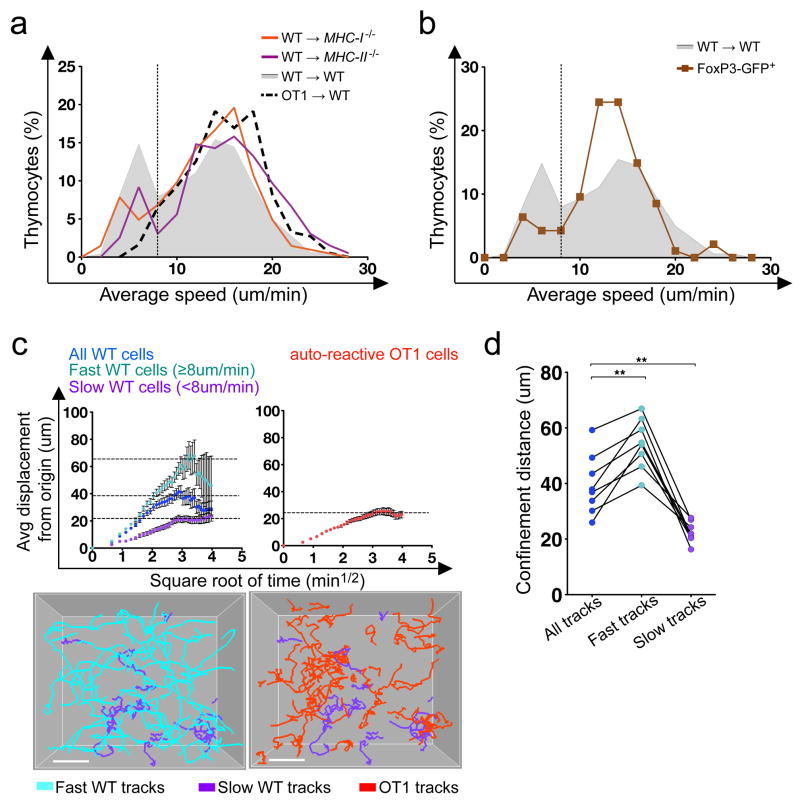
Figure 5
A subset of polyclonal medullary thymocytes exhibits slower, more confined migration
au2013b. Relative frequency distribution of average speeds of medullary thymocytes from indicated chimeras ( a,b ) or of GFP + thymocytes in Foxp3-GFP reporter mice ( b ). The differences between the ...
Figure images are served from the NIH/NLM PubMed Central Open Access Subset or Europe PMC; copyright remains with the publishers and authors.
💬 Discussion
0 commentsNo comments yet. Be the first to start a discussion!
Leave a Comment