Abstract
The mouse hippocampal cell line HT22 is an excellent model for studying the consequences of endogenous oxidative stress. Addition of extracellular glutamate depletes the cells of glutathione (GSH) by blocking the glutamate-cystine antiporter system x(c)(-). GSH is the main antioxidant in neurons and its depletion induces a well-defined program of cell death called oxytosis, which is probably synonymous with the iron-dependent form of non-apoptotic cell death termed ferroptosis. Oxytosis is characterized by an increase of reactive oxygen species and a strong calcium influx preceding cell death. We found a significant reduction in store-operated calcium entry (SOCE) in glutamate-resistant HT22 cells caused by downregulation of the Ca(2+) channel ORAI1, but not the Ca(2+) sensors STIM1 or STIM2. Pharmacological inhibition of SOCE mimicked this protection similarly to knockdown of ORAI1 by small interfering RNAs. Long-term calcium live-cell imaging after induction of the cell death program showed a specific reduction in Ca(2+)-positive cells by ORAI1 knockdown. These results suggest that dysregulated Ca(2+) entry through ORAI1 mediates the detrimental Ca(2+) entry in programmed cell death induced by GSH depletion. As this detrimental Ca(2+) influx occurs late in the course of the cell death program, it might be amenable to therapeutic intervention in diseases caused by oxidative stress.
🔬 Techniques
✨ Fluorophores
🧪 Sample Preparation
🏭 Microscope Brands
🧪 Reagent Suppliers
💻 Software Details
🏛️ Research Organizations (ROR)
Affiliated research institutions:
📋 Methods
Cell culture
The glutamate-resistant HT22R cell line was generated from the parental mouse hippocampal cell line HT22 as previously described. 19 Both cells lines, HT22S and HT22R, were cultured in DMEM high glucose (PAA Laboratories, Pasching, Austria ) supplemented with 5% fetal calf serum (Thermo Fisher Scientific, Waltham, MA, USA) and 100 U per ml penicillin and 100 μg per ml streptomycin (Gibco, Darmstadt, Germany) in a humidified incubator with 5% CO 2 and 95% air.
Cell survival assays
HT22 cells were seeded in 96-well plates at a density of 5000 cells/well and 24 h later subjected to cell death experiments. siRNA-transfected cells were seeded 24 h post transfection. Pharmacological agents were added together with, or at specified time periods after, induction of cell death by the indicated drugs. Cell viability was quantified 16–24 h after stress onset with the cell titer blue (CTB) reagent (Promega, Madison, WI, USA). Alternatively, in some experiments, the 3-(4,5-Dimethylthiazol-2-yl)-2,5-diphenyltetrazolium bromide (MTT) assay was used. 19 For CTB fluorescence, emission was measured at 590 nm after excitation at 562 nm using a GENios Pro microplate reader (Tecan, Männedorf, Switzerland); for the MTT-assay, absorption was measured at 570 nm. Calcium live-cell imaging Fura2 Ca 2+ imaging experiments were performed on a BD Pathway 855 High Content Imaging System (BD Biosciences, Heidelberg, Germany). The cells were seeded in 96-well imaging plate (BD Bioscience) the day before the experiment in a density of 5000 cells/well and loaded with 5 μℳ Fura2-AM (Molecular Probes, Darmstadt, Germany) in HBSS for 30 min before the experiment. Measurement was performed with excitation at 340 and 380 nm for ratiometric analysis and pictures were taken with a delay of 5 s. For comparison of SOCE in HT22S and HT22R, cells were seeded on 12 mm coverslips at a density of 100 000/well, loaded with Fura2-AM and placed into a flow chamber. The measurement was performed using an Olympus IX81 fluorescence microscope with the cell^R imaging software. Images were acquired at 340 and 380 nm excitation and the ratio was calculated every 5 s for every single cell. After 1 min of baseline recording, ER-calcium stores were depleted in EGTA buffer (Ca 2+ -free HBSS supplemented with 0.5 mℳ EGTA, 20 mℳ HEPES, 1 mℳ MgCl 2 and 1 g per l Glucose) with 2 μ ℳ thapsigargin for 6 min and subsequently Ca 2+ was readded by changing the buffer to HBSS.
Show full methods section
Cell culture
The glutamate-resistant HT22R cell line was generated from the parental mouse hippocampal cell line HT22 as previously described. 19 Both cells lines, HT22S and HT22R, were cultured in DMEM high glucose (PAA Laboratories, Pasching, Austria ) supplemented with 5% fetal calf serum (Thermo Fisher Scientific, Waltham, MA, USA) and 100 U per ml penicillin and 100 μg per ml streptomycin (Gibco, Darmstadt, Germany) in a humidified incubator with 5% CO 2 and 95% air.
Cell survival assays
HT22 cells were seeded in 96-well plates at a density of 5000 cells/well and 24 h later subjected to cell death experiments. siRNA-transfected cells were seeded 24 h post transfection. Pharmacological agents were added together with, or at specified time periods after, induction of cell death by the indicated drugs. Cell viability was quantified 16–24 h after stress onset with the cell titer blue (CTB) reagent (Promega, Madison, WI, USA). Alternatively, in some experiments, the 3-(4,5-Dimethylthiazol-2-yl)-2,5-diphenyltetrazolium bromide (MTT) assay was used. 19 For CTB fluorescence, emission was measured at 590 nm after excitation at 562 nm using a GENios Pro microplate reader (Tecan, Männedorf, Switzerland); for the MTT-assay, absorption was measured at 570 nm. Calcium live-cell imaging Fura2 Ca 2+ imaging experiments were performed on a BD Pathway 855 High Content Imaging System (BD Biosciences, Heidelberg, Germany). The cells were seeded in 96-well imaging plate (BD Bioscience) the day before the experiment in a density of 5000 cells/well and loaded with 5 μℳ Fura2-AM (Molecular Probes, Darmstadt, Germany) in HBSS for 30 min before the experiment. Measurement was performed with excitation at 340 and 380 nm for ratiometric analysis and pictures were taken with a delay of 5 s. For comparison of SOCE in HT22S and HT22R, cells were seeded on 12 mm coverslips at a density of 100 000/well, loaded with Fura2-AM and placed into a flow chamber. The measurement was performed using an Olympus IX81 fluorescence microscope with the cell^R imaging software. Images were acquired at 340 and 380 nm excitation and the ratio was calculated every 5 s for every single cell. After 1 min of baseline recording, ER-calcium stores were depleted in EGTA buffer (Ca 2+ -free HBSS supplemented with 0.5 mℳ EGTA, 20 mℳ HEPES, 1 mℳ MgCl 2 and 1 g per l Glucose) with 2 μ ℳ thapsigargin for 6 min and subsequently Ca 2+ was readded by changing the buffer to HBSS.
Electrophysiology
We used whole-cell patch clamping to measure currents through ion channels of single cells. Whole-cell recordings were performed using an Axopatch 200B patch clamp amplifier (Axon Instruments, Sunnyvale, CA, USA) and digitized with Digidata 1332 (Axon Instruments). For SOC channels recordings the pipette solution contained (in mℳ) 120 CsCl, 5 Bapta-Na, 30 Cs-HEPES pH 7.3, 1.5 MgCl 2 , 4 Na 2 ATP, 0.4 Na 2 GTP and 1.6 CaCl 2 (pCa 7.0). Extracellular solution contained (in mℳ) 140 NMDG-Asp, 10 BaCl 2 , 10 Cs-HEPES, pH 7.3. During recording the currents were sampled at 5 kHz and filtered digitally at 500 Hz, the pClamp9 software (Axon Instruments) was used for data acquisition and analysis. In all whole-cell experiments the holding potential was −40 mV, periodically (once every 5 s) the membrane potential was stepped to −100 mV (for 30 ms) and a 200 ms voltage ramp to +100 mV was applied. Currents were evoked by application of 1 μ ℳ thapsigargin (Sigma, Munich, Germany) in external solution, which was added to the bath perfusion. The traces recorded before current activation were used as templates for leak subtraction. Whole-cell currents were normalized to the cell capacitance. The mean value of cell capacitance was 19 pF±5 (total number of experiments n =20).
Quantitative RT-PCR Whole-cellular
RNA was isolated using ZR RNA MiniPrep Kit (Zymo, Irvine, CA, USA) and transcribed into cDNA with the High Capacity cDNA Reverse Transcription Kit (Applied Biosystems, Darmstadt, Germany). RT-PCR analysis was performed on a 7500 Fast cycler (Applied Biosystems) with FAST BLUE qPCR MasterMix (Eurogentec, Cologne, Germany) running the 7500 standard program. Primers and Probes for STIM1 and 2, ORAI1 and TRPM7 were designed by the universal probe library assay design center (Roche, Mannheim, Germany) and the hypoxanthine-phosphoribosyltransferase gene ( HPRT ) served as an endogenous control with individually designed primers and probe purchased from MWG (Ebersberg, Germany). siRNA transfections Flexitube siRNAs against ORAI1, STIM1, STIM2 and TRPM7 were purchased from Qiagen (Hilden, Germany) (no.SI00972251, no.SI00972272, no.SI1435623, no.SI1435637, no.SI01435665, no.SI01435672, no.SI02694727 and no.SI02742663) and transfected into cells with Lipofectamine RNAiMAX (Invitrogen, Darmstadt, Germany) when cells were grown to 70–80% confluence in six-well plates. Successful knockdown was verified by RT-PCR or immunoblot.
Immunoblotting
Cells were lysed in ice-cold RIPA buffer (Thermo Fisher Scientific) containing mini complete protease inhibitor cocktail (Roche) and centrifuged for 30 min at 16 000 g. The supernatants were separated on 8–16% polyacrylamide gels (Thermo Fisher Scientific), transferred onto nitrocellulose membranes with the iBlot System (Invitrogen, Darmstadt, Germany) and blocked in 3% nonfat dry milk in phosphate-buffered saline containing 0.5% Tween-20 (PBS-T) for 1 h at room temperature before overnight incubation with primary antibodies against STIM1 (BD Biosciences, no.610955 1 : 250), STIM2 (Cell Signaling, Danvers, MA, USA, no.4917 1 : 1000), ORAI1, Alomone Jerusalem, Israel, no.ACC-062 1 : 500), Actin (Millipore, Billerica, MA, USA, no.MAB1501 1 : 5000) or GAPDH (Cell Signaling, no.2118 1 : 5000) followed by α -mouse (respectively rabbit) IgG (Fc) infrared fluorescence−conjugated secondary antibody (Licor, Lincoln, NE, USA, 1 : 30 000). The membranes were scanned for infrared fluorescence at 680 or 800 nm using the Odyssey system (Licor) and the signal was analyzed quantitatively with the image-processing software ImageJ ( http://rsbweb.nih.gov/ij/ ).
Long-term calcium live-cell imaging
GCaMP5 was a kind gift of Douglas S. Kim (Howard Hughes Medical Institute, Ashburn) and subcloned with EcoRI and NotI into the IRES-RFP-containing vector PB531A-1 (System Biosciences, Mountain View, CA, USA). Cells were transfected with GCaMP5-IRES-RFP together with two different siRNAs against ORAI1 or non-targeting control-siRNA with Lipofectamine 2000 (Invitrogen) in six-well plates and 24 h later transferred to 96-well imaging plates (BD Biosciences) at a density of 5000 cells/well. For calcium imaging, phenol red containing medium was replaced by colorless DMEM (PAA Laboratories, Pasching, Austria). Two hours before the onset of measurement, 25 mℳ glutamate was added to the cells, control wells were supplemented with vehicle and the plate was incubated in the BD Pathway 855 at 37 °C with 5% CO2 and 95% air. For pCPT-cGMP-induced Ca 2+ influx, measurement was started immediately after addition of 2.5 mℳ pCPT-cGMP. Cytosolic calcium was monitored by GCaMP5 and normalized to RFP fluorescence; pictures were taken every 15 min. For analysis of glutamate-induced Ca 2+ peaks, the maximal ratio was divided by the average ratio and a threshold was defined by the mean of control-siRNA transfected cells. Every cell above that threshold was counted as Ca 2+ peak positive. For analysis of pCPT-cGMP-induced Ca 2+ influx, the slope of Ca 2+ increase was calculated over the first 2 h of the measurement.
Statistical analysis
Data were analyzed as mean±S.E.M. and the statistical significance assessed using two-tailed t -tests or analysis of variance (ANOVA) with Tukey's Multiple Comparison Test as indicated.
📊 Figures
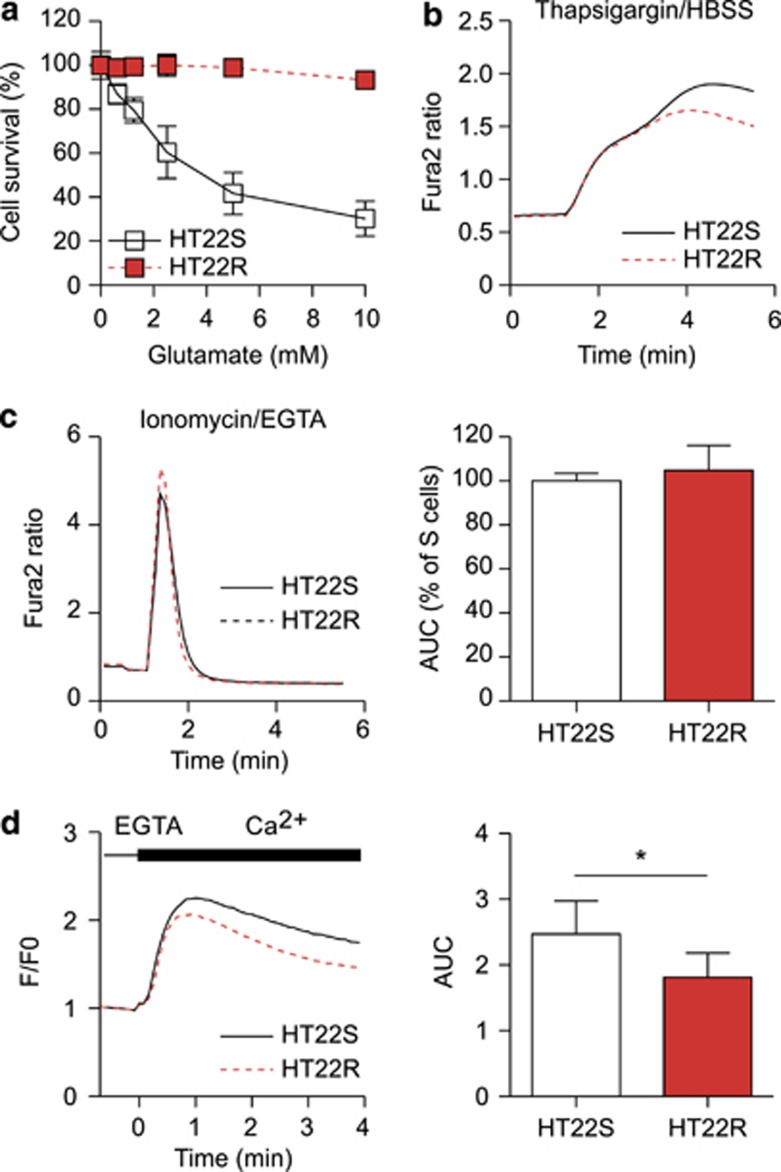
Figure 1
Reduced store-operated Ca 2+ in hippocampal cells resistant to oxidative stress. ( a ) 5000 glutamate-sensitive and -resistant HT22S and R cells were seeded into 96-well plates and subjected to the in...
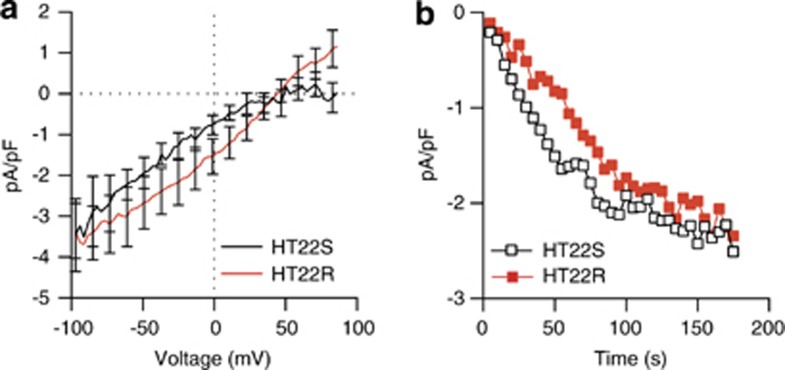
Figure 2
Different SOCE current characteristics in HT22S and glutamate-resistant HT22R cells. ( a ) Average I/V relationships for currents evoked by passive depletion of Ca 2+ stores with 1u2009u03bcu2133 thap...
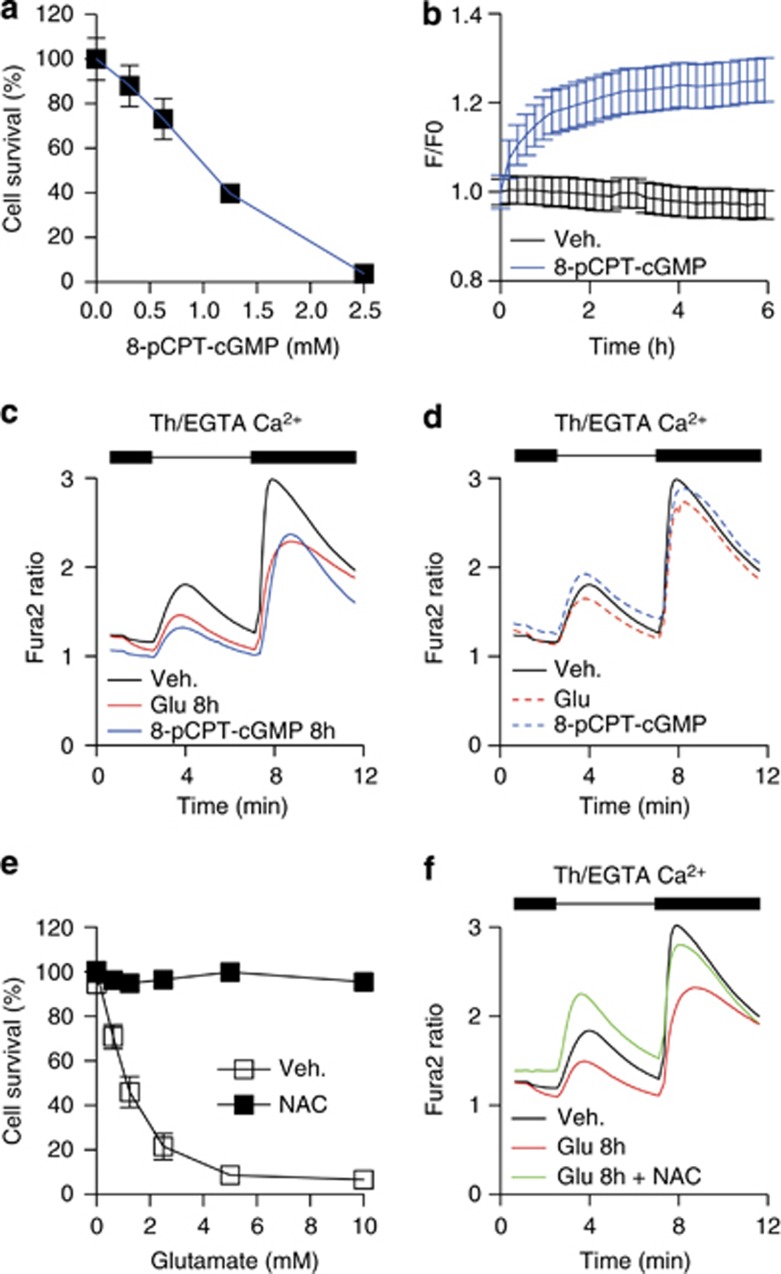
Figure 3
Prolonged oxidative stress reduces the ER Ca 2+ content and SOCE activity. ( a ) Application of pCPT-cGMP-induces cell death in HT22 cells. Cells were subjected to the indicated concentrations of pCPT...
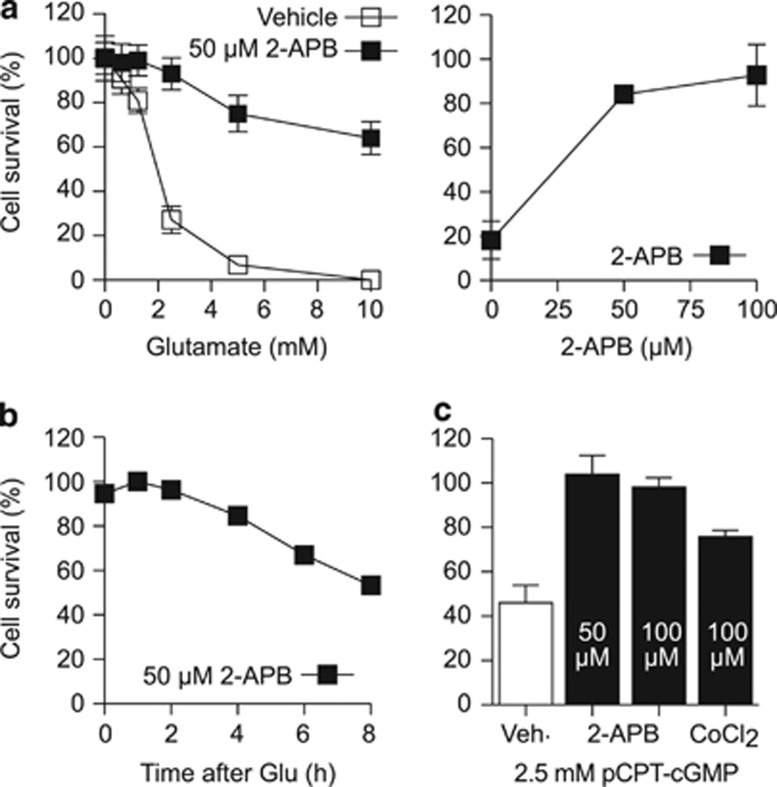
Figure 4
Pharmacological inhibition of SOCE protects against oxidative stress. ( a ) 2-APB or vehicle treated HT22S cells were subjected to oxidative stress by addition of the indicated amounts of glutamate. 1...
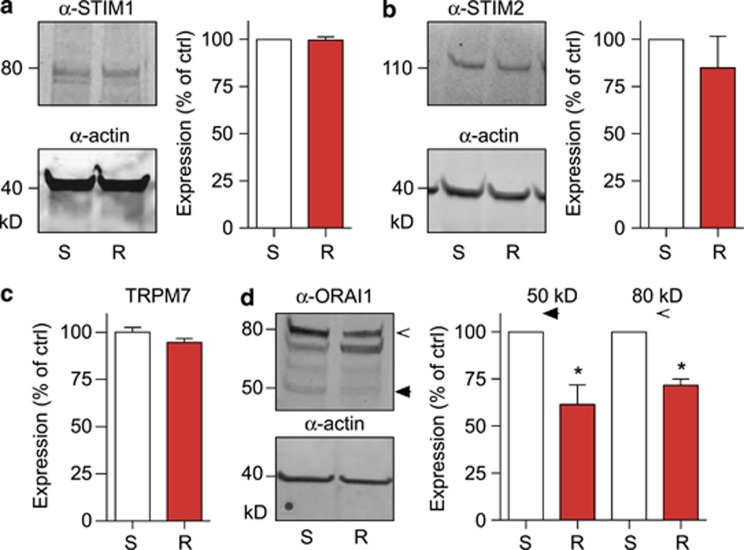
Figure 5
The SOCE Ca 2+ influx channel ORAI1 is downregulated in glutamate-resistant HT22R cells. Expression analysis of key SOCE players and TRPM7 in HT22S and R cells. (a, b and d) Immunoblots were probed wi...
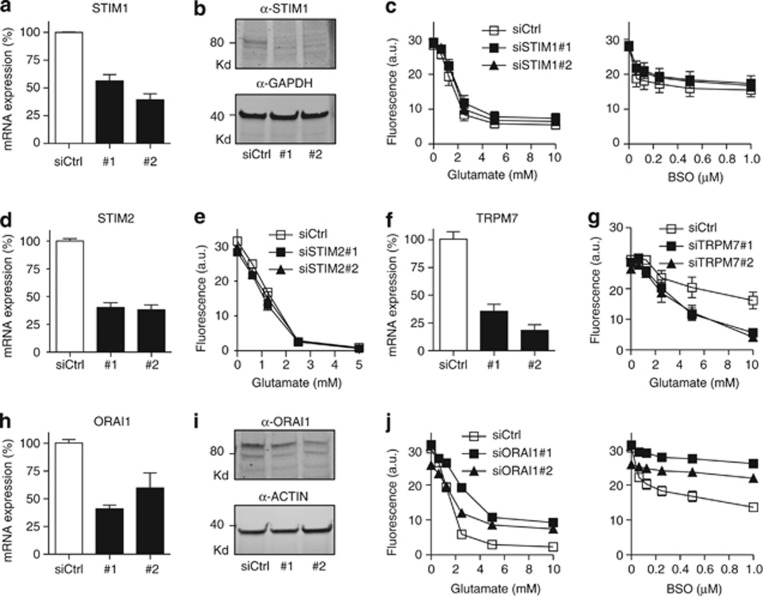
Figure 6
Knockdown of ORAI1 protects from GSH depletion. HT22S cells were transfected with two independent siRNAs against STIM1, STIM2, ORAI1 and TRPM7 or with non-targeting control siRNA and 48u2009h later su...
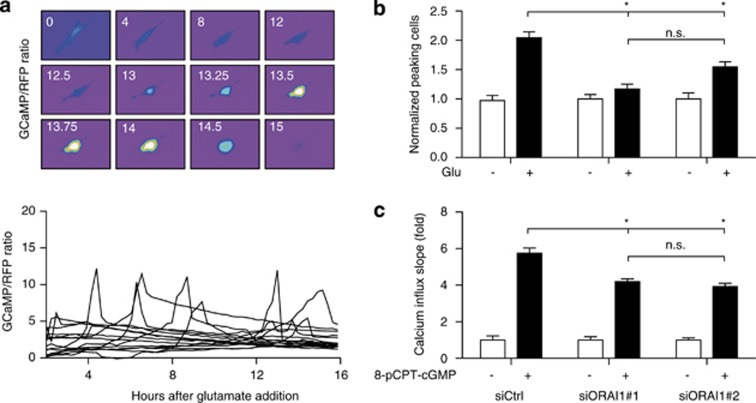
Figure 7
Knockdown of ORAI1 inhibits cytosolic calcium elevation during oxytosis. HT22S cells were transfected with two different siRNAs against ORAI1 or non-targeting siRNA as control together with a plasmid ...
Figure images are served from the NIH/NLM PubMed Central Open Access Subset or Europe PMC; copyright remains with the publishers and authors.
💬 Discussion
0 commentsNo comments yet. Be the first to start a discussion!
Leave a Comment