Abstract
Microtubules form from longitudinally and laterally assembling tubulin α-β dimers. The assembly induces strain in tubulin, resulting in cycles of microtubule catastrophe and regrowth. This 'dynamic instability' is governed by GTP hydrolysis that renders the microtubule lattice unstable, but it is unclear how. We used a human microtubule nucleating and stabilizing neuronal protein, doublecortin, and high-resolution cryo-EM to capture tubulin's elusive hydrolysis intermediate GDP•Pi state, alongside the prehydrolysis analog GMPCPP state and the posthydrolysis GDP state with and without an anticancer drug, Taxol. GTP hydrolysis to GDP•Pi followed by Pi release constitutes two distinct structural transitions, causing unevenly distributed compressions of tubulin dimers, thereby tightening longitudinal and loosening lateral interdimer contacts. We conclude that microtubule catastrophe is triggered because the lateral contacts can no longer counteract the strain energy stored in the lattice, while reinforcement of the longitudinal contacts may support generation of force.
🔬 Techniques
🧬 Organisms
💻 Software
✨ Fluorophores
🏭 Microscope Brands
🧪 Reagent Suppliers
💻 Software Details
💾 Data Repositories
🏛️ Research Organizations (ROR)
Affiliated research institutions:
📋 Methods
Protein preparation
Human doublecortin isoform 2 (DCX, residues 1-360) was cloned into pNic28Bsa4 vector (Structural Genomics Consortium, Oxford, UK), which adds a tobacco etch virus (TEV) protease-cleavable N-terminal His tag to the protein. After expression in BL21 Star (DE3) E. coli cells (Invitrogen), the cells were sonicated in the lysis buffer (50 mM Na 2 HPO 4 pH 7.2, 300 mM NaCl, 10 mM imidazole, 10% glycerol, 2 mM DTT) supplemented with protease inhibitor cocktail (cOmplete Cocktail Tablet, Roche/Sigma Aldrich), and the lysates were clarified by centrifugation. Clear lysates were passed through nickel HisTrap HP column (GE Healthcare) and His-DCX was eluted with 10-250 mM imidazole gradient. To remove the His tag from the DCX protein, we used a His-tagged TEV protease expressed in-house and then removed both His-TEV and the cleaved tag by a passage through nickel beads (GE Healthcare). DCX was then captured on a HiTrap SP HP ion exchange column (GE Healthcare) equilibrated in BRB80 buffer (80 mM PIPES [piperazine-N,N′-bis(2-ethanesulfonic acid)] pH 6.8, 1 mM EGTA [ethylene glycol-bis(β-aminoethyl ether)-N,N,N',N'-tetraacetic acid], 1 mM MgCl 2 , 1 mM DTT [dithiotreitol]) and eluted with NaCl gradient (15-300 mM). DCX was then finally purified and desalted by gel filtration through Superdex 200 size exclusion column (GE Healthcare) equilibrated in the BRB80 buffer. Lyophilised bovine brain tubulin was purchased from Cytoskeleton and reconstituted to 100 μM concentration in BRB80 supplemented with either 1 mM GTP for dynamic MTs (GTP-tubulin) or one of the nucleotide analogues: GMPCPP [Guanosine-5'-[(α,β)-methyleno]triphosphate] (Jena Biosciences) (GMPCPP-tubulin) or GTPγS [Guanosine 5'-O-(3-thiotriphosphate)] (Roche) (GTPγS-tubulin).
Show full methods section
Protein preparation
Human doublecortin isoform 2 (DCX, residues 1-360) was cloned into pNic28Bsa4 vector (Structural Genomics Consortium, Oxford, UK), which adds a tobacco etch virus (TEV) protease-cleavable N-terminal His tag to the protein. After expression in BL21 Star (DE3) E. coli cells (Invitrogen), the cells were sonicated in the lysis buffer (50 mM Na 2 HPO 4 pH 7.2, 300 mM NaCl, 10 mM imidazole, 10% glycerol, 2 mM DTT) supplemented with protease inhibitor cocktail (cOmplete Cocktail Tablet, Roche/Sigma Aldrich), and the lysates were clarified by centrifugation. Clear lysates were passed through nickel HisTrap HP column (GE Healthcare) and His-DCX was eluted with 10-250 mM imidazole gradient. To remove the His tag from the DCX protein, we used a His-tagged TEV protease expressed in-house and then removed both His-TEV and the cleaved tag by a passage through nickel beads (GE Healthcare). DCX was then captured on a HiTrap SP HP ion exchange column (GE Healthcare) equilibrated in BRB80 buffer (80 mM PIPES [piperazine-N,N′-bis(2-ethanesulfonic acid)] pH 6.8, 1 mM EGTA [ethylene glycol-bis(β-aminoethyl ether)-N,N,N',N'-tetraacetic acid], 1 mM MgCl 2 , 1 mM DTT [dithiotreitol]) and eluted with NaCl gradient (15-300 mM). DCX was then finally purified and desalted by gel filtration through Superdex 200 size exclusion column (GE Healthcare) equilibrated in the BRB80 buffer. Lyophilised bovine brain tubulin was purchased from Cytoskeleton and reconstituted to 100 μM concentration in BRB80 supplemented with either 1 mM GTP for dynamic MTs (GTP-tubulin) or one of the nucleotide analogues: GMPCPP [Guanosine-5'-[(α,β)-methyleno]triphosphate] (Jena Biosciences) (GMPCPP-tubulin) or GTPγS [Guanosine 5'-O-(3-thiotriphosphate)] (Roche) (GTPγS-tubulin).
Preparation of cryo-EM samples
To obtain GMPCPP-DCX-MTs with high GMPCPP occupancy, 30 μM GMPCPP-tubulin was cycled twice through: 30 min polymerization at 37 °C in BRB80 buffer containing 1 mM GMPCPP, pelleting and depolymerisation in cold buffer. In the third polymerisation round, 5 μM GMPCPP-tubulin was co-polymerised with 3.5 μM DCX under the same conditions. This polymerisation strategy was required to obtain a fully extended 13-PF MT lattice. GTPγS does not nucleate MTs, hence it cannot be enriched in the lattice through tubulin polymerisation and depolymerisation cycles and its occupancy is not known. For GTPγS-DCX-MTs 5 μM GTPγS-tubulin was co-polymerised for 30 min with 3.5 μM DCX at 37 °C in BRB80 buffer containing 2 mM GTPγS. For GDP-DCX-MTs 5 μM GTP-tubulin was co-polymerised for 30 min with 3.5 μM DCX at 37 °C in BRB80 buffer containing 1 mM GTP. For GDP-DCX-Taxol®-MTs 1 mM Taxol® was added after 30 min of polymerisation and the sample was incubated for further 30 min at 37 °C. In all the above MT preparations, sub-stoichiometric concentration of DCX versus tubulin was used to nucleate MTs with a desired 13-PF architecture, while keeping MT bundling minimal. These MTs were applied directly to glow-discharged Lacey grids (Agar) and incubated for 30 sec at room temperature. Then the grids were briefly blotted and 50 μM DCX solution in BRB80 buffer was added to maximise MT decoration with DCX. The grids were then transferred to Vitrobot (FEI/Thermo Fisher Scientific) and incubated there for 1 min at 30 °C and 95 % humidity, before finally blotting and plunge freezing in liquid ethane. For GDP.Pi-DCX-MTs 10 μM GTP-tubulin was mixed with 50 μM DCX in cold BRB80 buffer containing 1 mM GTP and immediately applied to a glow-discharged Lacey grid for rapid polymerisation directly on the grid inside the Vitrobot set to 30 °C and 95 % humidity. After 30 sec incubation the grid was blotted and vitrified as before.
Cryo-EM data collection
Micrographs were acquired on a 300 kV Polara microscope (FEI) combined with a K2 Summit camera (Gatan) operated in counting mode after energy filter with a 20 eV slit. The magnification at the specimen plane was 35,971x resulting in a pixel size of 1.39 Å. The dose rate was ~5 e-/pixel/sec, corresponding to ~2.6 e-/Å 2 /sec. The total dose on the specimen was ~23.4 e- collected over 9 sec exposures fractionated into 36 movie frames (0.25 sec/frame). We used SerialEM software ( http://bio3d.colorado.edu/SerialEM/ ) to manually collect exposures with -0.4 to -2.5 μm defocus range.
Image processing and 3D reconstruction
We used MotionCor2 36 to globally and locally (25 tiles/image) align movie frames. Using EMAN 1 Boxer 37 we picked MT segments from these drift-corrected image sums. Boxes of 652 x 652 pixel size spanned ~11 tubulin dimers and were cut along MTs with ~8 dimer overlap. These segments were subsequently treated as single particle input to Chuff 38 , 39 , a custom-designed multi-script processing pipeline using Spider 40 and Frealign 41 . The initial seam finding alignment was done in Spider by projection matching to a synthetic 13-PF DCX-MT reference filtered to 30 Å. The contrast transfer function (CTF) parameters were estimated with CTFFIND3 42 , and the CTF correction was performed during local refinement within Frealign, producing isotropic 3D reconstructions with pseudo-helical symmetry applied 12 times. Independently processed half maps were combined in Relion 1.4 43 and subjected to its standard post-processing routine, involving: (1) estimation of map resolution based on Fourier Shell Correlation (FSC) between the two half maps, (2) computation of the average B-factor based on Guinier plot using the EMBfactor program 44 , and (3) map sharpening using the computed B-factor value. The resolutions of the final maps were estimated using 0.143 FSC cut-off criterion and the absence of over-fitting was confirmed with high-resolution noise substitution test 35 ( Table 1 , FSC true ). Side chains of acidic residues are mostly missing, likely due to their exceptional susceptibility to radiation damage, unless they are stabilised by an interaction (e.g. D177 H-bonding with GMPCPP, Fig. 1c ). Reconstructions using data collected with the first 4 e- did not recover these vulnerable side chains.
Atomic model refinement
We used a high-resolution cryo-EM 6 GDP-tubulin dimer model (PDB code: 3JAR 10 , devoid of EB3 chains) as a starting point for refinement in all of our cryo-EM density maps. Nucleotides were substituted as necessary with structures downloaded from the Grade Server ( http://grade.globalphasing.org/cgi-bin/grade/server.cgi ) and DCX density was masked away and excluded from the refinements by zoning maps around tubulin structures in UCSF Chimera 45 . Each isolated map was placed in a new unit cell with P1 space group. Ten macro-cycles of refinements in real space were carried out at each round using phenix.real_space_refine ( http://phenix-online.org/ ) with default settings (Ramachandran plot, C-beta deviations, rotamer and secondary structure restraints). Non-crystallographic symmetry (NCS) group definitions were manually provided as constraints for the related tubulin chains. The program automatically determined weight between data and the restraints to achieve RMS deviations for covalent bonds not greater then 0.01, and for angles not greater than 1.0. Model geometry was evaluated by MolProbity 46 after each round of refinement, and problematic regions in the models were manually corrected in Coot 47 . This process was repeated for every structure until satisfactory level of model:map agreement with excellent model stereochemistry were accomplished ( Table 1 ).
Estimation of PF skew in different MT lattices
We calculated the average difference between the assigned ϕ-angles (rotation angle around MT axis) of the consecutive DCX-MT segments cut along individual MTs in each lattice state. These individual values of skew were then averaged over > 50 MTs per lattice state ( Supplementary Fig. 6 ). To determine statistical significance between the means we used one-way analysis of statistical variance (ANOVA), since standard deviations across all datasets were not significantly different by both Brow-Forsythe and Bartlett’s tests, according to Prism 6 ( graphpad.com ). The degree of freedom within each group (residual) amounted to 355 and between the groups to 4, resulting in the F ratio of 68.67 and the significance level (P value) of < 0.0001.
Estimation of DCX occupancy in different
MT lattices A Fourier-transformed image of any DCX-MT shows a ~1/4 nm layer line corresponding to ~4 nm tubulin subunit repeat and an ~1/8 nm layer line corresponding to ~8 nm DCX repeat. To estimate the relative DCX occupancy in each lattice state we averaged power spectra of all the DMX-MT segments in a given state using EMAN 37 and calculated intensities of the 1/8 nm layer lines in relation to the 1/4 nm layer lines. To calculate the error of that ratio for each lattice state we divided each dataset into 3 approximately equal subsets and calculated the average ratio and its standard deviation ( Supplementary Fig. 1b ).
Figure and video preparation
Molecular visualisations in all figures and videos ( Supplementary Information ) were prepared using UCSF Chimera 45 .
Data availability
Our maps and coordinates were deposited in EMDB/PDB with the following accession codes: GMPCPP-DCX-MT, EMD-3961 and PDB ID 6EVW; GDP.Pi-DCX-MT, EMD-3962 and PDB ID 6EVX; GTPγS-DCX-MT, EMD-3963 and PDB ID 6EVY; GDP-DCX-MT, EMD-3964 and PDB ID 6EVZ; GDP-DCX-Taxol®-MT, EMD-3965 and PDB ID 6EW0.
Supplementary Material Supplementary Figures Supplementary Table 1 Supplementary Video 1 Supplementary Video 2 Supplementary Video 3 Supplementary Video 4
📊 Figures
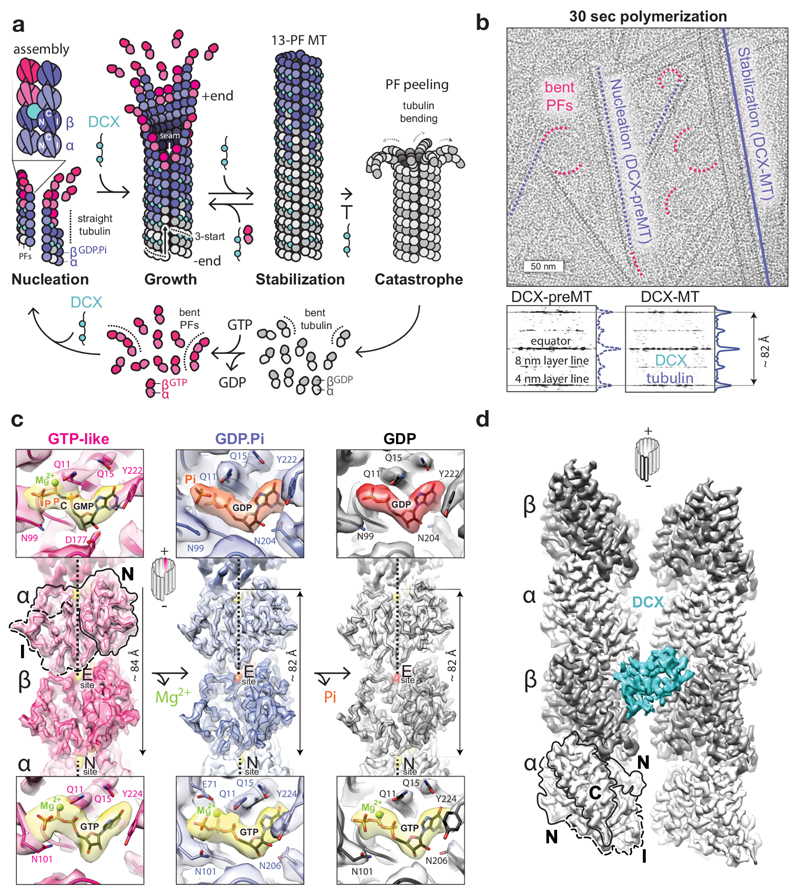
Figure 1
Tubulin GTPase cycle and MT structures stabilised by DCX.
a , DCX binds between 4 tubulin dimers, nucleating and stabilizing 13-PF 3-start MTs. In its absence, MTs undergo catastrophe once GTP hydrolysis and Pi release outpace MT growth. Then tubulin bends, ...
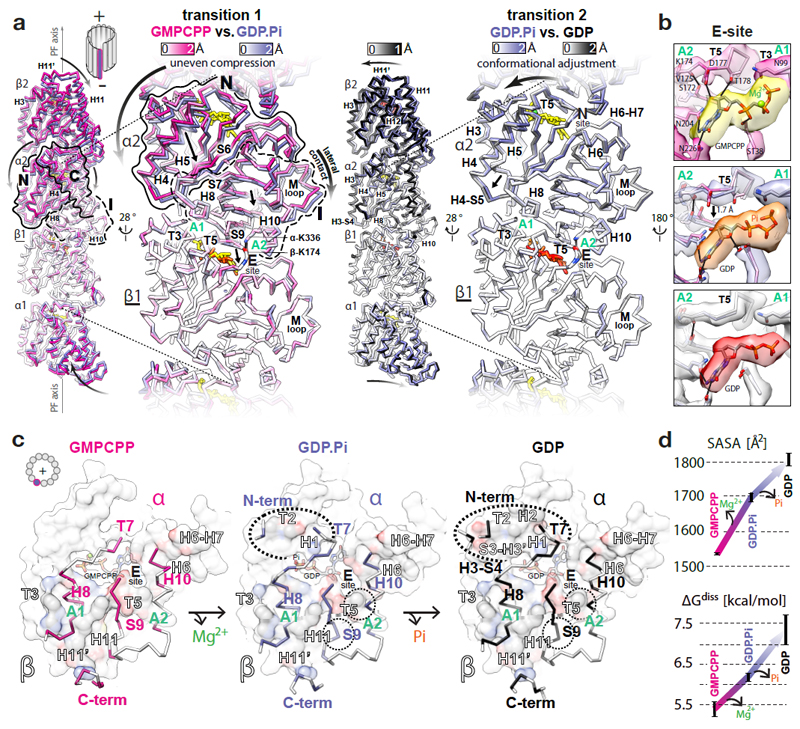
Figure 2
GTPase-dependent structural transitions strengthen the longitudinal MT lattice contacts.
a , Backbone front view and angled close-up cut-away view comparisons of different MT nucleotide states based on superposition on the u03b21-subunit (underlined); coloured by the degree of displacemen...
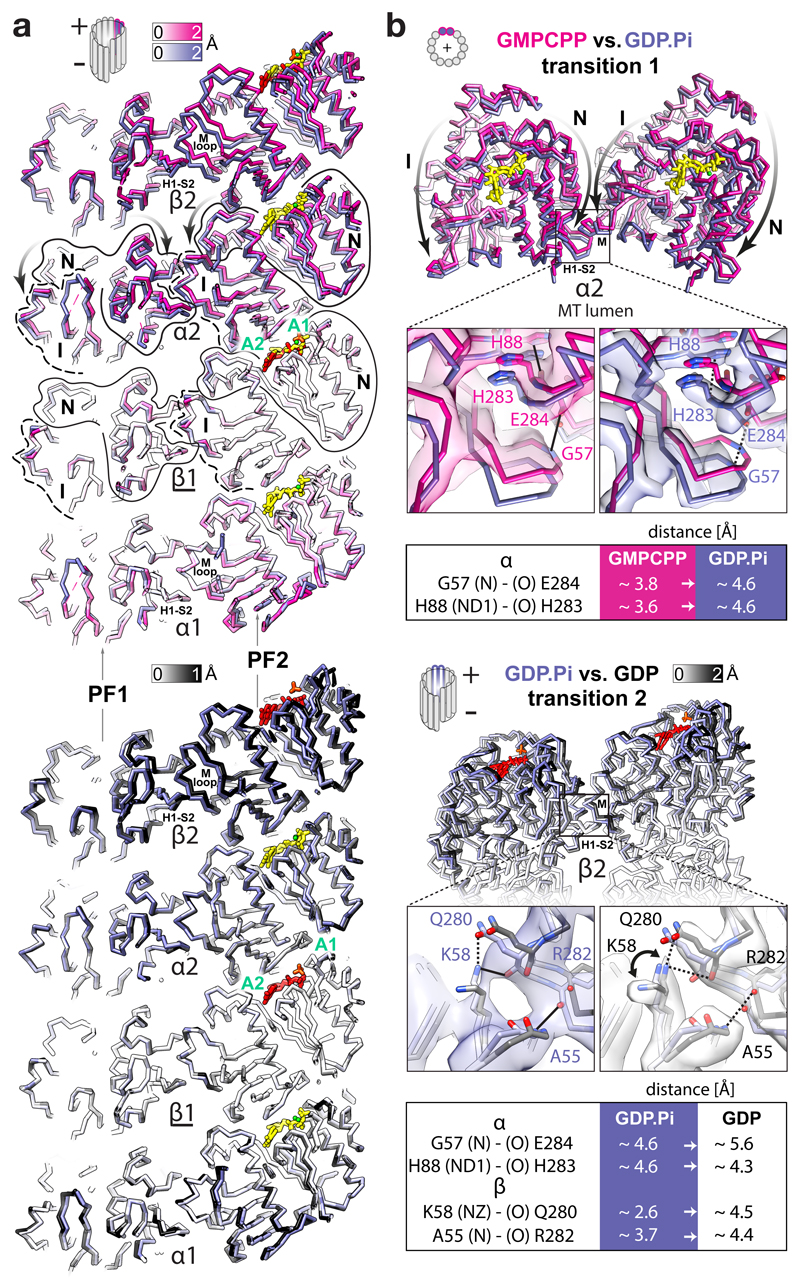
Figure 3
FGTPase-dependent structural transitions weaken the lateral MT lattice contacts.
a , Backbone lumenal cut-away view at lateral contacts between two adjacent PFs in different nucleotide states, aligned and coloured as in Fig. 2a . Tubulin domains are outlined and their transitions ...
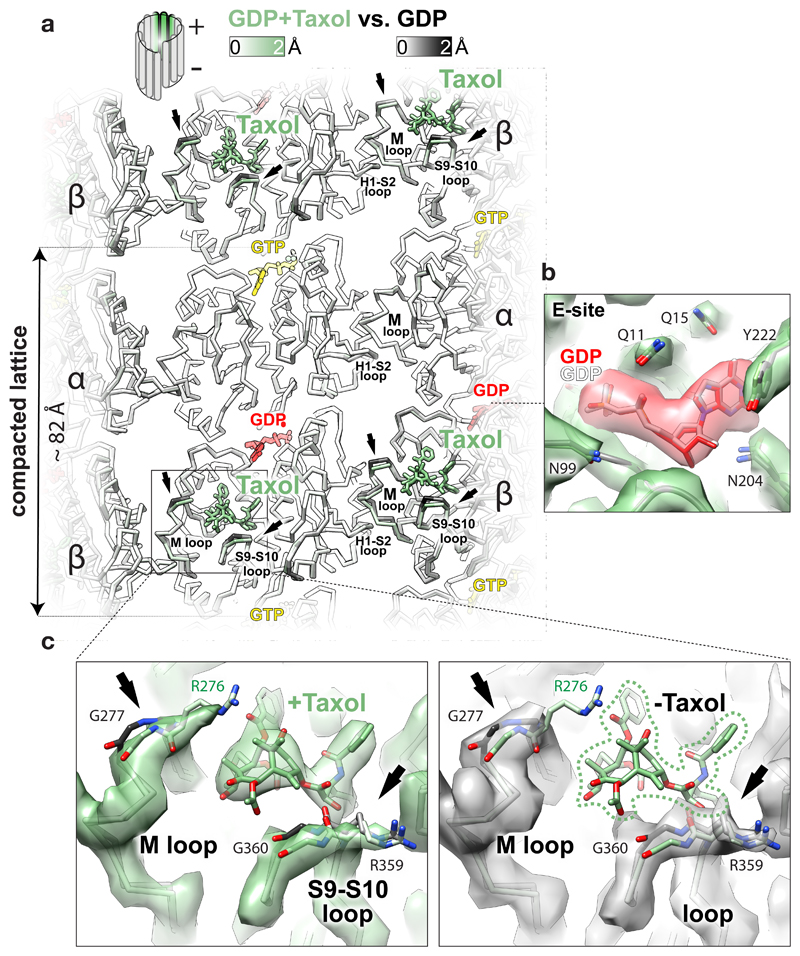
Figure 4
Effect of Taxolu00ae binding to GDP-DCX-MT.
a , Lumenal backbone view of GDP-DCX-MT structure with Taxolu00ae superposed on the GDP-DCX-MT structure without Taxolu00ae, coloured by the degree of displacement or as follows: Taxolu00ae, green sti...
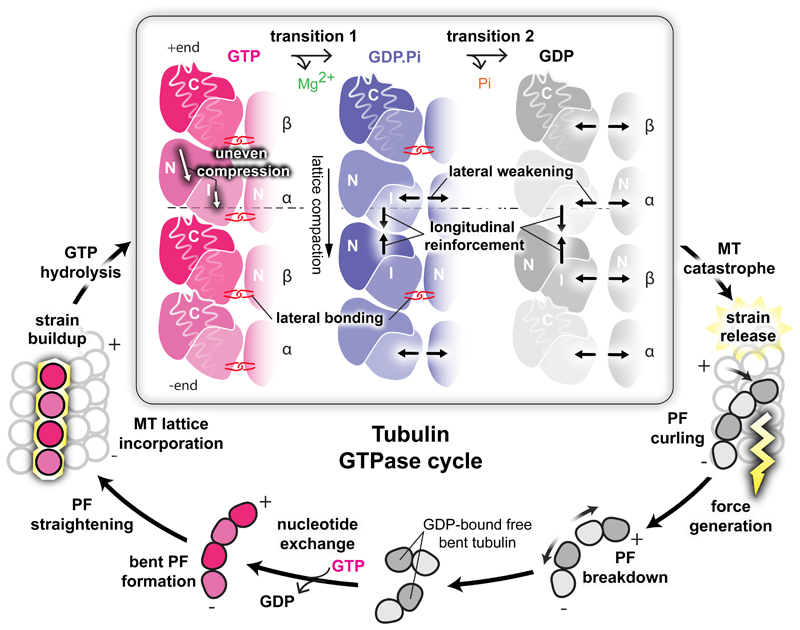
Figure 5
Mechanisms and implications of MT catastrophe and the tubulin GTPase cycle.
The specific area of this work (framed) is presented together with other stages of GTPase cycle discussed in the paper. Free GDP-bound tubulin exchanges E-site GDP to GTP and starts MT nucleation by a...
Figure images are served from the NIH/NLM PubMed Central Open Access Subset or Europe PMC; copyright remains with the publishers and authors.
💬 Discussion
0 commentsNo comments yet. Be the first to start a discussion!
Leave a Comment