Abstract
Site-specific differences in skin response to pathogens and in the course of cutaneous inflammatory diseases are well appreciated. The composition and localization of cutaneous leukocytes has been studied extensively using histology and flow cytometry. However, the precise three-dimensional (3D) distribution of distinct immune cell subsets within skin at different body sites requires visualization of intact living skin. We used intravital multiphoton microscopy in transgenic reporter mice in combination with quantitative flow cytometry to generate a 3D immune cell atlas of mouse skin. The 3D location of innate and adaptive immune cells and site-specific differences in the densities of macrophages, T cells, and mast cells at four defined sites (ear, back, footpad, and tail) is presented. The combinatorial approach further demonstrates an as yet unreported age-dependent expansion of dermal gamma-delta T cells. Localization of dermal immune cells relative to anatomical structures was also determined. Although dendritic cells were dispersed homogeneously within the dermis, mast cells preferentially localized to the perivascular space. Finally, we show the functional relevance of site-specific mast cell disparities using the passive cutaneous anaphylaxis model. These approaches are applicable to assessing immune cell variations and potential functional consequences in the setting of infection, as well as the pathogenesis of inflammatory skin conditions.
🔬 Techniques
💻 Software
✨ Fluorophores
🧪 Sample Preparation
🔬 Cell Lines
🏭 Microscope Brands
🔴 Lasers
💻 Software Details
🏛️ Research Organizations (ROR)
Affiliated research institutions:
📋 Methods
Quantitative analysis of cell distances to blood vessels demonstrate differences between dermal populations in murine ears in vivo The localization of some immune cell subsets in close proximity to blood vessels has been described on tissue sections ( Eady et al ., 1979 ). In order to quantify the 3D relationship between leukocytes and the vasculature in vivo , we developed an image analysis algorithm to automate the measurement of distances of leukocytes to blood vessels in the ear of mice under live imaging conditions (see Supplementary Materials and Methods ; freely available at http://www.matebiro.com/software/immuneatlas ). We included mast cells, which are largely non-migratory ( Figure 4a , top row ), and DDC, which show constitutive migration within non-inflamed dermis ( Ng et al ., 2008 ) ( Figure 4a , bottom row ). We found that 54.2% and 36.4% of mast cells and DDC, respectively, resided within 10 μm of the nearest blood vessel ( Figure 4b ). Overall, differences in cell to blood vessel distances for mast cells and DDC were highly significant ( Figure 4c ), confirming the non-homogeneous distribution of individual leukocyte subsets in the dermis by live imaging in vivo .
Materials and Methods Mice
C57BL/6 mice were obtained from the Animal Research Centre in Perth, Australia. Albino C57BL/6 (B6(Cg)- Tyr c-2J /J), Cxcr6 +/gfp , and mT/mG mice ( Muzumdar et al. , 2007 ) were purchased from the Jackson Laboratory. CD11c-YFP mice ( Lindquist et al ., 2004 ) were a gift from M. Nussenzweig. The c-Kit-eGFP mice ( Berrozpe et al ., 2006 ) were a gift from P. Besner. The Csf1r -EGFP (MacGreen) mice ( Sasmono et al ., 2003 ) were a gift from D. Hume. DPE-GFP mice have been described previously ( Mempel et al ., 2006 ). Mice were bred and maintained on the C57BL/6 background in pathogen-free conditions at the Centenary Institute animal facility. Kit W-sh/W-sh ( Grimbaldeston et al ., 2005 ) backcrossed 14 generations to C57BL/6J mice and also albino C57BL/6(Cg)- Tyr c-2J /J were bred and maintained at the Institute of Medical and Veterinary Science animal facility, Adelaide. All experiments performed were approved by the Animal Ethics Committees at the University of Sydney (Sydney, Australia), Royal Prince Alfred Hospital (Sydney, Australia) and the Institute of Medical and Veterinary Science Animal Ethics Committee (Adelaide, Australia).
Show full methods section
Quantitative analysis of cell distances to blood vessels demonstrate differences between dermal populations in murine ears in vivo The localization of some immune cell subsets in close proximity to blood vessels has been described on tissue sections ( Eady et al ., 1979 ). In order to quantify the 3D relationship between leukocytes and the vasculature in vivo , we developed an image analysis algorithm to automate the measurement of distances of leukocytes to blood vessels in the ear of mice under live imaging conditions (see Supplementary Materials and Methods ; freely available at http://www.matebiro.com/software/immuneatlas ). We included mast cells, which are largely non-migratory ( Figure 4a , top row ), and DDC, which show constitutive migration within non-inflamed dermis ( Ng et al ., 2008 ) ( Figure 4a , bottom row ). We found that 54.2% and 36.4% of mast cells and DDC, respectively, resided within 10 μm of the nearest blood vessel ( Figure 4b ). Overall, differences in cell to blood vessel distances for mast cells and DDC were highly significant ( Figure 4c ), confirming the non-homogeneous distribution of individual leukocyte subsets in the dermis by live imaging in vivo .
Materials and Methods Mice
C57BL/6 mice were obtained from the Animal Research Centre in Perth, Australia. Albino C57BL/6 (B6(Cg)- Tyr c-2J /J), Cxcr6 +/gfp , and mT/mG mice ( Muzumdar et al. , 2007 ) were purchased from the Jackson Laboratory. CD11c-YFP mice ( Lindquist et al ., 2004 ) were a gift from M. Nussenzweig. The c-Kit-eGFP mice ( Berrozpe et al ., 2006 ) were a gift from P. Besner. The Csf1r -EGFP (MacGreen) mice ( Sasmono et al ., 2003 ) were a gift from D. Hume. DPE-GFP mice have been described previously ( Mempel et al ., 2006 ). Mice were bred and maintained on the C57BL/6 background in pathogen-free conditions at the Centenary Institute animal facility. Kit W-sh/W-sh ( Grimbaldeston et al ., 2005 ) backcrossed 14 generations to C57BL/6J mice and also albino C57BL/6(Cg)- Tyr c-2J /J were bred and maintained at the Institute of Medical and Veterinary Science animal facility, Adelaide. All experiments performed were approved by the Animal Ethics Committees at the University of Sydney (Sydney, Australia), Royal Prince Alfred Hospital (Sydney, Australia) and the Institute of Medical and Veterinary Science Animal Ethics Committee (Adelaide, Australia).
Multiphoton imaging
A combination of ex vivo and in vivo imaging of murine skin were performed. For in vivo imaging, mice were anesthetized with Ketamine/Xylazine (80/10mg/kg, i.p.) with repeated half-doses as required. The anesthetized mouse was mounted on a custom-built ear stage with its body temperature controlled as described previously ( Ng et al ., 2008 ; Li et al. , 2012 ). MPM was performed on a custom-built TriMScope (LaVision BioTec, Bielefeld, Germany) attached to an Olympus BX-51 fixed stage microscope equipped with either a 16× (Nikon LWD, NA 0.80; Nikon, Tokyo, Japan) or 20× (Olympus XLUMPlanFl IR coated, numerical aperture (NA) 0.95; Olympus, Center Valley, PA) water immersion objective. For ex vivo imaging, mice were euthanized using CO 2 asphyxiation, hair removed with Nair, and tissue harvested from the ear, dorsal back, footpad and tail skin. A wideband mode-locked Ti:sapphire femtosecond laser (Mai Tai HP/Spectra-Physics; Newport Corporation, Irvine, CA) was used to excite the skin at a wavelength of 920 nm or 940 nm for imaging of GFP and YFP respectively. Blood vessels were visualized through i.v . (tail vein) injection of Evans blue (Gurr-Searle Diagnostic) conjugated to BSA ( Abtin et al ., 2014 ). The combinatorial approach using MPM and flow cytometry for enumeration of actual epidermal and dermal leukocyte densities in transgenic fluorescent mice in situ Image stacks were acquired from MacGreen, CD11c-YFP, c-Kit-eGFP, DPE-GFP and Cxcr6 +/gfp mice to enumerate LC, DDC, mast cells, macrophages, and lymphoid populations (which include DETC, dermal T cells and dILC2), respectively. All images obtained were 300 × 300 μm or 400 × 400 μm in the X–Y direction with a pixel resolution of 500 × 500 pixels. Two or 4 μm spacing in the z-axis was used through the entire depth of the tissue (up to 300 μm from the epidermis). Incrementing power when imaging deeper into the skin was facilitated through the Imspector software. Images were counted manually using the ‘multi-point’ selection tools (ImageJ, US National Institutes of Health) to determine the density of GFP + /YFP + cells. The expression of fluorescent reporter genes by flow cytometry was obtained from ear skin samples and used to adjust the density of epidermal and dermal leukocytes for all skin sites. All GFP + cells in c-Kit-eGFP mice were mast cells ( Supplementary Figure 3c ; Berrozpe et al ., 2006 ), and all GFP + cells in the epidermis in MacGreen mice were MHC-II hi CD326 + LC ( Puttur et al. 2010 ). The other reporter mice utilized in this study required adjustment to determine the actual density based on the fact that 64±4.4% of CD64 − MHC-II hi DC expressed YFP in CD11c-YFP mice, while 42±10.5% of CD64 + macrophages were GFP + in DPE-GFP mice. In Cxcr6 +/gfp mice, GFP expression was observed in all CD3 hi DETC and 72±5.2% of dermal CD90 hi CD3 int T cells. Leukocyte density was determined by: density of cell A = [density GFP + cells] × [percentage of GFP + cells of cell type A] ÷ [percentage of cell type A that are GFP + ] (see also Supplementary Table 1 ). Data was normalized to per mm 2 or per mm 3 .
Supplementary Material Supplementary Data supplement 1
📊 Figures
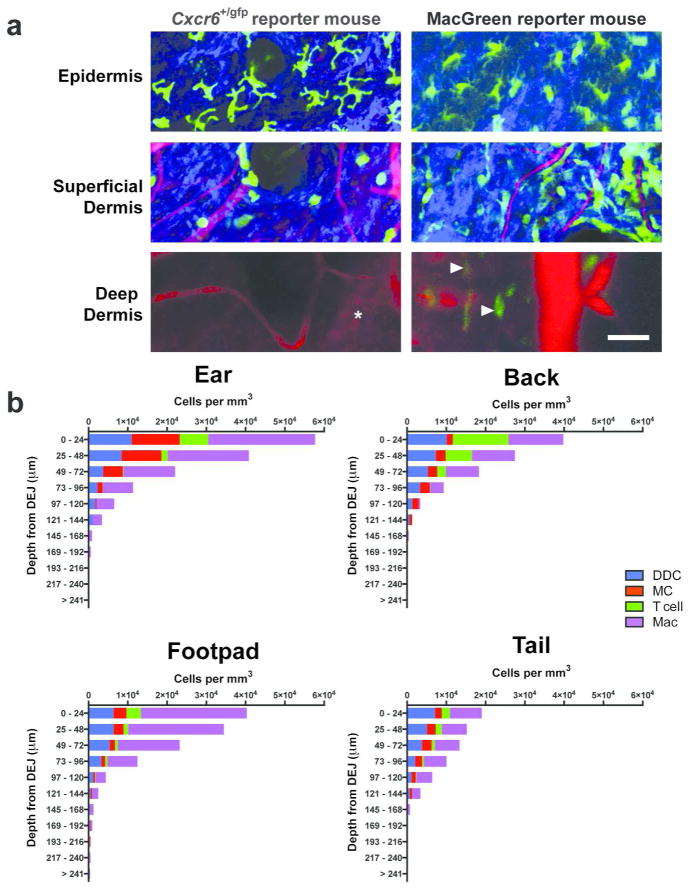
Figure 1
Deep tissue imaging by multiphoton microscopy demonstrates that spatial distribution of dermal leukocytes differ not only in depth but also between sites
(a) Intravital imaging of ear skin of Cxcr6 +/gfp and Csf1r -EGFP (MacGreen) mice at various depths showing GFP + cells (green) in the deep dermis (arrowheads), extracellular matrix in the dermis (SHG...
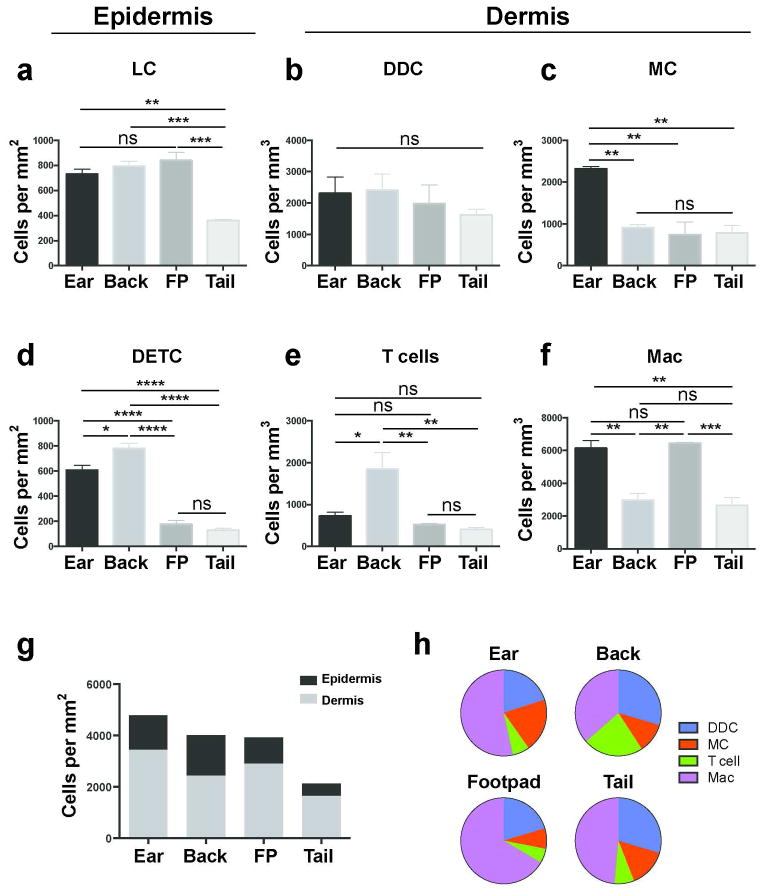
Figure 2
Topographical variation in leukocyte density in the epidermis and dermis
Comparison of leukocyte densities at various cutaneous sites, calculated using the combinatorial approach of MPM and flow cytometry. (a) Langerhans cells (LC) (b) dermal dendritic cells (DDC) (c) mast...
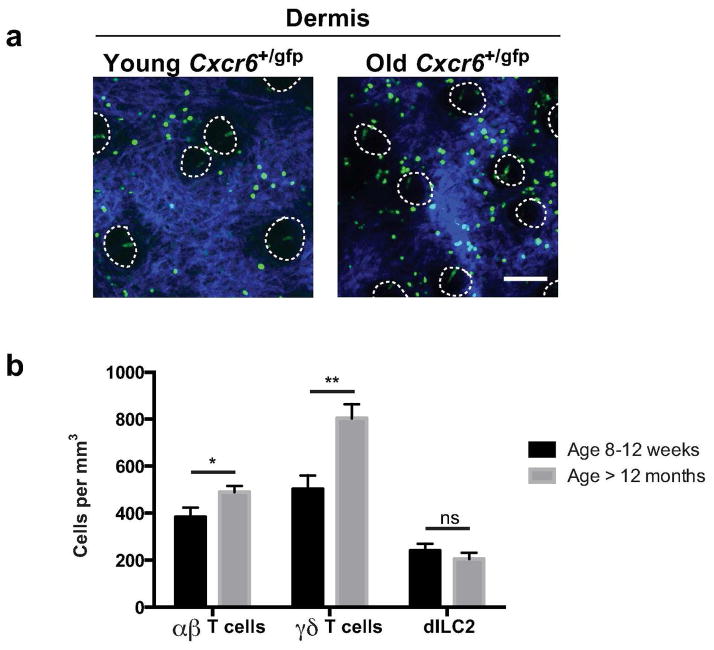
Figure 3
Quantification of group 2 innate lymphoid cells and u03b1u03b2 and u03b3u03b4 T cells in ear skin of young and aged mice
(a) Representative (n > 8 per age group) image of GFP + cells (green) in young (8u201312 weeks) and older ear dermis (> 12 months) of Cxcr6 +/gfp mice with ECM in dermis (SHG signals, blue) and dotted...
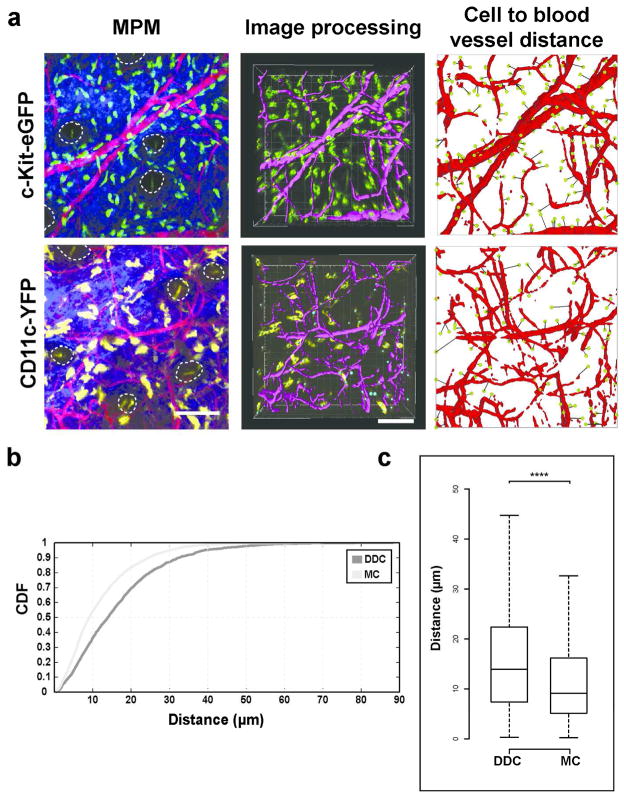
Figure 4
Customized automated cell to blood vessel distance analysis of a migratory and non-migratory dermal population
(a) Left : Representative intravital multiphoton microscopy (MPM) images of c-Kit-eGFP and CD11c-YFP ear skin showing GFP + mast cells (MC; top, green), YFP + dermal dendritic cells (DDC; bottom, yell...
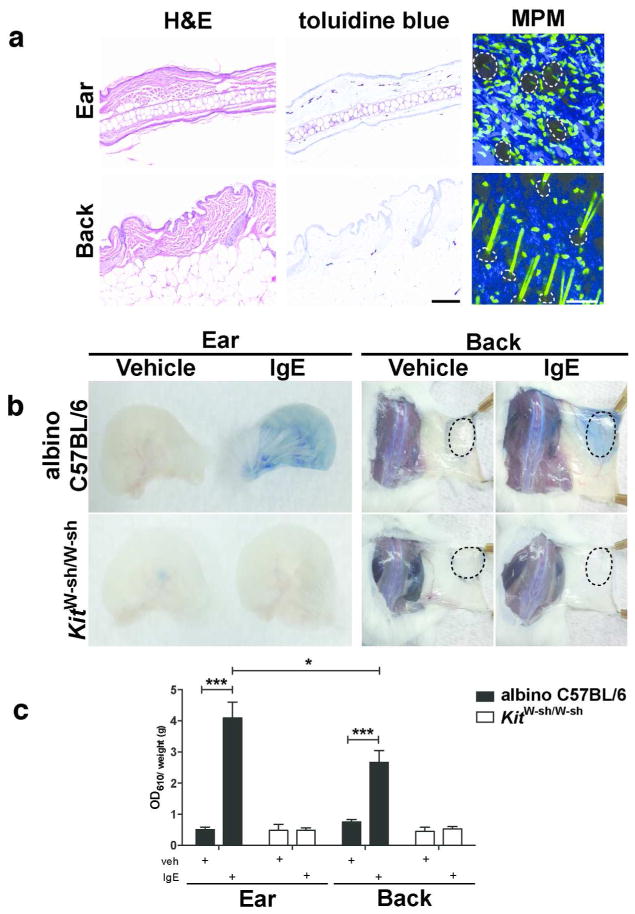
Figure 5
Site-specific differences in mast cell numbers quantified by multiphoton imaging and the passive cutaneous anaphylaxis functional assay
(a) Histology from albino C57BL/6 -Tyr c-2J /J ear or back skin stained with H&E and toluidine blue; multiphoton microscopy (MPM) of c-Kit-eGFP ear or back skin demonstrating GFP + mast cells (green),...
Figure images are served from the NIH/NLM PubMed Central Open Access Subset or Europe PMC; copyright remains with the publishers and authors.
💬 Discussion
0 commentsNo comments yet. Be the first to start a discussion!
Leave a Comment